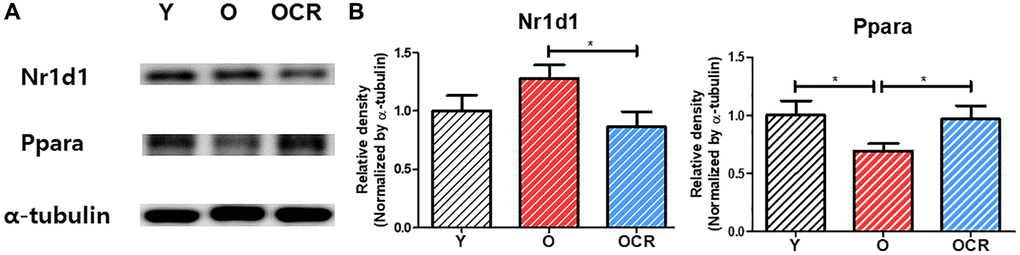
Figure 8.Protein expression of NR1D1 and PPARα during aging and CR (n = 6 per group). (A) Representative images of NR1D1 and PPARα bands. (B) Relative expression of NR1D1 and PPARα. The expression of NR1D1 increases during aging and decreases under CR. In contrast, the expression of PPARα is downregulated during aging but upregulated by CR. Data are presented as mean ± SEM. Abbreviations: Y: Young; O: Old; OCR: Old-CR. *p < 0.05 between two groups.