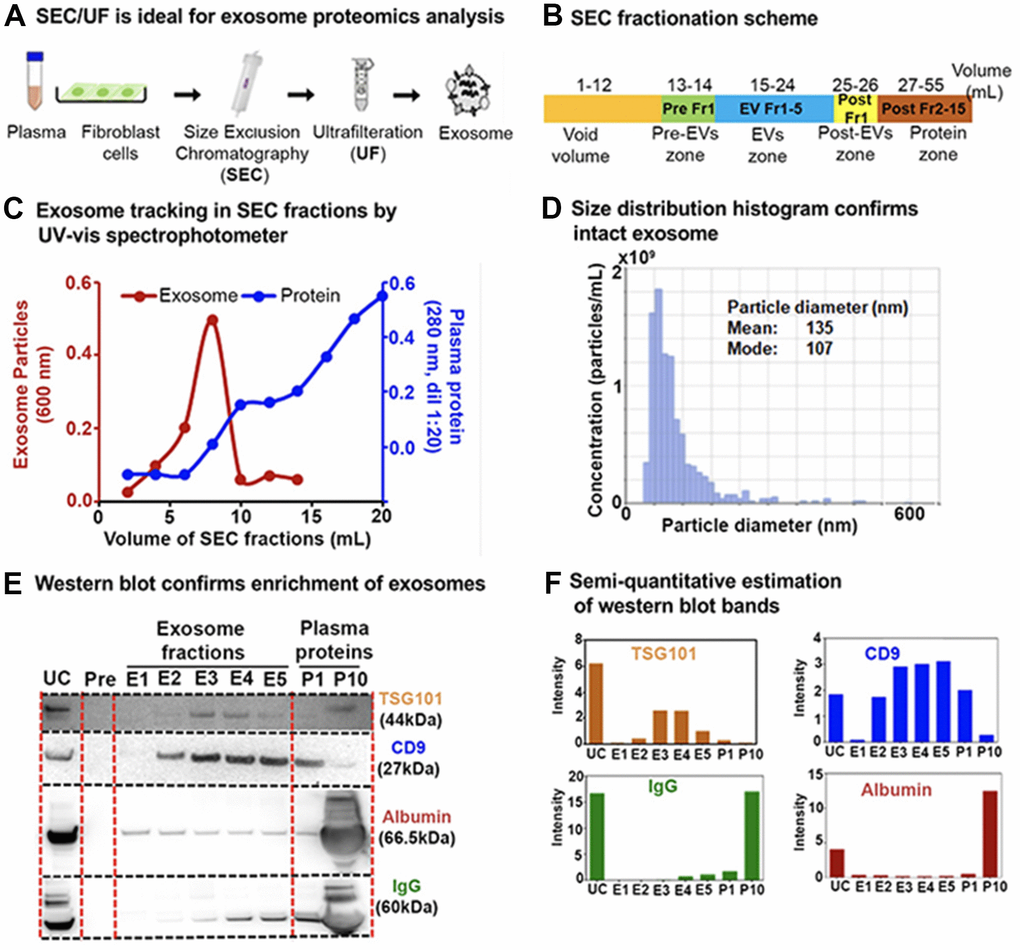
Figure 2.Exosome enrichment from plasma and primary human lung fibroblasts (IMR90) and characterization. (A) Exosome isolation workflow using sequential size-exclusion chromatography and ultrafiltration (SEC/UF). (B) Scheme for SEC fraction collection. (C) Spectrophotometric quantification of exosomes in SEC fractions. Red, Exosome (OD600); Blue, plasma proteins (OD280, dilution 1:20). (D) Exosome size distribution analysis by qNano Gold. Mean diameter; 135 nm, Mode diameter; 107 nm. (E) Immunoblot of exosome protein markers; CD9 antigen (CD9) and Tumor susceptibility gene 101 protein (TSG101) in different exosome fractions to confirm enrichment. IgG and albumin were used as determinants of plasma protein contaminants. E1–E5: exosome fractions, P1: the pool of fractions 11 + 12, and P10: the pool of fractions 29 + 30 (1:20 dilution) were loaded for comparison between plasma proteins and exosome fractions. (F) Semi-quantitative estimation of the volume intensities of western blot bands using Image J software.