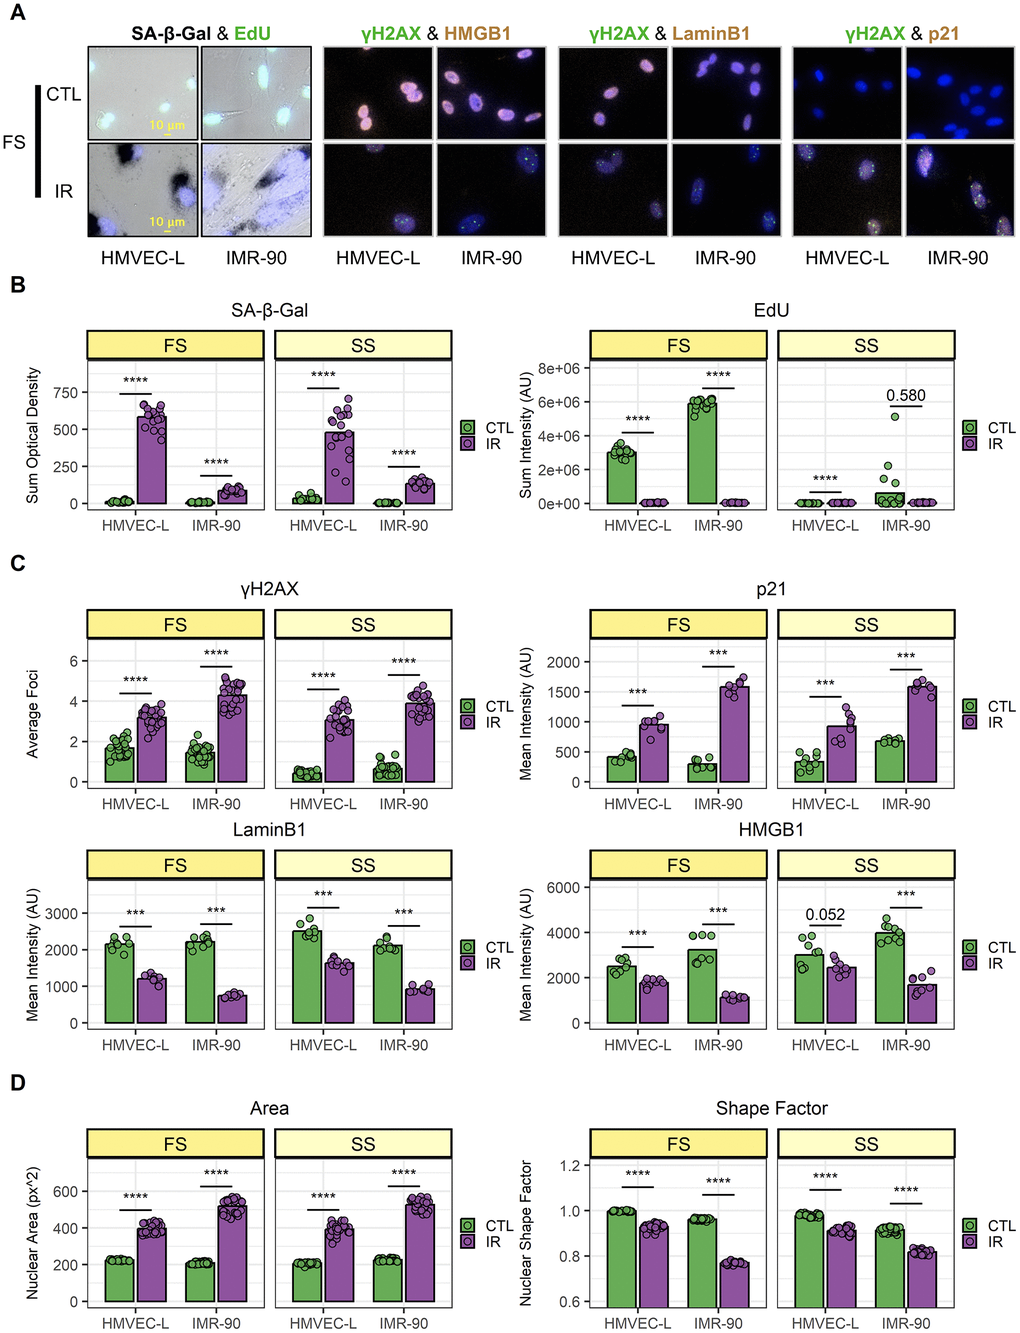
Figure 2.Validation of senescence induction and population-level heterogeneity. (A) Representative images of senescence marker staining from full-serum (FS) samples. Top: mock-irradiated cells (CTL); bottom: ionizing-radiation-induced senescent cells (IR). For each co-staining, endothelial cells (HMVEC-L) are shown on the left; fibroblasts (IMR-90) are shown on the right. (B–D) Image quantification of HMVEC-L and IMR-90 cells for both FS and serum-starved (SS) conditions. CTL samples are in green, while IR samples are in purple. Data shown are from 2 independent experiments. (B) SA-β-Gal (left) and EdU (right) staining quantification. Each data point corresponds to one well (n = 18); bars indicate mean values. (C) Immunocytochemistry staining quantification. Top-left: γH2AX; top-right: p21; bottom-left: LaminB1; bottom-right: HMGB1. Each data point corresponds to one well (γH2AX n = 27; p21, LaminB1, and HMGB1 n = 9); bars indicate mean values. (D) Nuclear morphology feature quantification. Left: nuclear area; right: shape factor. Each data point corresponds to one well (n = 27); bars indicate mean values. ***: p-value < 10-3; ****: p-value < 10-4; non-significant values (p-value > 0.05) are shown.