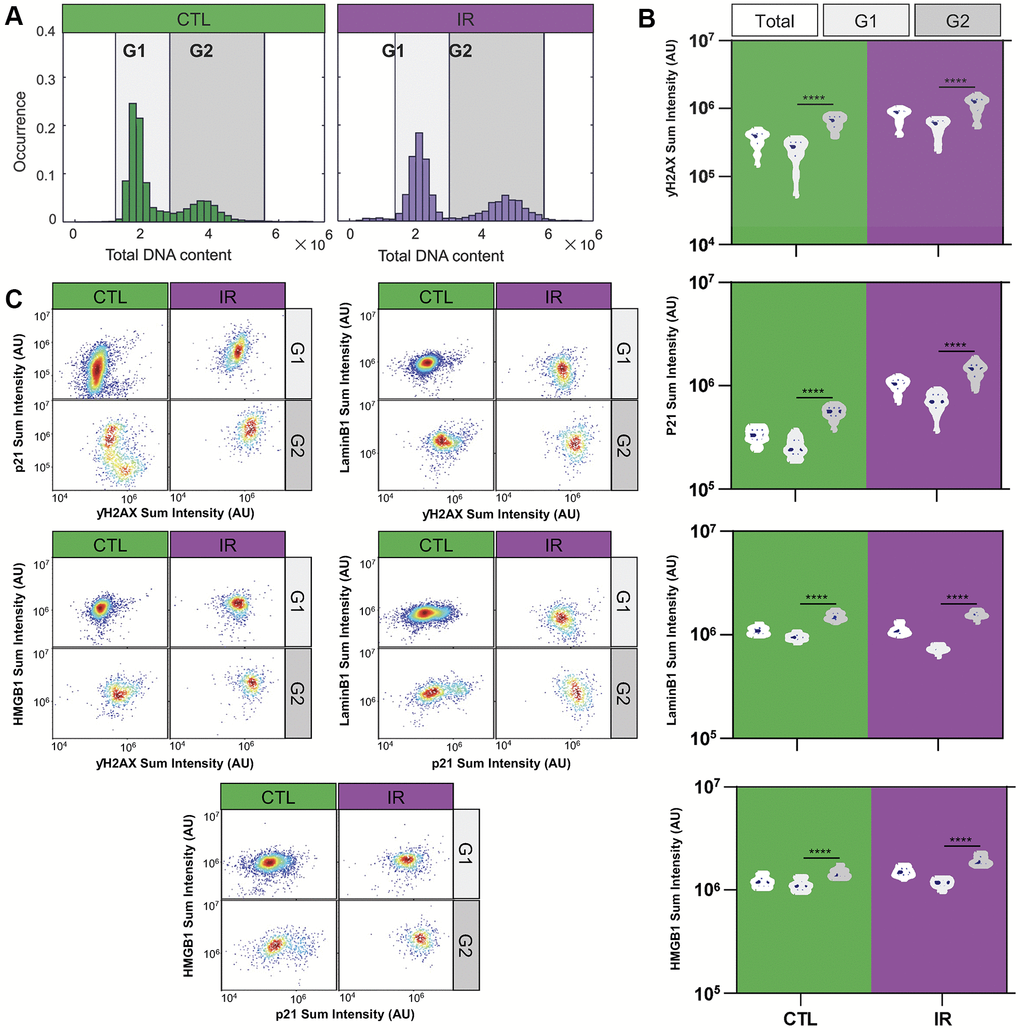
Figure 3.Differential expression of senescence markers in G1 and G2 senescent HMVEC-L endothelial cells. (A) Histograms illustrate the distribution of total DNA content in individual cells under control and IR-treated conditions. DNA content is measured by the DAPI staining intensity in cell nuclei. The G1 and G2 cell cycle states are differentiated based on DAPI staining intensity. (B) Violin plots present the average expression levels of various senescence markers from replicated wells and experiments within the overall population, as well as specifically in G1 or G2 states. A one-way ANOVA statistical test was performed where *: p-value < 0.05; **: p-value < 0.01; ***: p-value < 0.001; ****: p-value < 0.0001. The expression levels of senescence markers significantly differ between cell cycle states. (C) Density scatter plots show the single-cell expression levels of various pairs of senescence markers in cells at G1 and G2 states, respectively. The markers include P21 vs. γH2AX, Lamin B1 vs. γH2AX, HMGB1 vs. γH2AX, Lamin B1 vs. P21, and HMGB1 vs. P21 at the single-cell level under both IR and control conditions. Colors indicate density regional distribution density within the scatter plot.