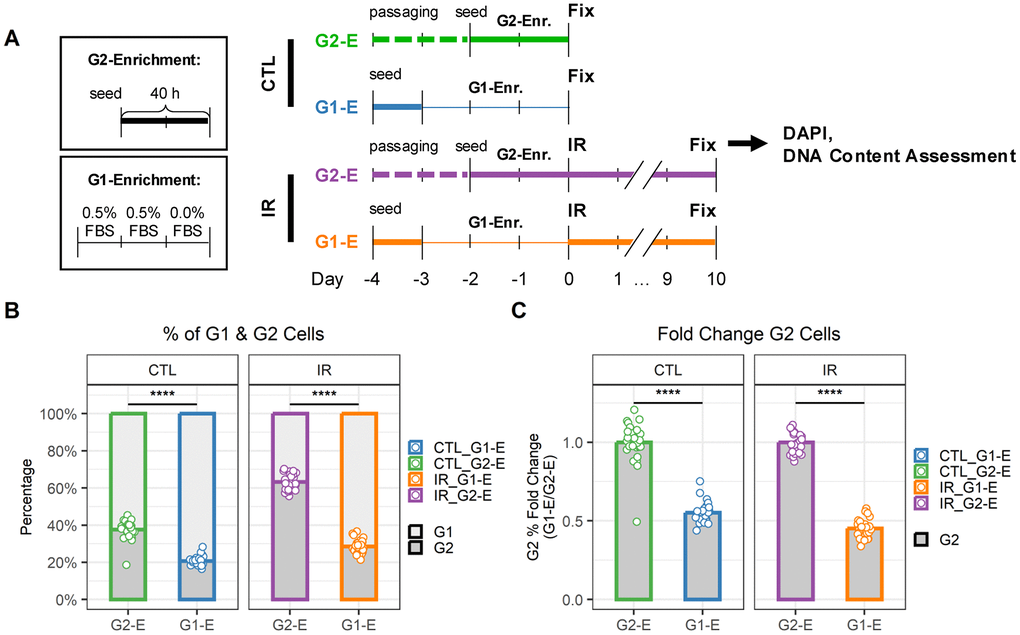
Figure 4.G1 and G2 enrichment protocol for senescent endothelial cells. (A) Workflow to compare DNA content in cells just before irradiation (CTL) and senescent cells 10 days after irradiation (IR) when enriched for either G1 (G1-E) or G2 (G2-E) cells. (B) Percentage of G1 and G2 cells per well. Each data point is a well (n = 30); bars indicate mean values. (C) Fold change of G1 (left) and G2 (right) percentages in IR-G1-E vs. IR-G2-E groups. Each data point is a well (n = 30); bars indicate mean values.