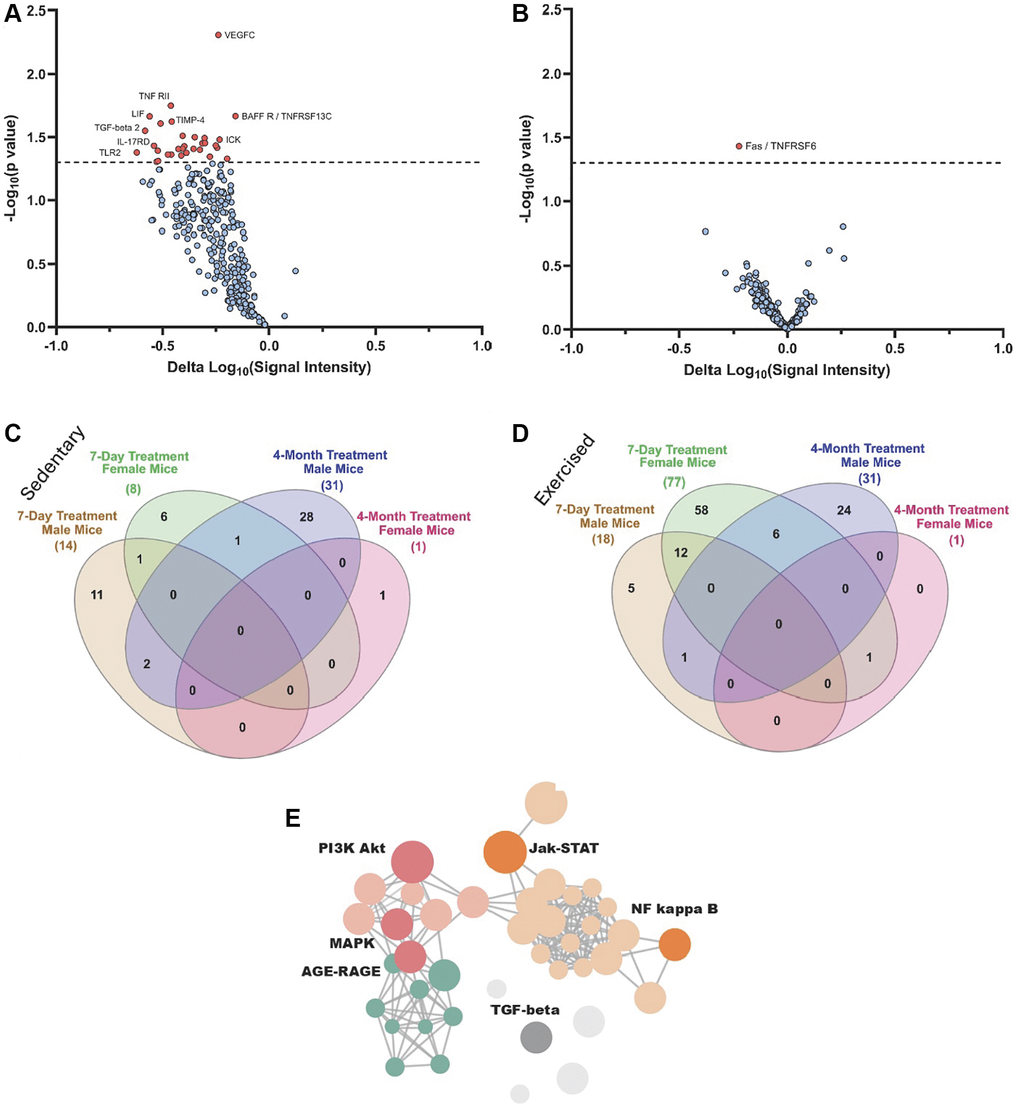
Figure 5.Proteomic changes in male and female mice after 4-months of OT+A5i vs. vehicle. (A) Volcano plot showing DEPs in male mice, based on antibody arrays data. (B) Volcano plot showing DEPs in female mice, based on antibody arrays data. (C) Venn diagram on the overlap of DEPs (p < 0.05 OT+A5i vs. vehicle control) between sedentary 7-day treated males and females, and 4-month treated males, and females. (D) Venn diagram on the overlap of DEPs (p < 0.05 OT+A5i vs. vehicle control) between exercised 7-day treated males and females, and the same as in C 4-month treated males, and females. (E) Enrichment analysis for differentially expressed proteins in the male mice, using KOBAS with KEGG pathway analysis. 7-days n = 8 control vehicle (4 males, 4 females), n = 8 OT+A5i (4 males, 4 females). 4-months: n = 4 all cohorts, except, n = 3 OT+A5i males.