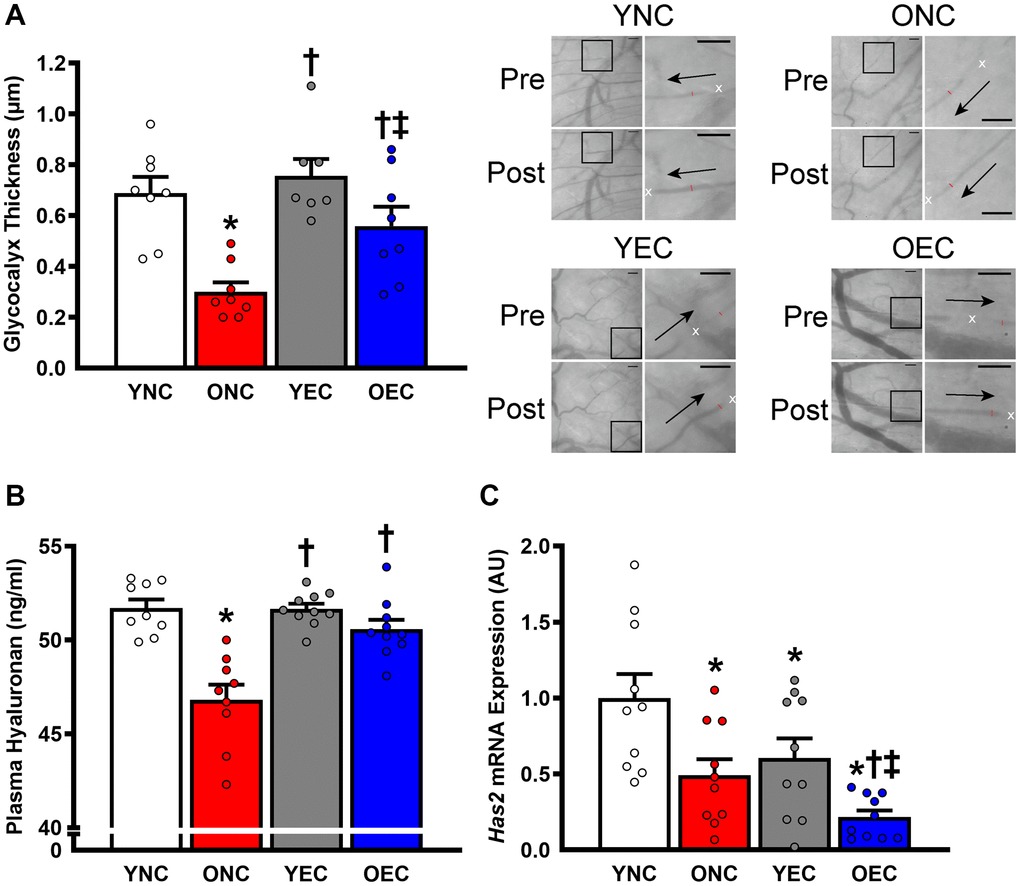
Figure 3.Glycocalyx integrity in young normal chow (YNC), old normal chow (ONC), young Endocalyx™ treatment (YEC), and old Endocalyx™ treatment (OEC) mice. (A) Glycocalyx thickness with representative images demonstrating changes in perfused diameter (red line segment) pre- and post-leukocyte (white x’s) passage with arrows representing direction of flow; scale bar = 50 μm. (B) Plasma hyaluronan concentrations. (C) Aortic Has2 mRNA expression. Data are presented as mean ± SEM. *P < 0.05 vs. YNC; †P < 0.05 vs. ONC; ‡P < 0.05 vs. YEC; N = 7–10/group.