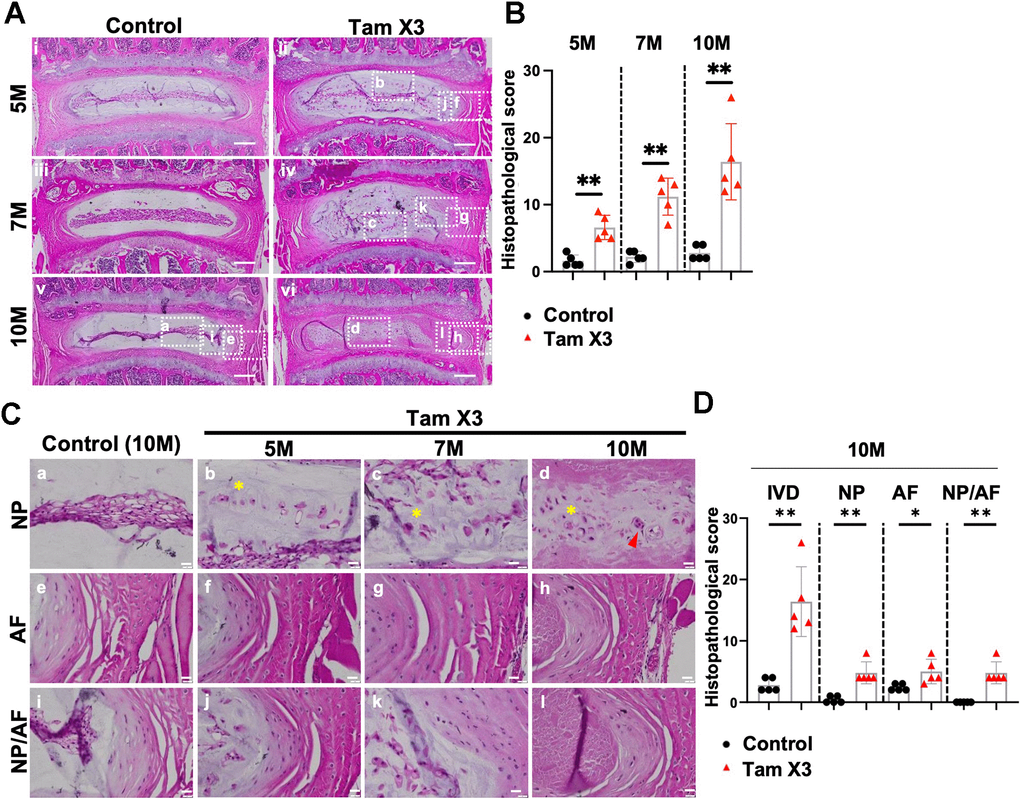
Figure 3.Runx1 overexpression induced age-related intervertebral disc degeneration. (A) Representative images of Hematoxylin and eosin (H&E) staining in the IVDs of control and Runx1 overexpression (Tam X3) mice at 5M, 7M, and 10M. Control mice showed a highly organized IVD structure. The IVDs of Runx1 overexpression (Tam X3) mice showed progressive IVD structure degeneration over time. Scale bar = 200 μm. (B) Total IVD histopathological scores in the IVDs of control and Runx1 overexpression (Tam X3) mice at 5M, 7M, and 10M. Student’s t-test was performed. (** p < 0.01). To compare the effects of different Runx1 expression levels induced by two (Tam X2) or three times (Tam X3) of Tamoxifen injections, we also scored the histological sections of the Tam X2 group and compared them with control and Tam X3 images. Note that the data presented in Supplementary Figure 2 used the same representative images for control and Tam X3 groups as in Figure 3. Since our primary objective was to assess the consequence of Runx1 overexpression on disc aging, we elected to focus the rest of our studies on the highest Runx1 overexpressing mice, which corresponds to the Tam X3 group. (C) Higher magnification of H&E images in the NP, AF and NP/AF boundary in the control and Runx1 overexpression (Tam X3) mice. The control NP comprised of tightly connected notochordal cells in the center. The AF tissue was well organized with a distinct boundary between NP and AF tissues. The IVDs of Runx1 overexpression mice showed multiple nuclei in NP cells and the appearance of cell clusters (d) and disorganized extracellular matrix in the NP, with the presence of round-shaped cells in the inner AF over time. Scale bar = 20 μm. Asterisk indicates disorganized extracellular matrix. Arrowhead indicates cell clusters. (D) Compartment-specific histopathological scores in the IVDs of control and Runx1 overexpression (Tam X3) mice at 10M. The scores were significantly increased in all compartments of Runx1 overexpression mice at 10M, compared to the control. n = 5 mice/group. Student’s t-test was performed (** p < 0.01, * p < 0.05).
Figure 3 — Runx1 overexpression induces early onset of intervertebral disc degeneration | Aging