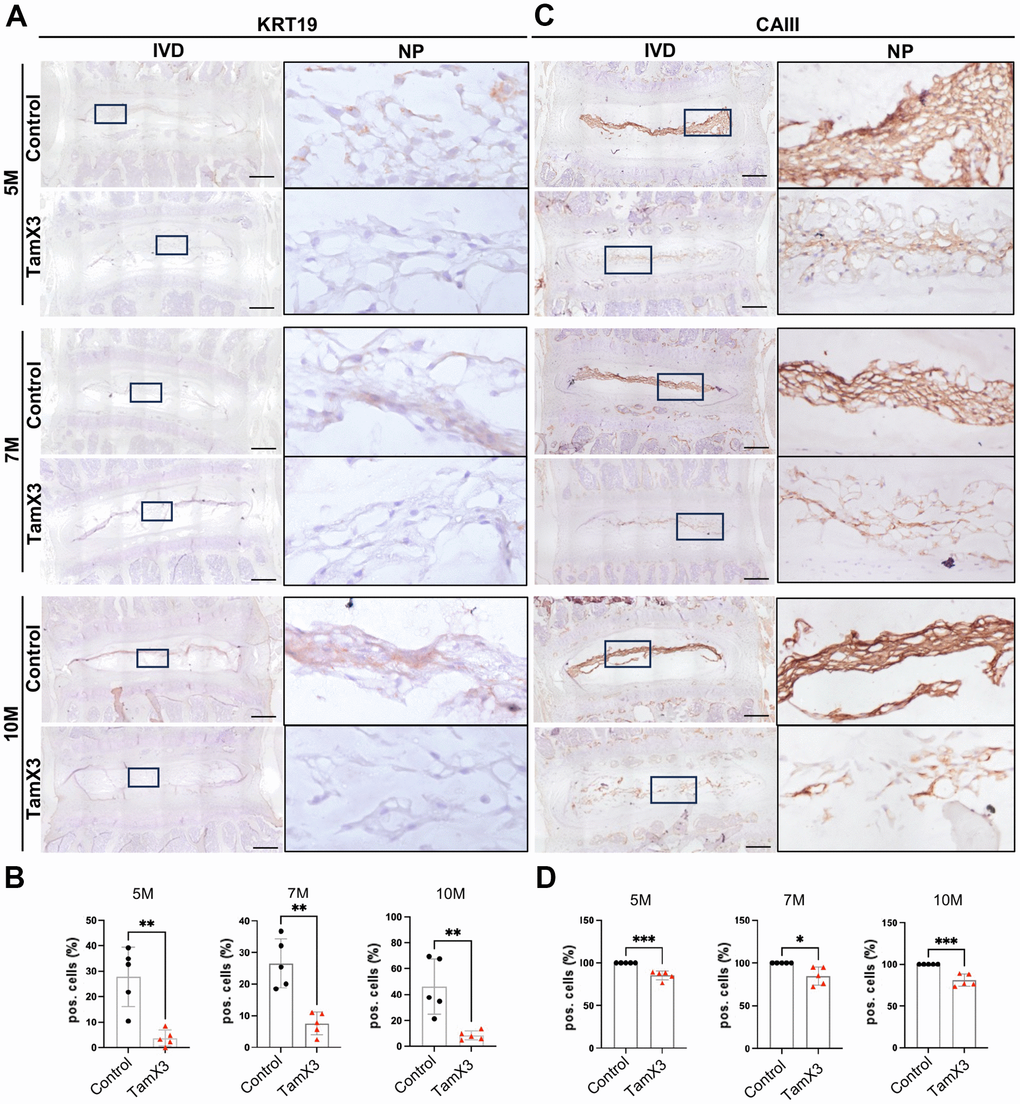
Figure 4.Runx1 overexpression caused the loss of notochordal cell phenotype. (A, C) Representative images of immunohistochemistry staining of notochordal cell marker KRT19 (A) and CAIII (C) at 5M, 7M, and 10M. Scale bar = 200 μm. Magnified NP areas are shown. Hematoxylin was used as nuclei staining and immunopositivity was labeled brown. (B, D) Quantification results showing that the KRT19 (B) and CAIII (D) positive cells were significantly decreased in the NP of Runx1 overexpression mice in all the timepoints examined. n = 5 mice /group. Student’s t-test was performed (* p < 0.05, ** p < 0.01, *** p < 0.001).