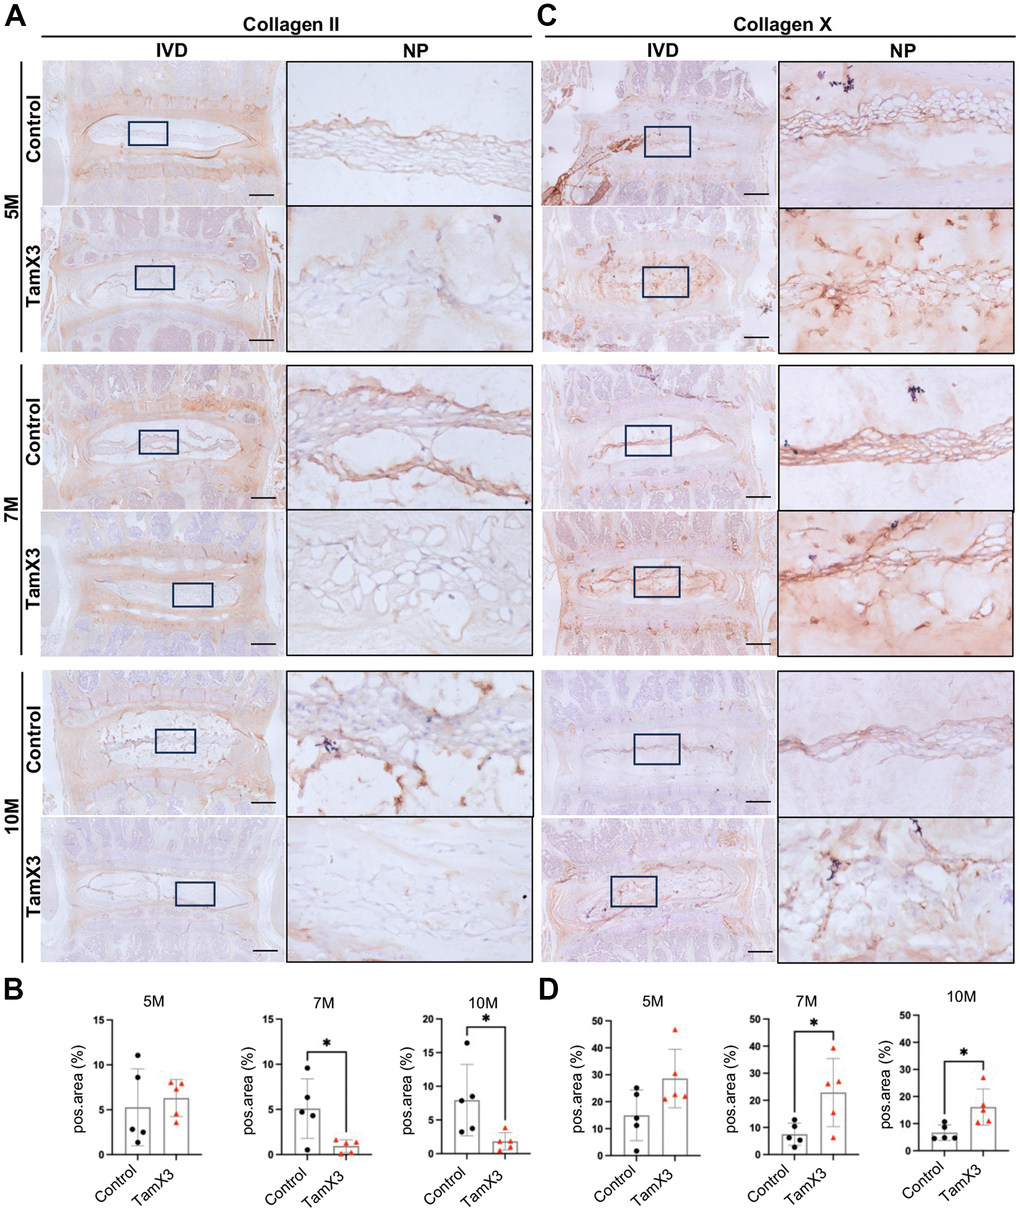
Figure 6.Runx1 overexpression altered collagen composition in the NP. (A, C) Representative images of immunohistochemistry staining of collagen II (A) and collagen X (C) at 5M, 7M, and 10M. Scale bar = 200 μm. Magnified NP areas are shown. Hematoxylin was used as nuclei staining and immunopositivity was labeled brown. (B, D) Quantification results showing that the expression of collagen II (B) was significantly decreased at 7M and 10M while the expression of collagen X (C) was increased in the NP of Runx1 overexpression mice. n = 5 mice /group. Student’s t-test was performed (* p < 0.05).