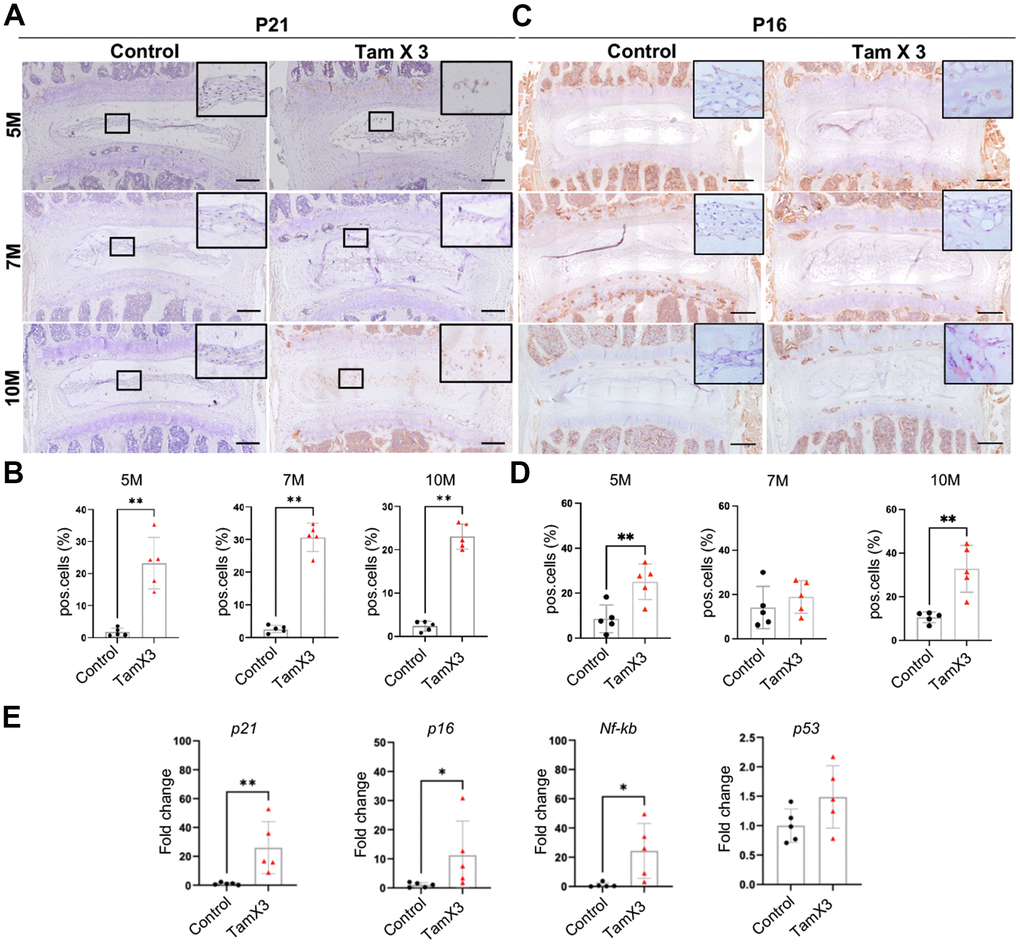
Figure 7.Runx1 overexpression induced NP cell senescence. (A, C) Immunohistochemistry staining for P21 (A) and P16 (B) was conducted to detect the presence of cell senescence in the NP. Scale bar = 200μm. (B, D) Quantification analysis showed that substantial increase in the ratio of P21 positive cells in Runx1 overexpression mice. P16 positive cells were increased significantly at 5M and 10M but not at 7M. n = 5 mice /group. Student’s t-test was performed (** p < 0.01). (E) The gene expression analysis demonstrated the increased levels of p21, p16, and Nf-kb in Runx1 overexpression mice at 10M. The expression level of p53 remained unchanged in the Runx1 overexpression mice. n = 5 mice /group. Student’s t-test was performed (** p < 0.01, * p < 0.05).