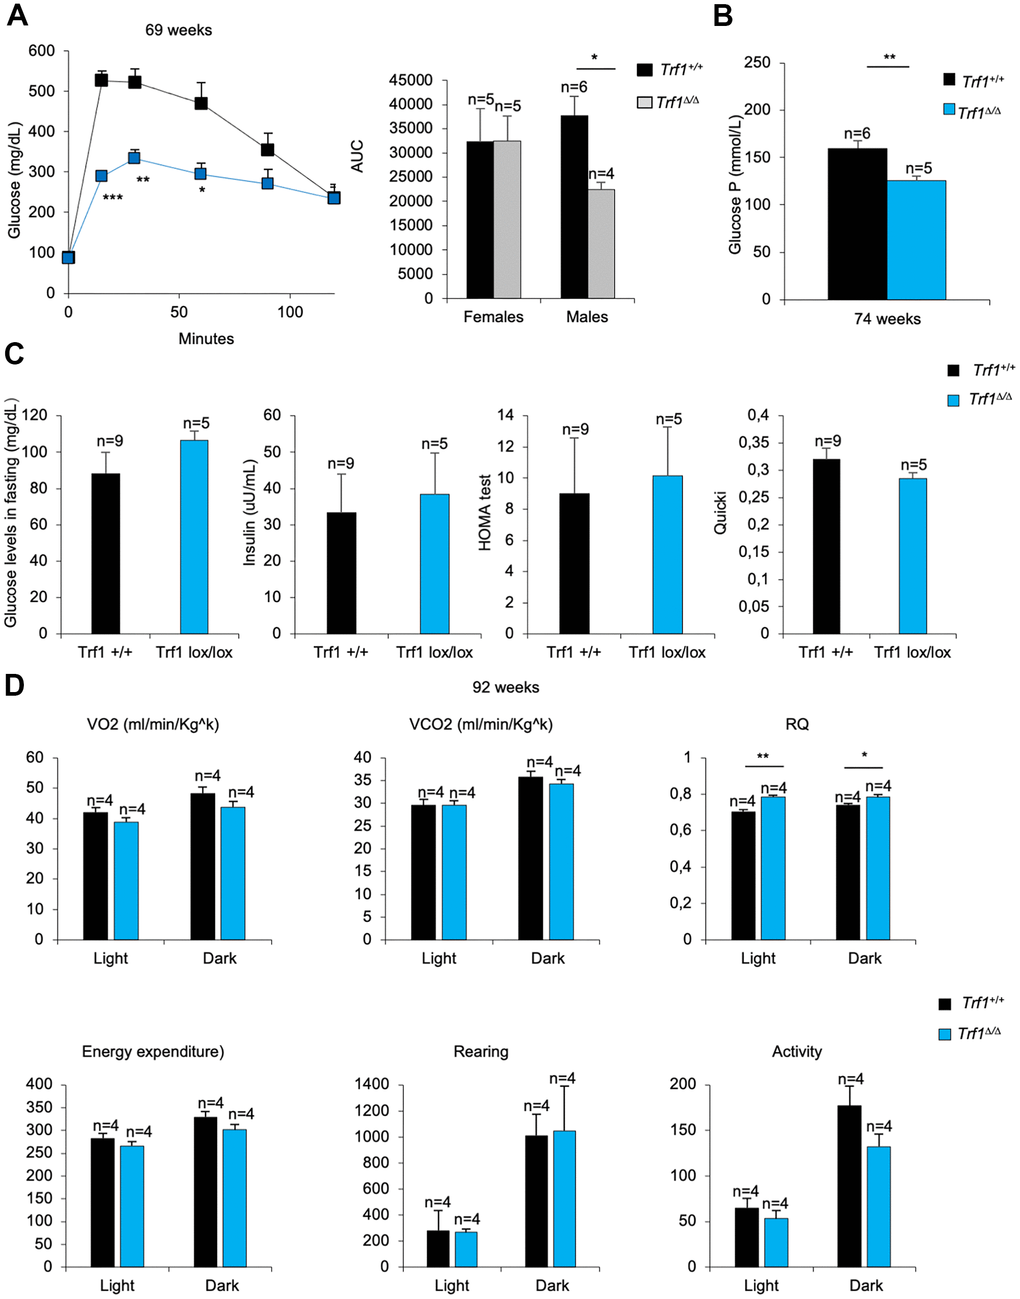
Figure 7.TRF1 deleted males’ better tolerance to glucose. (A) Glucose tolerance test: glucose levels (mg/dl) in males and quantification of the area under the curve (AUC) in females and males. Note that males without Trf1 fed with high-fat diet have better tolerance to glucose. (B) Plasma glucose P levels in males. (C) Males fed in high-fat diet glucose (mg/dL) and insulin levels (uu/mL) in fasting. Derived HOMA-IR insulin resistance quantification, and QUICKI insulin sensitivity quantification in males. (D) Volume of oxygen consumed (VO2), volume of carbon dioxide produced (VCO2) (ml/min/Kgk), respiratory quotient (RQ), energy expenditure rate (EE) (Kcal/day/Kgk), activity and rearing monitorization in 92 weeks males’ mice. Error bars, s.e.m.; only significant values are shown; *P < 0.05; **P < 0.01; ***P < 0.001 determined by two-tailed Student’s t-test (A–D)