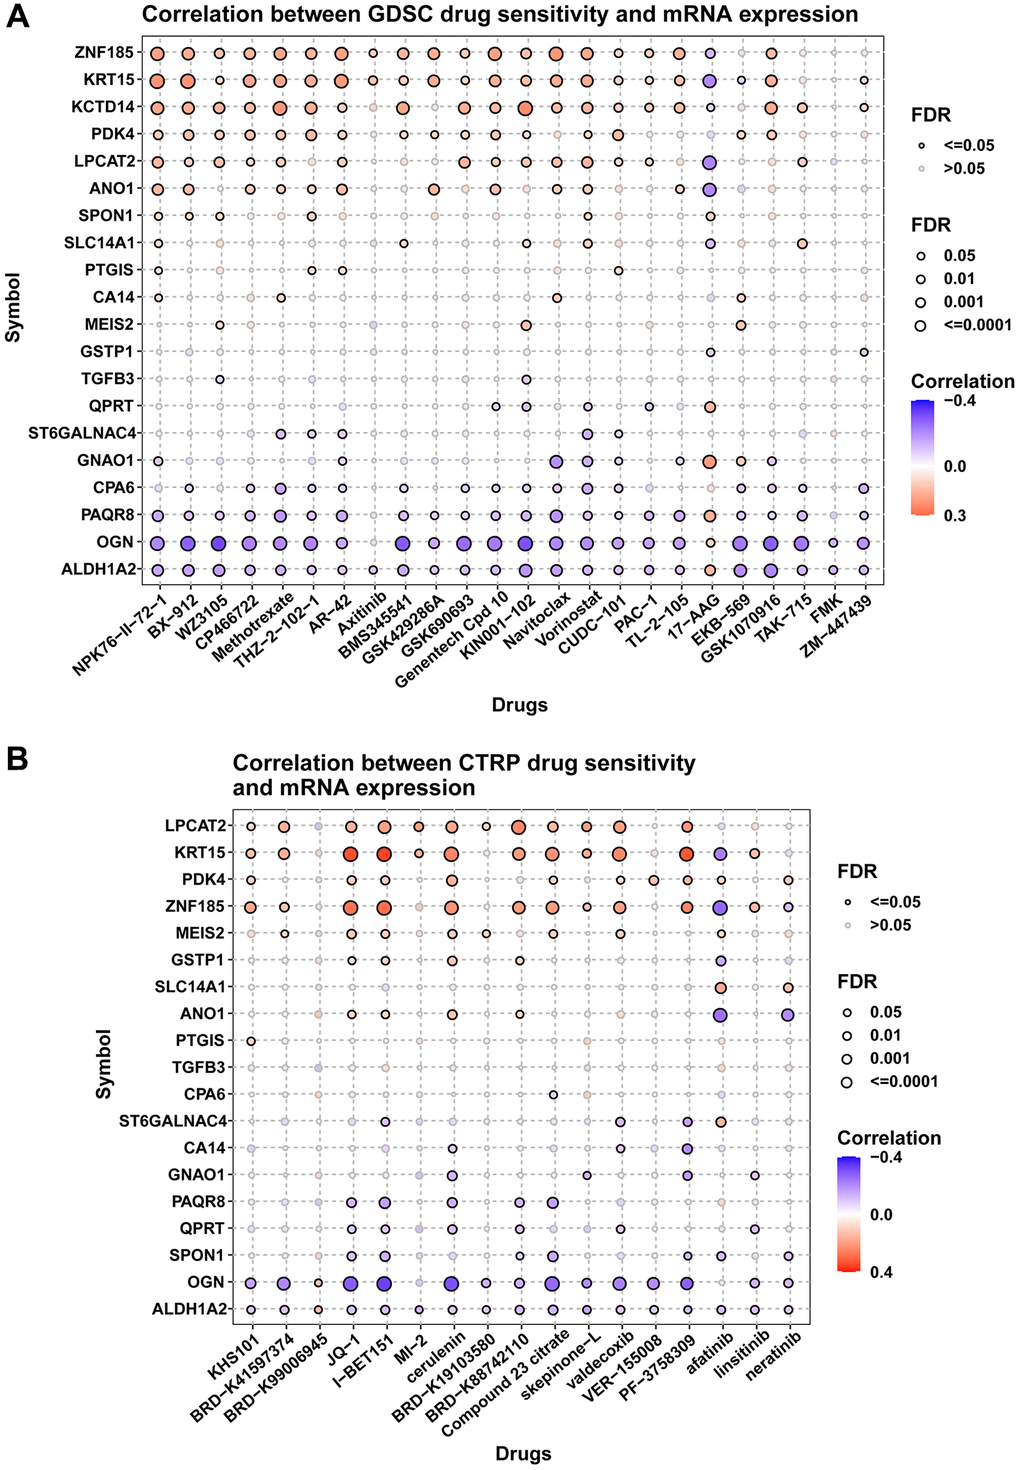
Figure 11.Drug resistance analysis. (A) Figure summarizes the correlation between gene expression and the sensitivity of GDSC drugs. (B) Figure summarizes the correlation between gene expression and the sensitivity of CTRP drugs. Pearson correlation analysis was performed to get the correlation between gene mRNA expression and drug IC50. P-value was adjusted by FDR.