


Introduction
Prostate cancer is one of the most common types of cancer in elderly men [1]. In recent years, the promotion of prostate cancer-based screening has increased the incidence of prostate cancer, while early detection has also reduced prostate cancer specific mortality [2]. In recent years, treatments based on androgen deprivation therapy (ADT) and radiotherapy have greatly improved the prognosis of patients [2, 3]. However, there is still a subset of patients with a poor prognosis. New approaches have been explored to improve patient outcomes, including androgen receptor signaling inhibitors (ARSI) [4] and immunotherapy [5, 6]. However, the prognosis of some patients with prostate cancer remains suboptimal. Therefore, it is also necessary to reveal the pathogenesis of prostate cancer more deeply with new biomarkers.
Currently, bioinformatics methods based on gene expression profiling have been developed to provide effective tools for comprehensive analysis of gene networks in cancer pathogenesis [7]. In recent years, much works studied and reported novel biomarkers with significant status in gene networks of different cancers, including hepatocellular carcinoma [8], breast cancer [9], non-small cell lung cancer [10], bladder cancer [11]. Recent work in bladder cancer [11] demonstrates the value of differential correlation approaches for uncovering network rewiring. In general, biomarkers are determined based on the analysis of differentially expressed genes between disease and healthy tissues. However, there is concern that the occurrence of a disorder is the combined effect of multiple highly interacting genes.
Correlation analysis is an important method for omics data to provide clues to gene regulatory networks [12]. Complementing traditional approaches to the analysis of gene expression data, it is critical to investigate how gene correlations (termed “differential correlations”) vary in cancer pathogenesis [13].
A recent paper reported a set of five dysregulated hub genes (MAF, STAT6, SOX2, FOXO1, and WNT3A) that play crucial roles in biological pathways associated with prostate cancer progression [14]. We constructed a gene correlation network for prostate cancer pathogenesis based on differential correlation theory for the first time and found some novel key genes. First, 20 modules of co-expressed genes were detected by weighted gene co-expression network analysis (WGCNA), in which 3 modules were significantly correlated with prostate cancer; Then, differentially correlated gene pairs in each module with the largest correlation to prostate cancer were calculated, gene networks were constructed and key genes were subjected to functional analysis. Finally, 21 biomarkers derived from web-based algorithm were screened, in which 5 genes have never been studied in prostate cancer research, including CPA6, KRT15, SMIM10, SPON1, and ST6GALNAC4.
Materials and Methods
Data collection
The TCGA data of prostate cancer was downloaded from UCSC Xena database (https://xenabrowser.net/datapages/), including 499 tumor samples and 52 normal samples. The gene expression levels were quantified as FPKM (Fragments Per Kilobase of transcript per Million mapped reads) for subsequent analyses.
WGCNA
The co-expression relationship of protein-coding genes was investigated by R package “WGCNA” to screen gene modules associated with prostate cancer. Gene modules most significantly associated (p < 0.05, r > 0.3) to prostate cancer were selected for subsequent analysis. R package “clusterProfiler” was used to conducted enrichment analysis of genes in each module.
Differential correlation analysis
R package “DiffCorr” was utilized to identify and visualize differential correlations. This package was based on Fisher’s z-test and details were explained in published work [15].
Statistical analysis
All data are presented as the mean ± SD (Standard Deviation). Statistical analysis was performed using R software (https://www.r-project.org/, version:4.1.1). P < 0.05 (two-tailed) was considered statistically significant: *p < 0.05, **p < 0.01, ***p < 0.001, and ****p < 0.0001.
Data availability
The datasets generated and analysed during the current study are available from the corresponding author on reasonable request.
Results
Identification of gene modules associated with prostate cancer
We first conducted WGCNA in TCGA-PRAD to screen key gene modules associated with prostate cancer. We performed weighted gene co-expression network analysis (WGCNA) using the following parameters: A soft-thresholding power (β) of 10 was selected based on scale-free topology fit (R² = 0.92) and mean connectivity preservation. This threshold optimally balances network connectivity with scale-free topology requirements. Minimum module size was set to 30 genes, Module merging threshold was 0.25 (Figure 1A). Figure 1B showed the merging of similar modules. MEplum1, MEblue, and MEmediumpurple3 gene modules (r > 0.3, p < 0.05) were selected for subsequent analysis (Figure 2A). Figure 2B displayed the correlation between module membership and gene significance.
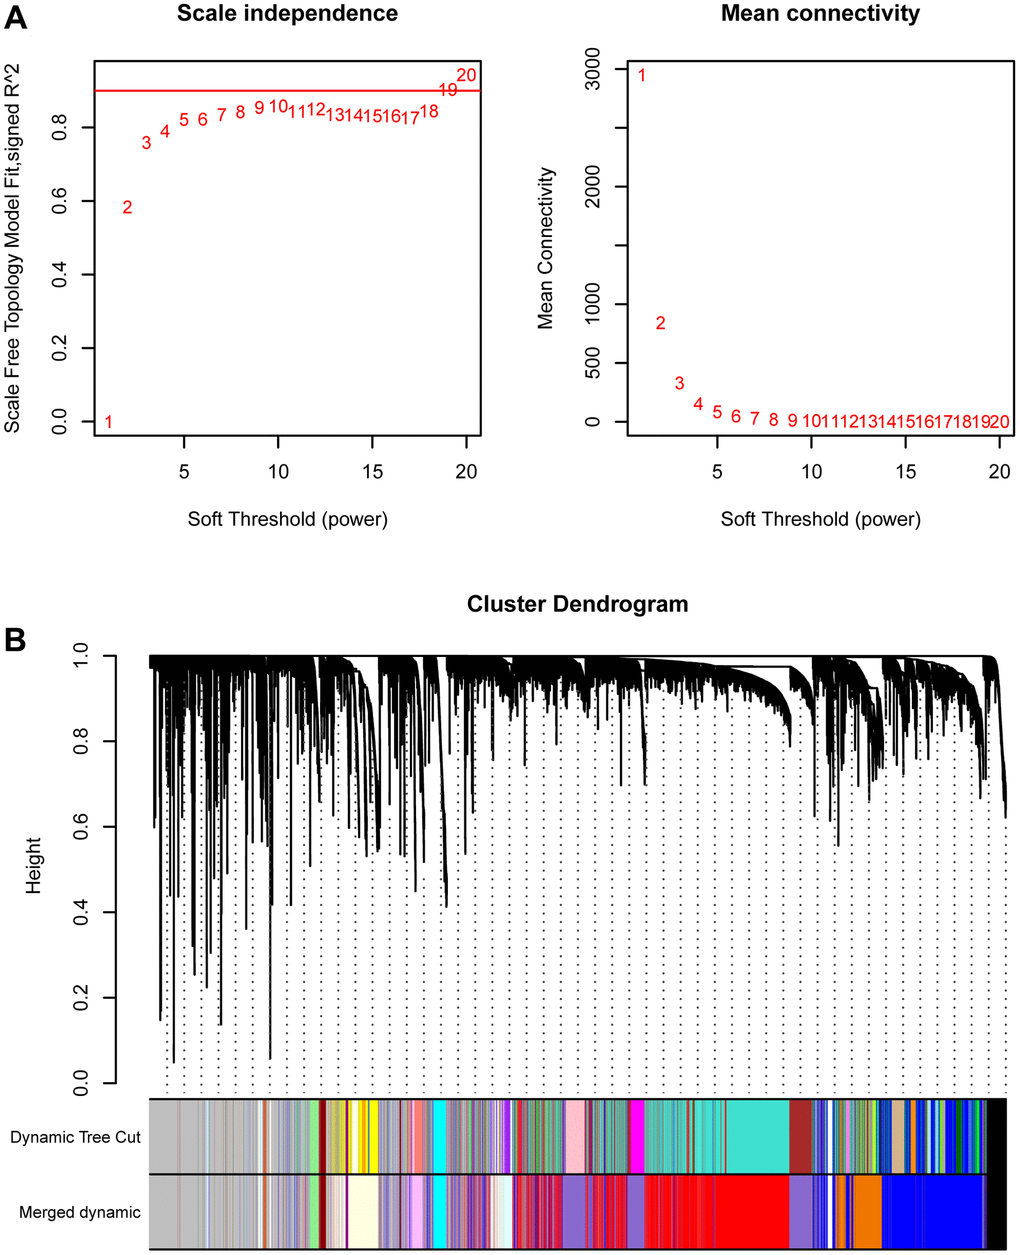
Figure 1. WGCNA. (A) The best soft threshold selection of WGCNA. (B) The combination of similar gene modules.
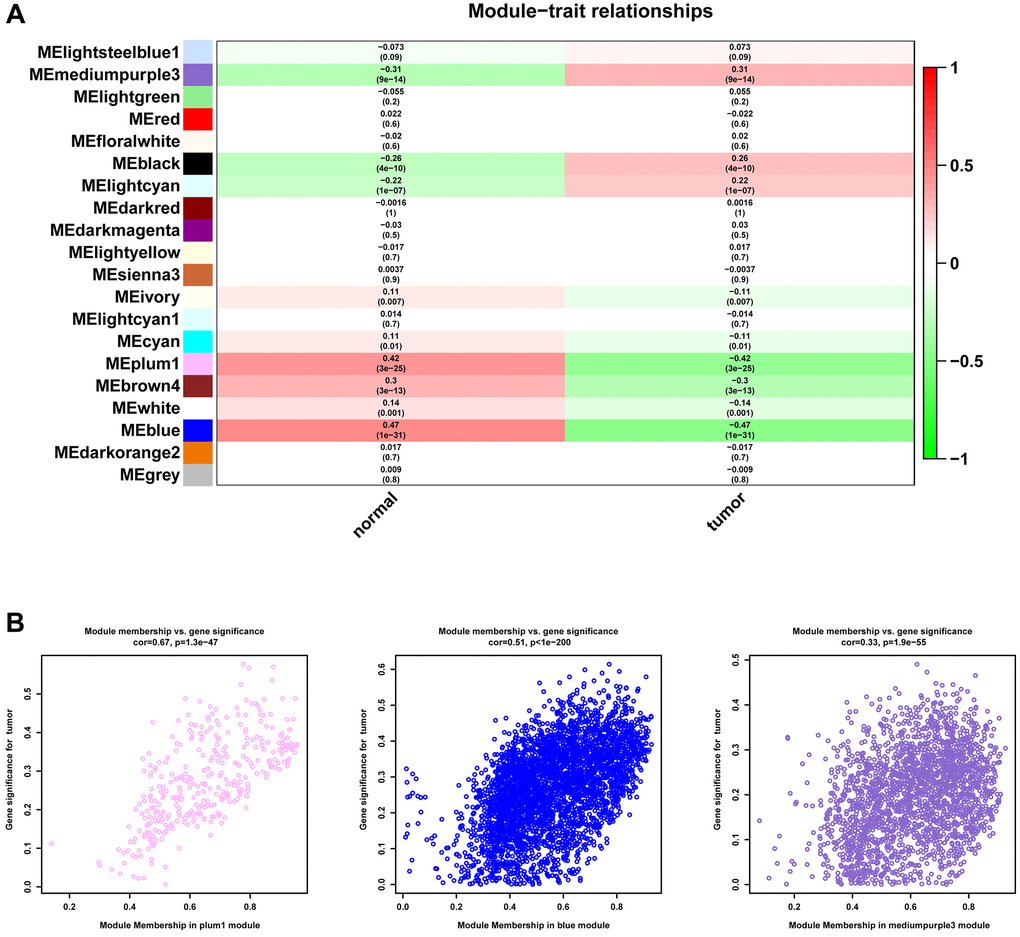
Figure 2. Identification of gene modules. (A) Heatmap of the correlation between module and the clinical features of patients in TCGA-PRAD. (B) The correlation between module membership and gene significance.
GO and KEGG analyzes were further performed to explore the function of each gene module. Results indicated that these genes in MEblue were enriched in external encapsulating structure organization and extracellular matrix organization in BP (Biological Process) terms, collagen-containing extracellular matrix and cell-cell junction in CC (Cellular Component) terms, extracellular matrix structural constituent and glycosaminoglycan binding in MF (Molecular Function) terms, and PI3K-Akt signaling pathway in KEGG terms (Figure 3A). The MEblue module’s enrichment for PI3K-Akt signaling (Figure 3A) aligns with known pathway activation in prostate cancer metastasis. Genes in MEmediumpurple3 were enriched in ribonucleoprotein complex biogenesis in BP terms, mitochondrial inner membrane in CC terms, structural constituent of ribosome in MF terms, and Pathways of neurodegeneration-multiple diseases, Chemical carcinogenesis-reactive oxygen species, and Oxidative phosphorylation in KEGG terms (Figure 3B). Genes in MEplum1 were enriched in pattern specification process in BP terms, apical part of cell in CC terms, metal ion transmembrane transporter activity in MF terms, and Gastric acid secretion, Pancreatic secretion, and Aldosterone synthesis and secretion in KEGG terms (Figure 3C).
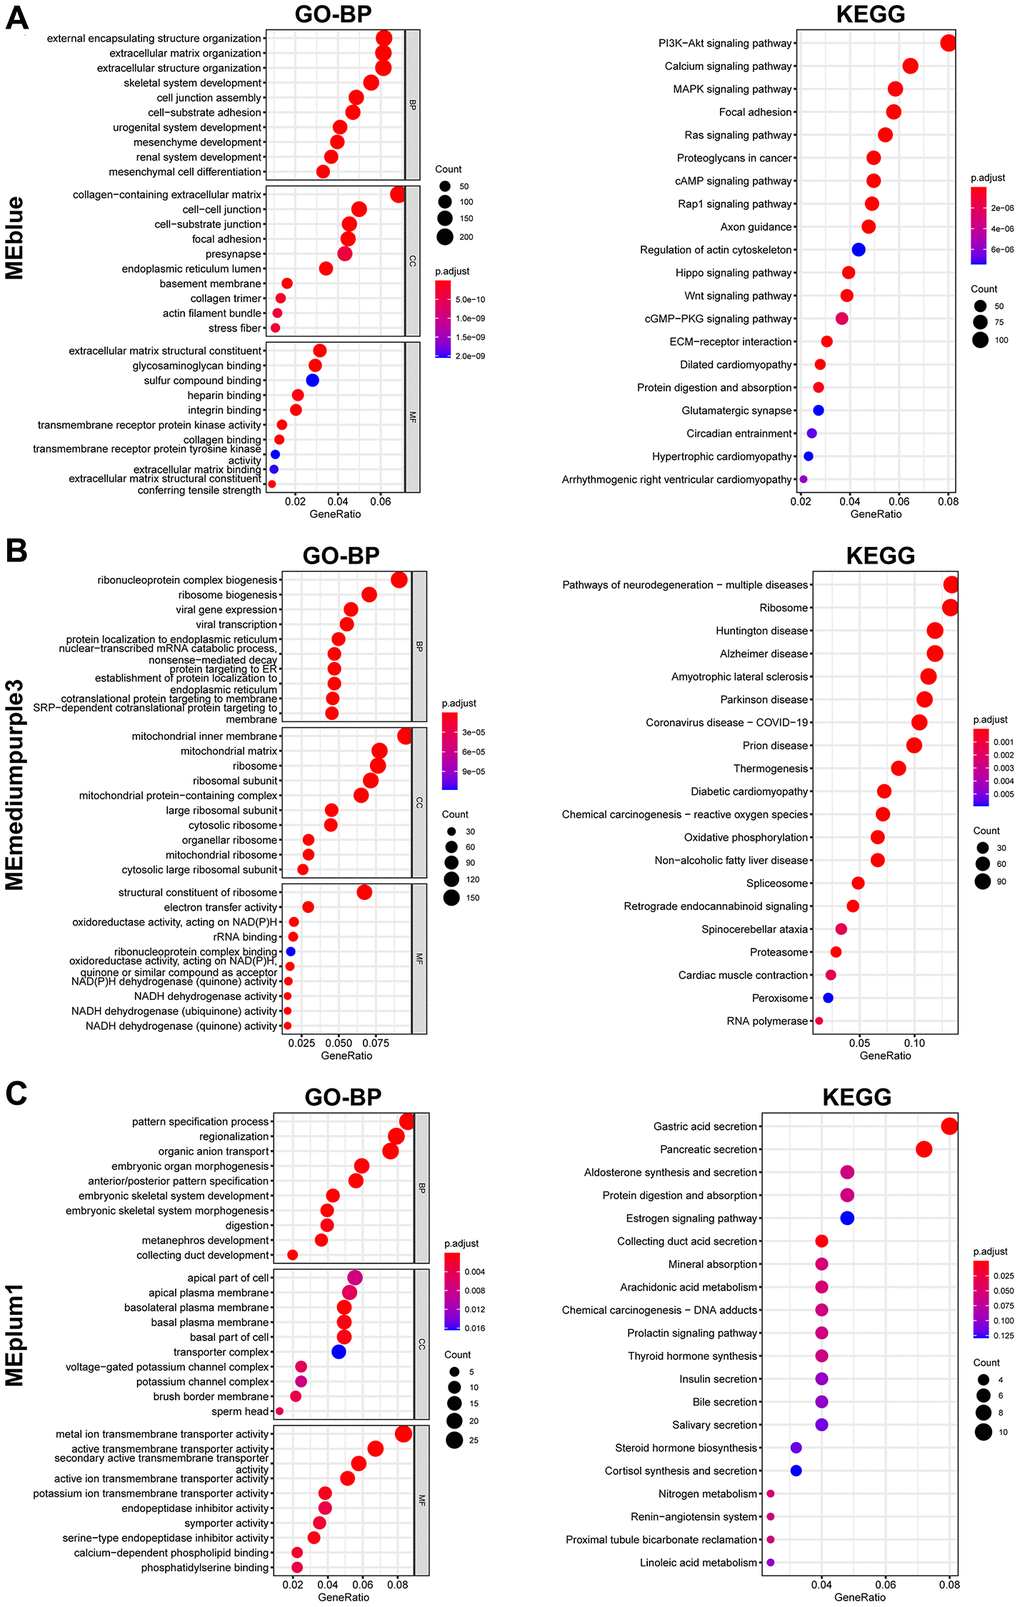
Figure 3. Enrichment analysis of genes from selected modules. (A–C) GO (Left) and KEGG (Right) enrichment analysis of genes in MEblue (A), MEmediumpurple3 (B), and MEplum1 (C).
Differential correlations identification
The genes in the MEplum1, MEblue, and MEmediumpurple3 modules were further selected to assess differential correlations via R package “DiffCorr”. Cluster.molecule algorithm was used to divide genes based on tumor and normal groups. We used the one-correlation coefficient as a distance measure (the cutoff was 0.5) according to the cutree function. Network analysis was performed using the DiffCorr package with the following key functions:
get.eigen.molecule: Computes module eigengenes (first principal components) representing each gene module’s expression pattern across samples. This dimensionality reduction approach captures >50% of variance in each module (mean = 62 ± 8%).
get.eigen.molecule.graph: Visualizes module relationships through force-directed layouts, where:
Nodes represent modules (size proportional to gene count).
Edges show significant inter-module correlations (|r| > 0.5, FDR < 0.05).
Colors indicate association strength with clinical traits.
The get.eigen.molecule and get.eigen.molecule.graph functions were used for visualization of the module network (Figure 4A–4C). The comp.2.cc.fdr function provided the resulting pair-wise differential correlations in each gene module. A total of 297 gene pairs were screened in MEblue module and 23 gene pairs were screened in MEmediumpurple3. No gene pairs were selected in MEplum1 (Supplementary Table 1).
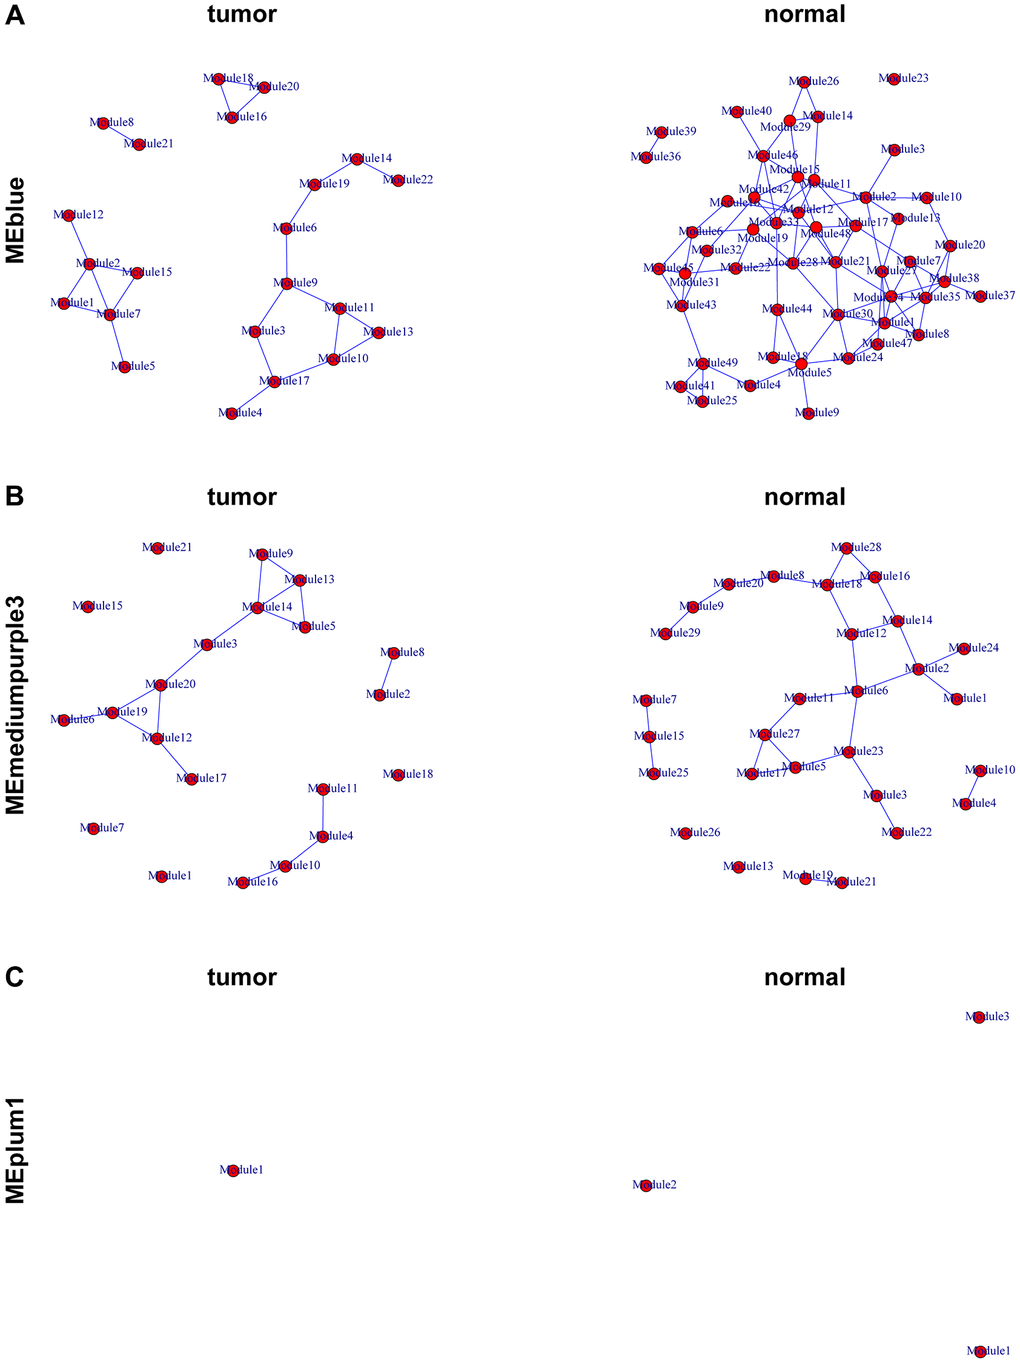
Figure 4. Representation of the module networks. Images of MEblue (A), MEmediumpurple3 (B), and MEplum1 (C) module networks from the TCGA-PRAD were shown. Each node represented one module, and each edge represented the module correlation.
In order to further narrow the gene range, we conducted differential analysis to screen genes differentially expressed between tumor and normal tissues. A total of 518 differentially expressed genes were screened (Figure 5A, 5B). Through intersection, we finally got 33 gene pairs, including 21 genes, as hub genes associated with prostate cancer (Figure 6A, 6B). For example, ALDH1A2 was positively correlated with CPA6 (r = 0.5, p < 0.0001) in tumor tissues, while in normal tissues, ALDH1A2 expression was negative (r = −0.63, p < 0.0001) correlated with CPA6 (Table 1).
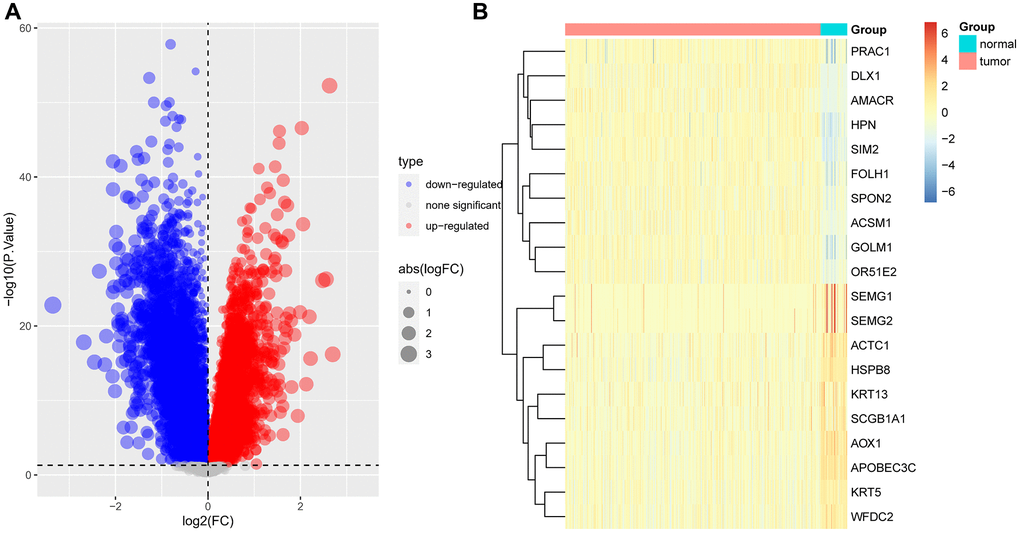
Figure 5. Difference analysis. (A) Volcano map displayed the differential expressed genes between tumor and normal tissues based on TCGA-PRAD data. (B) Heatmap displayed the expression of top 10 highly and lowly expressed genes.
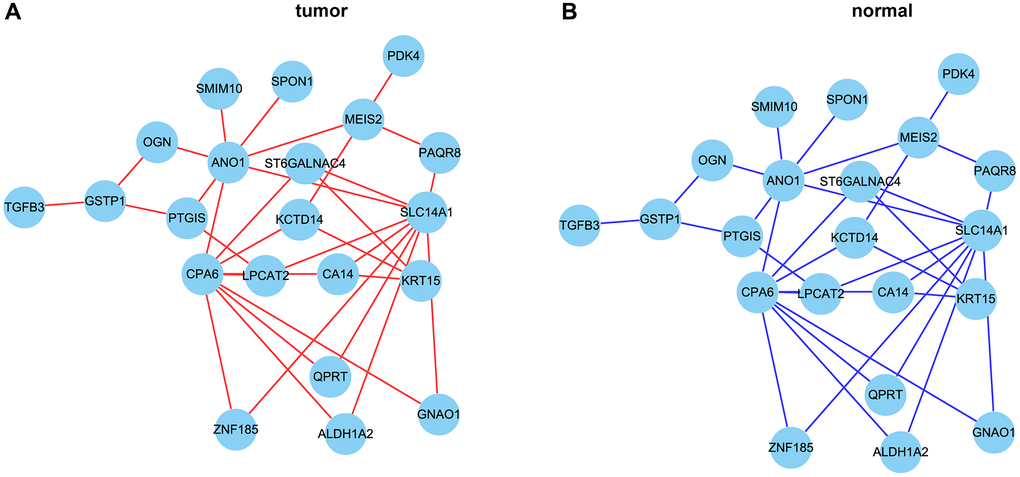
Figure 6. The correlation network of hub genes. (A, B) The correlation network of hub genes in tumor (A) and normal (B) tissues. Red lines represent positive correlation and blue lines represent negative correlation.
Table 1. The 33 gene pairs associated with prostate cancer.
| molecule.X | molecule.Y | r1 | p1 | r2 | p2 | FDR | molecule.X.type | molecule.Y.type |
| ALDH1A2 | CPA6 | 0.50560432 | 9.68E-34 | −0.625984519 | 6.95E-07 | 3.50E-12 | down-regulated | down-regulated |
| ALDH1A2 | SLC14A1 | 0.586365345 | 2.06E-47 | −0.511834677 | 0.000105168 | 3.50E-12 | down-regulated | down-regulated |
| ANO1 | CPA6 | 0.547409474 | 2.36E-40 | −0.59298223 | 3.62E-06 | 3.50E-12 | down-regulated | down-regulated |
| ANO1 | MEIS2 | 0.746567384 | 5.28E-90 | −0.525289722 | 6.38E-05 | 3.50E-12 | down-regulated | down-regulated |
| ANO1 | OGN | 0.625530891 | 1.52E-55 | −0.575241071 | 8.17E-06 | 3.50E-12 | down-regulated | down-regulated |
| ANO1 | PTGIS | 0.660572094 | 7.20E-64 | −0.561343956 | 1.50E-05 | 3.50E-12 | down-regulated | down-regulated |
| ANO1 | SLC14A1 | 0.606544668 | 1.84E-51 | −0.59223007 | 3.75E-06 | 3.50E-12 | down-regulated | down-regulated |
| ANO1 | SMIM10 | 0.652452715 | 7.67E-62 | −0.501931563 | 0.000149985 | 3.50E-12 | down-regulated | down-regulated |
| ANO1 | SPON1 | 0.683074099 | 7.81E-70 | −0.530235037 | 5.28E-05 | 3.50E-12 | down-regulated | down-regulated |
| CA14 | CPA6 | 0.531974994 | 8.36E-38 | −0.595818979 | 3.16E-06 | 3.50E-12 | down-regulated | down-regulated |
| CA14 | KRT15 | 0.53691886 | 1.32E-38 | −0.598971236 | 2.72E-06 | 3.50E-12 | down-regulated | down-regulated |
| CA14 | SLC14A1 | 0.559469551 | 1.93E-42 | −0.569626734 | 1.05E-05 | 3.50E-12 | down-regulated | down-regulated |
| CPA6 | GNAO1 | 0.529049644 | 2.46E-37 | −0.657029628 | 1.22E-07 | 3.50E-12 | down-regulated | down-regulated |
| CPA6 | KCTD14 | 0.541932195 | 1.96E-39 | −0.604657398 | 2.06E-06 | 3.50E-12 | down-regulated | down-regulated |
| CPA6 | LPCAT2 | 0.563398826 | 3.88E-43 | −0.585255042 | 5.19E-06 | 3.50E-12 | down-regulated | down-regulated |
| CPA6 | QPRT | 0.558227102 | 3.20E-42 | −0.594808843 | 3.32E-06 | 3.50E-12 | down-regulated | down-regulated |
| CPA6 | ST6GALNAC4 | 0.588413349 | 8.23E-48 | −0.563392132 | 1.37E-05 | 3.50E-12 | down-regulated | down-regulated |
| CPA6 | ZNF185 | 0.620624099 | 1.84E-54 | −0.559644258 | 1.61E-05 | 3.50E-12 | down-regulated | down-regulated |
| GNAO1 | SLC14A1 | 0.590343745 | 3.45E-48 | −0.592675755 | 3.67E-06 | 3.50E-12 | down-regulated | down-regulated |
| GSTP1 | OGN | 0.557692221 | 3.98E-42 | −0.521134666 | 7.46E-05 | 1.12E-11 | down-regulated | down-regulated |
| GSTP1 | PTGIS | 0.560032479 | 1.54E-42 | −0.533082911 | 4.73E-05 | 3.50E-12 | down-regulated | down-regulated |
| GSTP1 | TGFB3 | 0.501432929 | 3.95E-33 | −0.521626064 | 7.32E-05 | 2.54E-10 | down-regulated | down-regulated |
| KCTD14 | KRT15 | 0.587082984 | 1.49E-47 | −0.586132826 | 4.98E-06 | 3.50E-12 | down-regulated | down-regulated |
| KCTD14 | MEIS2 | 0.61606687 | 1.79E-53 | −0.538377546 | 3.84E-05 | 3.50E-12 | down-regulated | down-regulated |
| KRT15 | ST6GALNAC4 | 0.536590151 | 1.49E-38 | −0.622358865 | 8.40E-07 | 3.50E-12 | down-regulated | down-regulated |
| LPCAT2 | PTGIS | 0.523149309 | 2.10E-36 | −0.514038498 | 9.70E-05 | 1.12E-10 | down-regulated | down-regulated |
| LPCAT2 | SLC14A1 | 0.602645344 | 1.17E-50 | −0.577844265 | 7.27E-06 | 3.50E-12 | down-regulated | down-regulated |
| MEIS2 | PAQR8 | 0.647753747 | 1.07E-60 | −0.526524919 | 6.09E-05 | 3.50E-12 | down-regulated | down-regulated |
| MEIS2 | PDK4 | 0.506870988 | 6.29E-34 | −0.517765939 | 8.46E-05 | 2.20E-10 | down-regulated | down-regulated |
| PAQR8 | SLC14A1 | 0.548209239 | 1.73E-40 | −0.62366366 | 7.85E-07 | 3.50E-12 | down-regulated | down-regulated |
| QPRT | SLC14A1 | 0.58784082 | 1.06E-47 | −0.536428175 | 4.15E-05 | 3.50E-12 | down-regulated | down-regulated |
| SLC14A1 | ST6GALNAC4 | 0.564645996 | 2.32E-43 | −0.584672632 | 5.33E-06 | 3.50E-12 | down-regulated | down-regulated |
| SLC14A1 | ZNF185 | 0.669184505 | 4.33E-66 | −0.575177683 | 8.19E-06 | 3.50E-12 | down-regulated | down-regulated |
Comprehensive analysis of hub genes in prostate cancer
We next conducted comprehensive analysis of hub genes in prostate cancer. Figure 7A displayed the differential expression of these genes. Results indicated that all these genes were down-regulated in tumor tissues. The prognostic value of hub genes in prostate cancer was analyzed (Figure 7B). For example, patients with high expression of ZNF185 have better DFI (Disease Free Interval) and PFS (Progression Free Survival) in prostate cancer.
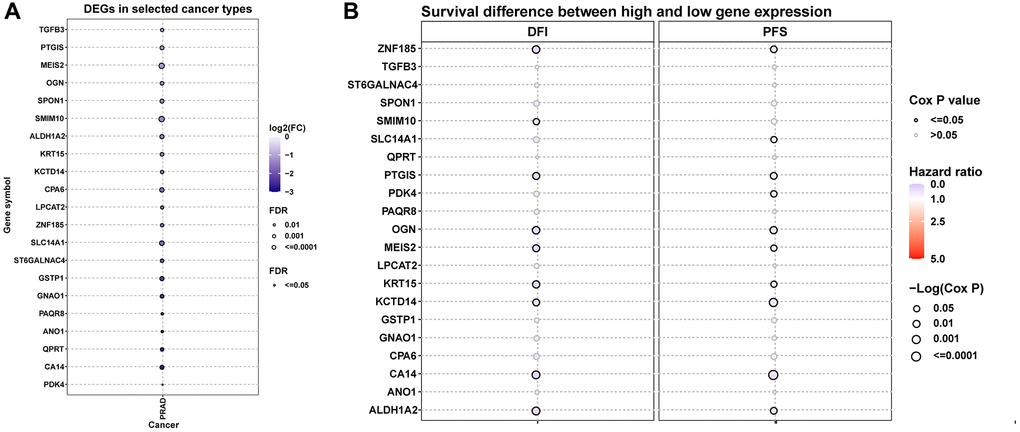
Figure 7. Differential expression and prognostic value of hub genes. (A) The differential expression of hub genes in TCGA-PRAD. (B) The prognostic value of hub genes in TCGA-PRAD, including DFI and PFS.
We further explored the CNV, mutation, and methylation level of hub genes in prostate cancer. All these genes have relatively lower mutation frequency in prostate cancer (Supplementary Figure 1A, 1B). CPA6 has highest amplification frequency (Figure 8A). The relationship between CNV and mRNA expression indicated that ZNF15, SMIM10, ALDH1A2, and MEIS2 expression were positively correlated with their CNV level (Figure 8B). Figure 8C, 8D provided the profile of homozygous and heterozygous CNV of hub genes in prostate cancer. The results of methylation analysis indicated that the methylation level of these genes were generally up-regulated in tumor prostate tissues compared to normal tissues (Figure 9A). For example, the methylation level of CPA6 was higher in tumor tissues. In addition, methylation level of CPA6 was negatively linked to its mRNA expression (Figure 9B).
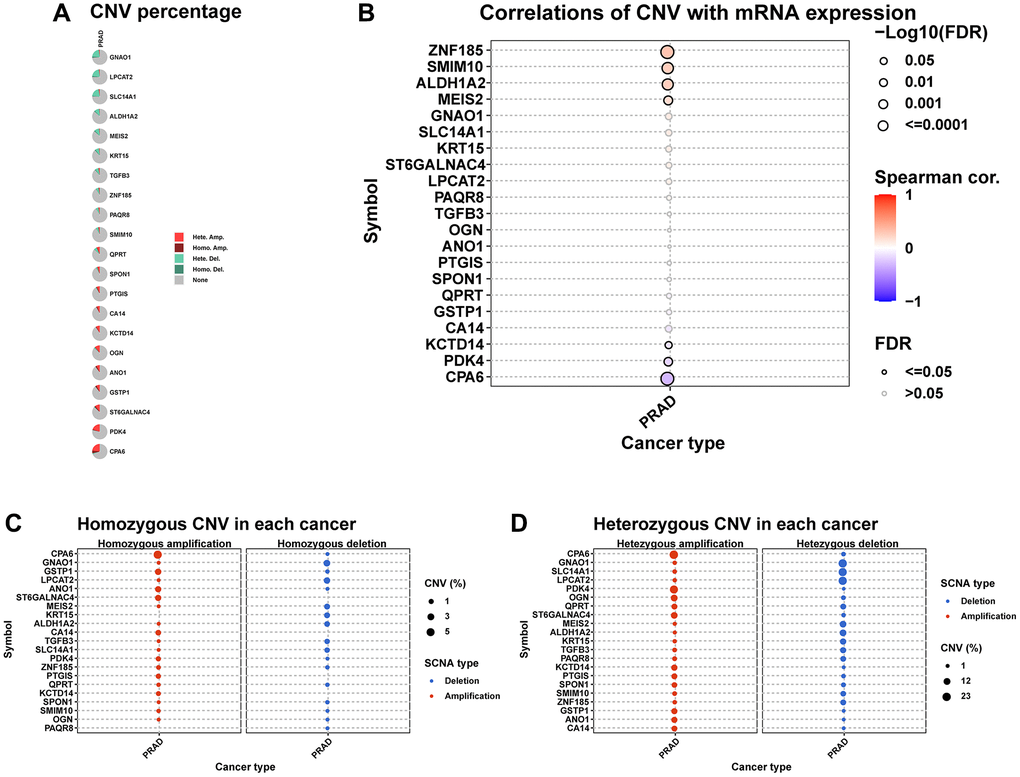
Figure 8. The CNV of hub genes. (A) Pie plot summarizes the CNV of hub genes in TCGA-PRAD. (B) The correlation between CNV and mRNA expression of hub genes in TCGA-PRAD. (C) Figure provides the profile of homozygous CNV of hub genes in TCGA-PRAD. (D) Figure provides the profile of heterozygous CNV of imputed genes in TCGA-PRAD.
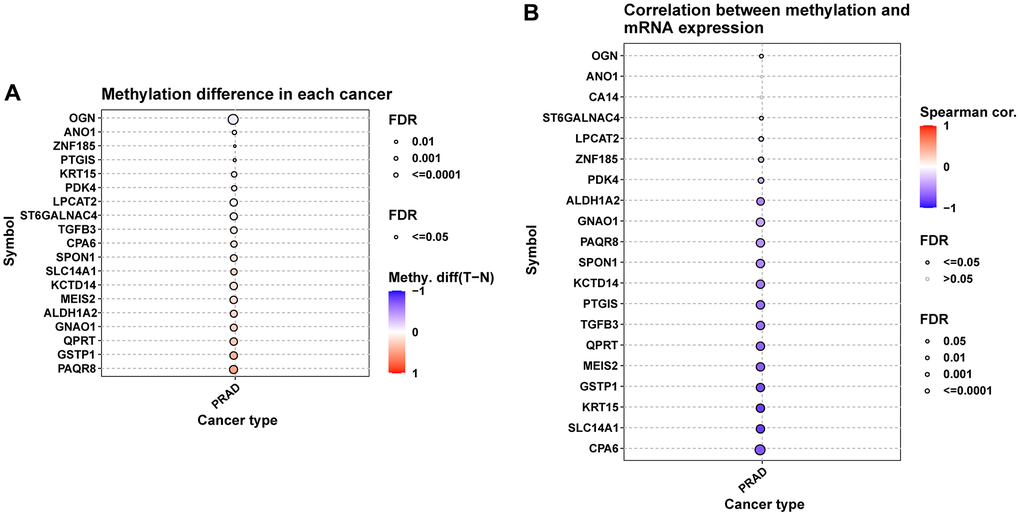
Figure 9. Methylation analysis of hub genes. (A) Figure summarizes the methylation difference between tumor and normal samples of hub genes in TCGA-PRAD. (B) Figure summarizes the correlation of methylation level with their mRNA expression TCGA-PRAD.
Immune infiltration analysis
Since immune cells in the tumor microenvironment are important factors affecting the prognosis of tumor patients, we analyzed the correlation between 21 hub genes and immune cell infiltration (Figure 10). Results suggested that these genes were positively associated with most immune cells, such as CD4 T cells, NK cells, NKT cells, and Th2 cells. These results provided evidence that high expression of these genes predicted better prognosis of prostate cancer patients.
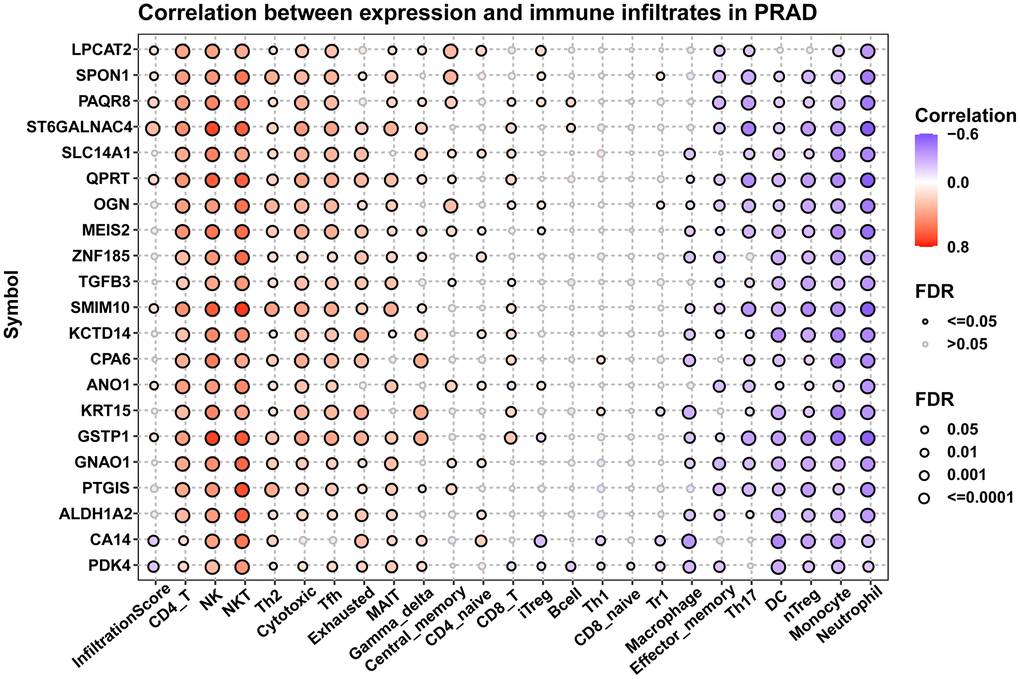
Figure 10. Immune infiltration analysis. Figure displayed the correlation of hub genes with infiltration levels of indicated immune cells.
Drug resistance analysis
We also explored the influence of these genes on resistance of anti-tumor drugs. Figure summarizes the correlation between gene expression and the sensitivity of GDSC drugs using GSCA database. Figure 11A–11B respectively summarized the correlation of gene expression with the sensitivity of GDSC and CTRP drugs. For example, patients with high expression of ZNF185 were resistant to AR-42 (a HDAC inhibitor) treatment, while sensitive to 17-AAG (a HSP90 inhibitor) treatment based on GDSC data.
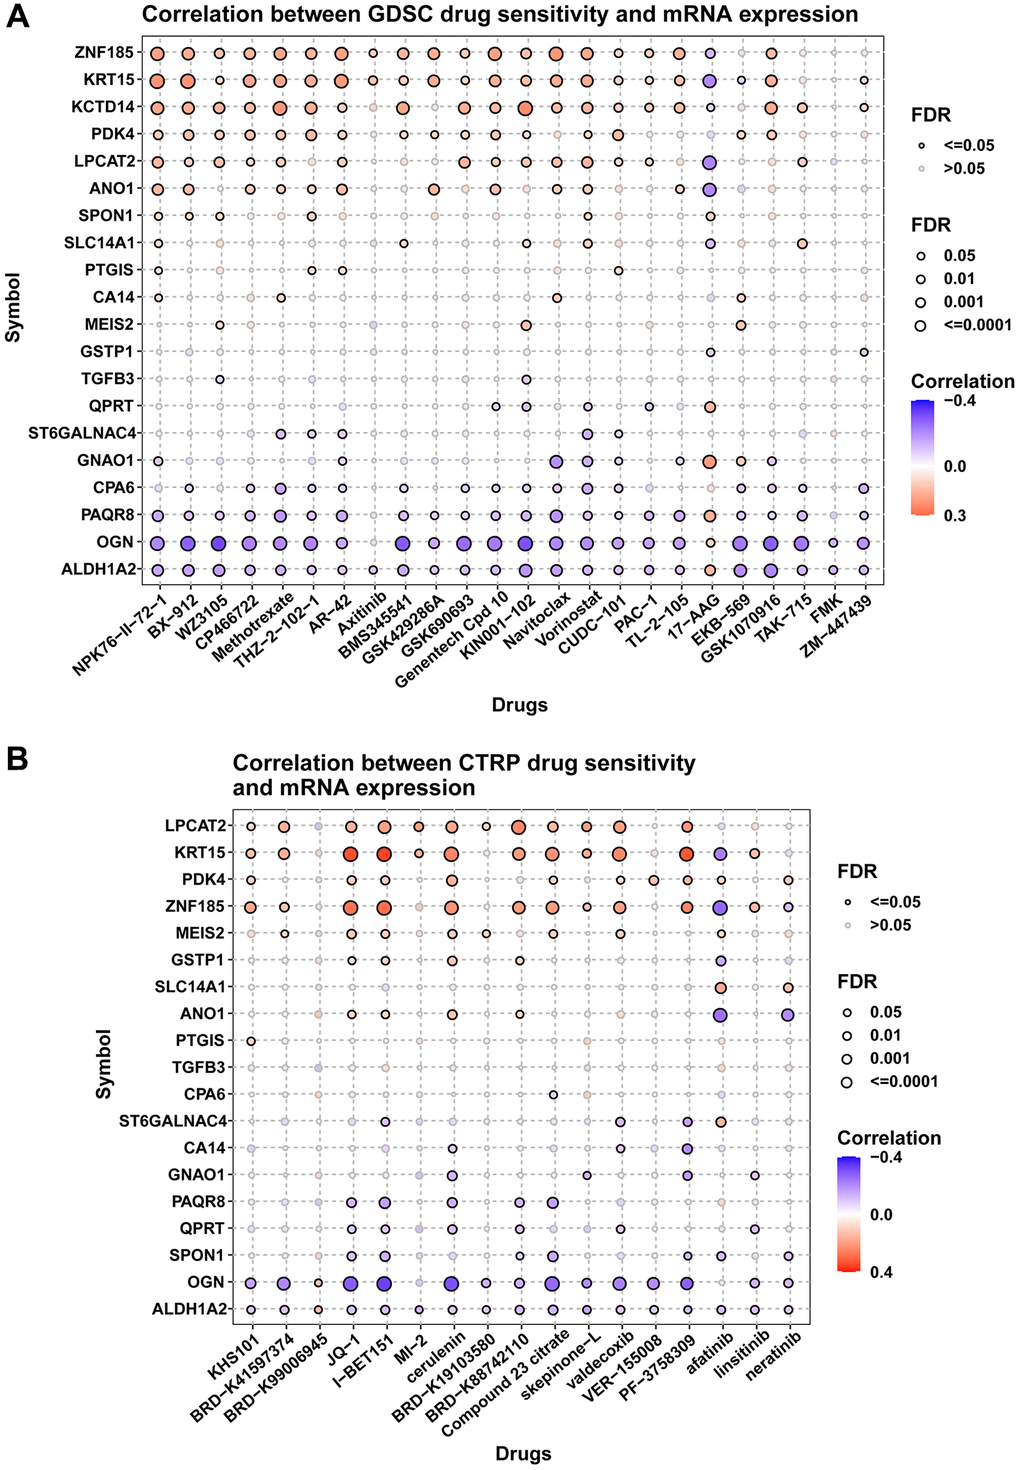
Figure 11. Drug resistance analysis. (A) Figure summarizes the correlation between gene expression and the sensitivity of GDSC drugs. (B) Figure summarizes the correlation between gene expression and the sensitivity of CTRP drugs. Pearson correlation analysis was performed to get the correlation between gene mRNA expression and drug IC50. P-value was adjusted by FDR.
ALDH1A2-Drug resistance correlation
The ALDH1A2-CPA6 pair showed the most significant correlation reversal (tumor: r = +0.51 vs. normal: r = −0.63, FDR = 3.5 × 10−¹²). Functional analysis revealed:
Strong association with docetaxel resistance (r = 0.43, p = 0.002) in TCGA cohort
Enrichment in oxidative stress response pathways (GO:0006979, FDR = 1.2 × 10⁻⁸)
Co-expression with ABC transporters (ABCB1 r = 0.38, p = 0.007).
Discussion
In recent years, new therapies as well as the application of next-generation sequencing to prostate cancer have changed the landscape of prostate cancer treatment [16–18]. Prostate cancer is one of the most common cancers in men, and although most patients do not have a long disease course and pose less threat to death, many still develop into intermediate-or high-risk locally advanced or metastatic cancer [19–21]. At present, the pathogenesis of prostate cancer remains unclear, and better tumor markers are lacking. Therefore, we urgently need to explore new pathogenesis as well as prognostic markers for prostate cancer.
With the development of bioinformatics, multiple methods were used to identify tumor biomarkers [22, 23]. Previous works have focused on exploring gene interaction networks constructed from a series of genes with related. Investigators always tend to ignore the impact of different states on the correlation and the reasons behind it, such as contrasting the differences in gene correlations in normal and tumor tissues. This study focuses on comparing the differential gene correlations between tumor and normal tissues in prostate cancer, and constructs a gene correlation network. The candidate genes and their target genes in the gene correlation network can be further used for the experimental study of biological functions, thereby guiding the diagnosis, treatment, and predicting prognosis of patients.
In our study, we first conducted WGCNA in TCGA-PRAD to screen key gene modules associated with prostate cancer. MEplum1, MEblue, and MEmediumpurple3 gene modules (p < 0.05, r > 0.3) were selected for subsequent analysis. GO and KEGG analyzes were further performed to explore the function of each gene module. Results indicated that these genes in MEblue were enriched in external encapsulating structure organization and extracellular matrix organization in BP terms. Functional enrichment analysis revealed that MEblue module genes were significantly associated with: External encapsulating structure organization (GO:0045229, FDR = 3.2 × 10⁻⁶): Refers to the assembly of basement membrane components (laminins, collagens IV) surrounding prostate glands, a process disrupted during tumor invasion [24]. Extracellular matrix (ECM) reorganization (GO:0030198, FDR = 1.8 × 10⁻⁸): Involves MMP-mediated ECM remodeling characteristics of metastatic progression [25]. Collagen-containing extracellular matrix and cell-cell junction in CC terms, extracellular matrix structural constituent and glycosaminoglycan binding in MF terms, and PI3K-Akt signaling pathway in KEGG terms. These results indicated that these genes were closely associated various malignant pathways. The genes in the MEplum1, MEblue, and MEmediumpurple3 modules were further selected to assess differential correlations via R package “DiffCorr”. A total of 313 gene pairs of gene were screened. Through intersecting with DEGs, we finally got 33 gene pairs, including 21 genes, as hub genes associated with prostate cancer. For example, ALDH1A2 was positively correlated with CPA6 (r = 0.5, p < 0.0001) in tumor tissues, while in normal tissues, ALDH1A2 expression was negative (r = −0.63, p < 0.0001) correlated with CPA6. We also conducted comprehensive analysis of hub genes in prostate cancer, such as CNV, mutation, and methylation.
Since immune cells in the tumor microenvironment are important factors affecting the prognosis of tumor patients [26], we analyzed the correlation between 21 hub genes and immune cell infiltration. Results suggested that these genes were positively associated with most immune cells, such as CD4 T cells, NK cells, NKT cells, and Th2 cells. These results provided evidence that high expression of these genes predicted better prognosis of prostate cancer patients.
We also explored the influence of these genes on resistance of anti-tumor drugs. For example, patients with high expression of ZNF185 were resistant to AR-42 (a HDAC inhibitor) treatment, while sensitive to 17-AAG (a HSP90 inhibitor) treatment based on GDSC data. These results may provide a reference for patients to choose medication. Three key limitations warrant consideration: (1) TCGA’s ethnic homogeneity may limit generalizability, (2) bulk sequencing could mask cell-type specific interactions, and (3) functional validation is needed for the 5 novel biomarkers (e.g., SMIM10). Priority next steps include single-cell validation of the ALDH1A2-CPA6 axis and testing these biomarkers in liquid biopsy cohorts.
Conclusions
In conclusion, our study identified 21 hub genes and their potential function involved in prostate cancer. Our work provides a new direction for future research to investigate the underlying mechanism of prostate cancer.
Author Contributions
ZC and YZ carried out experiments, data analysis and drafted the manuscript; QX, WL and YZ participated in study design, XH, TY and YH participated in sample and data collection; All authors read and approved the final manuscript.
Acknowledgments
We acknowledge our use of R software. The results are in part based upon data derived from TCGA databases. We appreciate the platforms and the authors who uploaded their data.
Conflicts of Interest
The authors declare no conflicts of interest related to this study.
Funding
This work was supported by the Guangdong Province Science and Technology Special Fund Project (Grant No. 210713116901740).
This study was supported by the Public Welfare Project Fund for the High-quality Development of Scientific Research in Public Hospital, China Health Promotion Foundation (Grant No. GL-A003), and Guangdong Province Science and Technology Special Fund Project (Grant No. STKJ2021064, No. STKJ202209068).
References
- 1. Gamallat Y, Bakker A, Khosh Kish E, Choudhry M, Walker S, Aldakheel S, Seyedi S, Huang KC, Ghosh S, Gotto G, Bismar TA. The Association between Cyclin Dependent Kinase 2 Associated Protein 1 (CDK2AP1) and Molecular Subtypes of Lethal Prostate Cancer. Int J Mol Sci. 2022; 23:13326. https://doi.org/10.3390/ijms232113326 [PubMed]
- 2. Fenton JJ, Weyrich MS, Durbin S, Liu Y, Bang H, Melnikow J. Prostate-Specific Antigen-Based Screening for Prostate Cancer: Evidence Report and Systematic Review for the US Preventive Services Task Force. JAMA. 2018; 319:1914–31. https://doi.org/10.1001/jama.2018.3712 [PubMed]
- 3. Nuhn P, De Bono JS, Fizazi K, Freedland SJ, Grilli M, Kantoff PW, Sonpavde G, Sternberg CN, Yegnasubramanian S, Antonarakis ES. Update on Systemic Prostate Cancer Therapies: Management of Metastatic Castration-resistant Prostate Cancer in the Era of Precision Oncology. Eur Urol. 2019; 75:88–99. https://doi.org/10.1016/j.eururo.2018.03.028 [PubMed]
- 4. de Wit R, de Bono J, Sternberg CN, Fizazi K, Tombal B, Wülfing C, Kramer G, Eymard JC, Bamias A, Carles J, Iacovelli R, Melichar B, Sverrisdóttir Á, et al, and CARD Investigators. Cabazitaxel versus Abiraterone or Enzalutamide in Metastatic Prostate Cancer. N Engl J Med. 2019; 381:2506–18. https://doi.org/10.1056/NEJMoa1911206 [PubMed]
- 5. Subudhi SK, Vence L, Zhao H, Blando J, Yadav SS, Xiong Q, Reuben A, Aparicio A, Corn PG, Chapin BF, Pisters LL, Troncoso P, Tidwell RS, et al. Neoantigen responses, immune correlates, and favorable outcomes after ipilimumab treatment of patients with prostate cancer. Sci Transl Med. 2020; 12:eaaz3577. https://doi.org/10.1126/scitranslmed.aaz3577 [PubMed]
- 6. Kantoff PW, Higano CS, Shore ND, Berger ER, Small EJ, Penson DF, Redfern CH, Ferrari AC, Dreicer R, Sims RB, Xu Y, Frohlich MW, Schellhammer PF, and IMPACT Study Investigators. Sipuleucel-T immunotherapy for castration-resistant prostate cancer. N Engl J Med. 2010; 363:411–22. https://doi.org/10.1056/NEJMoa1001294 [PubMed]
- 7. Zhang Y, Li X, Zhou D, Zhi H, Wang P, Gao Y, Guo M, Yue M, Wang Y, Shen W, Ning S, Li Y, Li X. Inferences of individual drug responses across diverse cancer types using a novel competing endogenous RNA network. Mol Oncol. 2018; 12:1429–46. https://doi.org/10.1002/1878-0261.12181 [PubMed]
- 8. Fang Y, Yang Y, Zhang X, Li N, Yuan B, Jin L, Bao S, Li M, Zhao D, Li L, Zeng Z, Huang H. A Co-Expression Network Reveals the Potential Regulatory Mechanism of lncRNAs in Relapsed Hepatocellular Carcinoma. Front Oncol. 2021; 11:745166. https://doi.org/10.3389/fonc.2021.745166 [PubMed]
- 9. Yang L, Li X, Luo Y, Yang T, Wang H, Shi L, Feng M, Xie W. Weighted gene co-expression network analysis of the association between upregulated AMD1, EN1 and VGLL1 and the progression and poor prognosis of breast cancer. Exp Ther Med. 2021; 22:1030. https://doi.org/10.3892/etm.2021.10462 [PubMed]
- 10. Chen B, Xie X, Lan F, Liu W. Identification of prognostic markers by weighted gene co-expression network analysis in non-small cell lung cancer. Bioengineered. 2021; 12:4924–35. https://doi.org/10.1080/21655979.2021.1960764 [PubMed]
- 11. Liao Y, Zou X, Wang K, Wang Y, Wang M, Guo T, Zhong B, Jiang N. Comprehensive analysis of Transcription Factors identified novel prognostic biomarker in human bladder cancer. J Cancer. 2021; 12:5605–21. https://doi.org/10.7150/jca.58484 [PubMed]
- 12. Eisen MB, Spellman PT, Brown PO, Botstein D. Cluster analysis and display of genome-wide expression patterns. Proc Natl Acad Sci U S A. 1998; 95:14863–8. https://doi.org/10.1073/pnas.95.25.14863 [PubMed]
- 13. de la Fuente A. From 'differential expression' to 'differential networking' - identification of dysfunctional regulatory networks in diseases. Trends Genet. 2010; 26:326–33. https://doi.org/10.1016/j.tig.2010.05.001 [PubMed]
- 14. Mohammad T, Singh P, Jairajpuri DS, Al-Keridis LA, Alshammari N, Adnan M, Dohare R, Hassan MI. Differential Gene Expression and Weighted Correlation Network Dynamics in High-Throughput Datasets of Prostate Cancer. Front Oncol. 2022; 12:881246. https://doi.org/10.3389/fonc.2022.881246 [PubMed]
- 15. Fukushima A. DiffCorr: an R package to analyze and visualize differential correlations in biological networks. Gene. 2013; 518:209–14. https://doi.org/10.1016/j.gene.2012.11.028 [PubMed]
- 16. Achard V, Putora PM, Omlin A, Zilli T, Fischer S. Metastatic Prostate Cancer: Treatment Options. Oncology. 2022; 100:48–59. https://doi.org/10.1159/000519861 [PubMed]
- 17. Teo MY, Rathkopf DE, Kantoff P. Treatment of Advanced Prostate Cancer. Annu Rev Med. 2019; 70:479–99. https://doi.org/10.1146/annurev-med-051517-011947 [PubMed]
- 18. Evans AJ. Treatment effects in prostate cancer. Mod Pathol. 2018; 31:S110–21. https://doi.org/10.1038/modpathol.2017.158 [PubMed]
- 19. Gourdin T. Recent progress in treating advanced prostate cancer. Curr Opin Oncol. 2020; 32:210–5. https://doi.org/10.1097/CCO.0000000000000624 [PubMed]
- 20. Ahdoot M, Lebastchi AH, Turkbey B, Wood B, Pinto PA. Contemporary treatments in prostate cancer focal therapy. Curr Opin Oncol. 2019; 31:200–6. https://doi.org/10.1097/CCO.0000000000000515 [PubMed]
- 21. Haberkorn U, Eder M, Kopka K, Babich JW, Eisenhut M. New Strategies in Prostate Cancer: Prostate-Specific Membrane Antigen (PSMA) Ligands for Diagnosis and Therapy. Clin Cancer Res. 2016; 22:9–15. https://doi.org/10.1158/1078-0432.CCR-15-0820 [PubMed]
- 22. Lu F, Wu J, Zou H, Yang X, Wu Y, Xu J. The Oncogenic and Immunological Roles of Apoptosis Antagonistic Transcription Factors in Human Tumors: A Pan-Cancer Analysis. Oxid Med Cell Longev. 2022; 2022:3355365. https://doi.org/10.1155/2022/3355365 [PubMed]
- 23. Quan Y, Zhang X, Wang M, Ping H. Histone lysine methylation patterns in prostate cancer microenvironment infiltration: Integrated bioinformatic analysis and histological validation. Front Oncol. 2022; 12:981226. https://doi.org/10.3389/fonc.2022.981226 [PubMed]
- 24. Humphrey PA. Prostate Pathology. Philadelphia: Elsevier. 2018.
- 25. Lu P, Weaver VM, Werb Z. The extracellular matrix: a dynamic niche in cancer progression. J Cell Biol. 2012; 196:395–406. https://doi.org/10.1083/jcb.201102147 [PubMed]
- 26. Zhong W, Shen Z, Wu Y, Mao X, Kong J, Wu W. Knowledge mapping and current trends of immunotherapy for prostate cancer: A bibliometric study. Front Immunol. 2022; 13:1014981. https://doi.org/10.3389/fimmu.2022.1014981 [PubMed]