Submit an Article
Navigate
Home
Editorial Board
Editorial Policies
Current Volume
Archive
Scientific Integrity
Publication Ethics Statements
Interviews with Outstanding Authors
Newsroom
Sponsored Conferences
Podcast
Contact
Special Collections
Submit an Article
Online ISSN: 1945-4589
Research Paper
|
Volume 17, Issue 10
|
pp. 2582–2597
Identification of key genes with differential correlations in prostate cancer
Back to article
Figure 4
(4 of 11)
−
100%
+
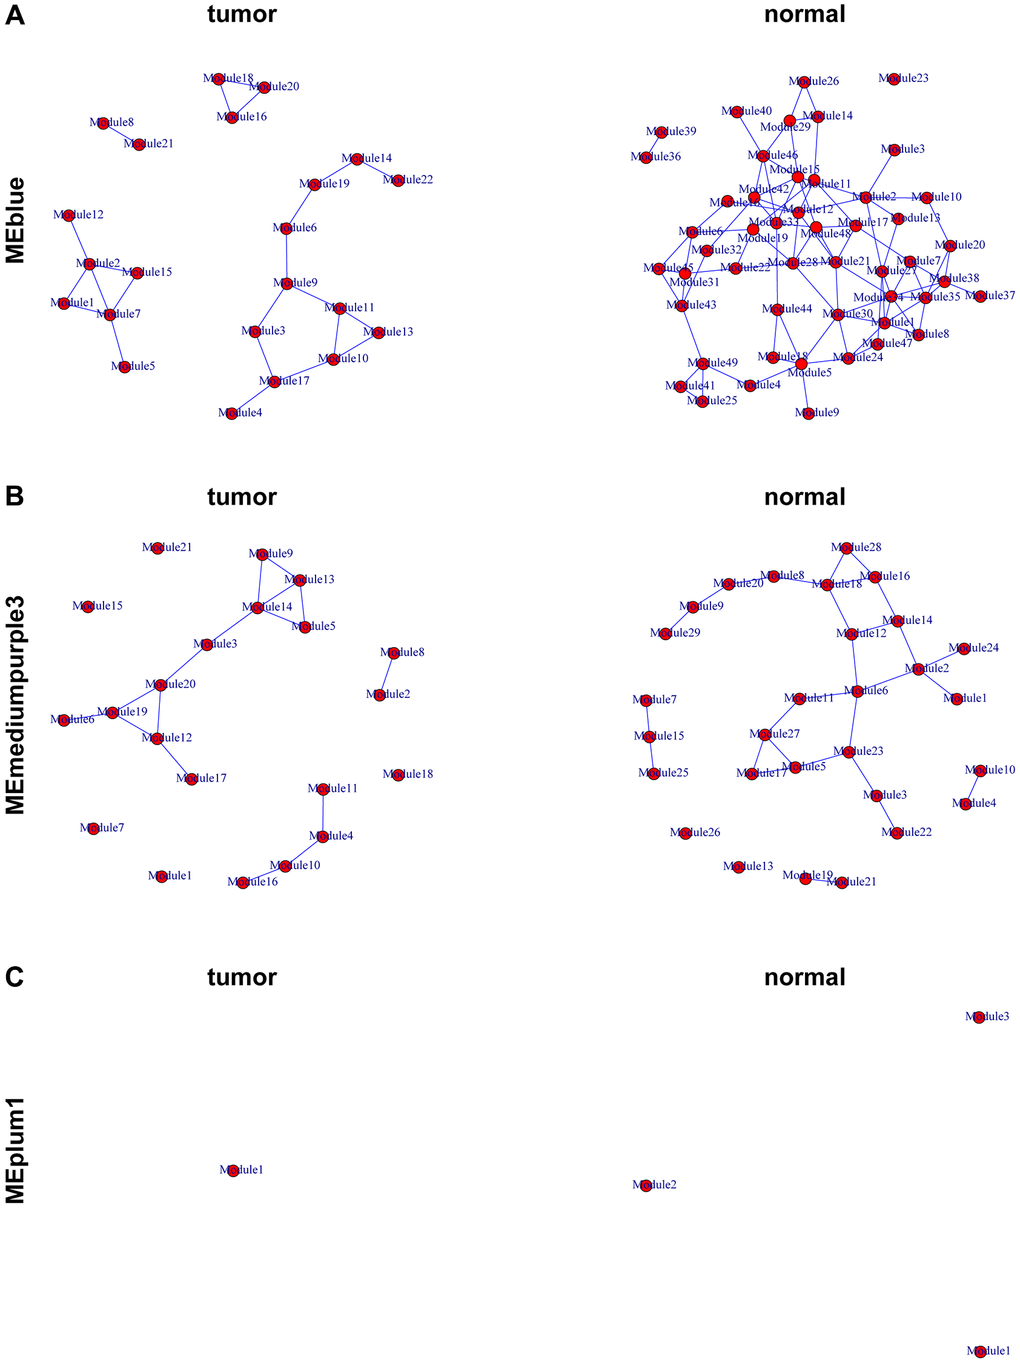
Figure 4.
Representation of the module networks.
Images of MEblue (
A
), MEmediumpurple3 (
B
), and MEplum1 (
C
) module networks from the TCGA-PRAD were shown. Each node represented one module, and each edge represented the module correlation.