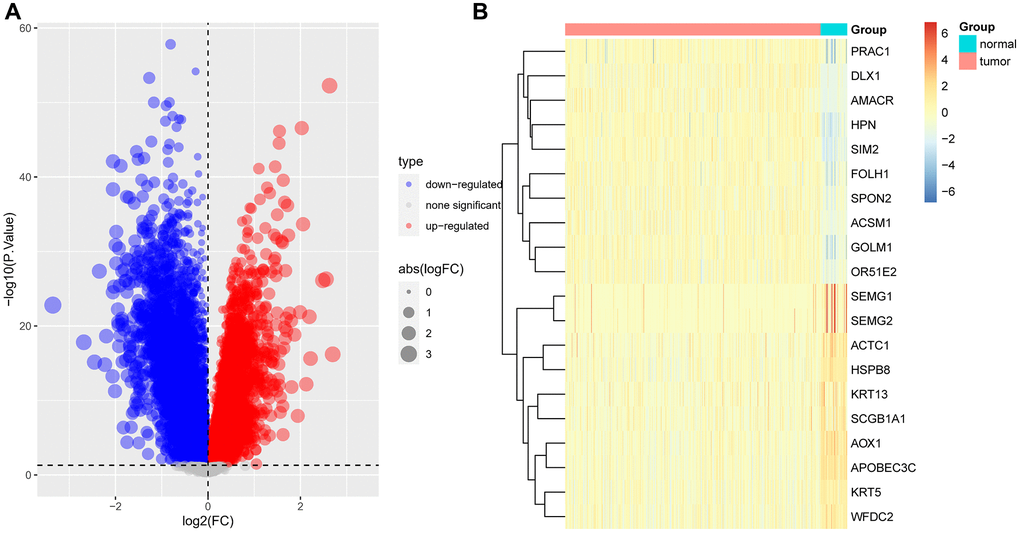
Figure 5.Difference analysis. (A) Volcano map displayed the differential expressed genes between tumor and normal tissues based on TCGA-PRAD data. (B) Heatmap displayed the expression of top 10 highly and lowly expressed genes.
Figure 5 — Identification of key genes with differential correlations in prostate cancer | Aging