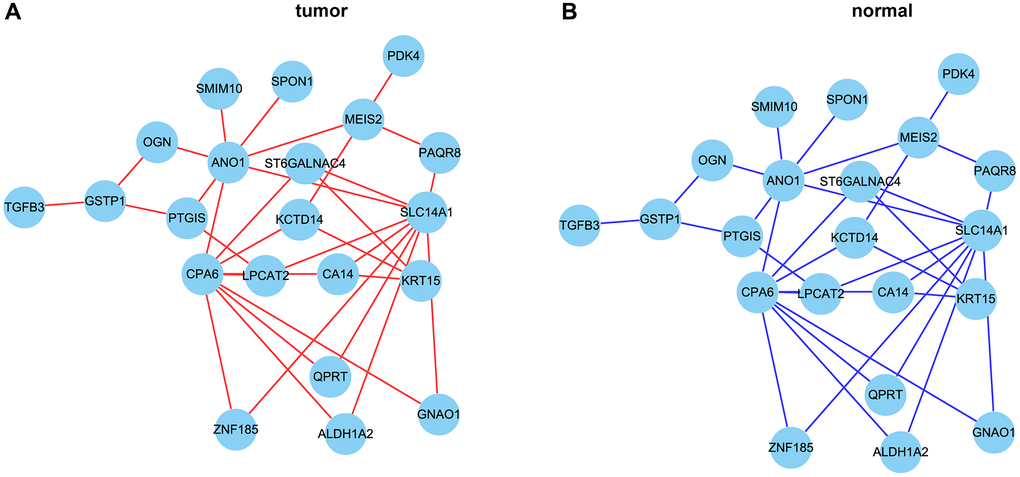
Figure 6.The correlation network of hub genes. (A, B) The correlation network of hub genes in tumor (A) and normal (B) tissues. Red lines represent positive correlation and blue lines represent negative correlation.
Figure 6 — Identification of key genes with differential correlations in prostate cancer | Aging