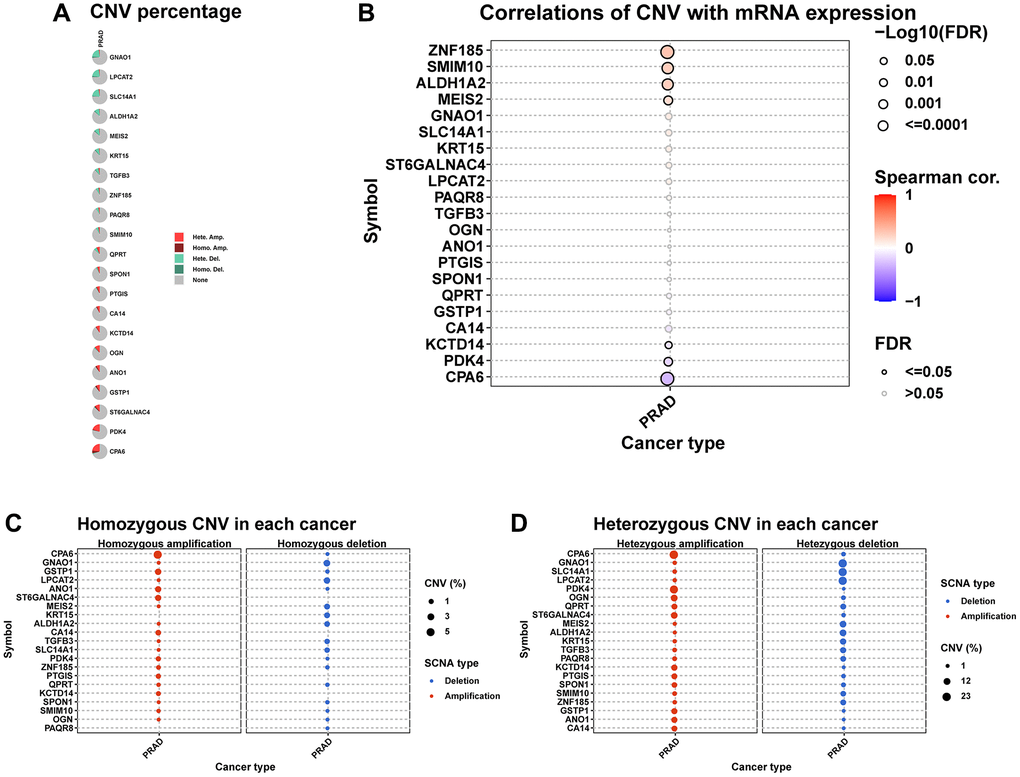
Figure 8.The CNV of hub genes. (A) Pie plot summarizes the CNV of hub genes in TCGA-PRAD. (B) The correlation between CNV and mRNA expression of hub genes in TCGA-PRAD. (C) Figure provides the profile of homozygous CNV of hub genes in TCGA-PRAD. (D) Figure provides the profile of heterozygous CNV of imputed genes in TCGA-PRAD.