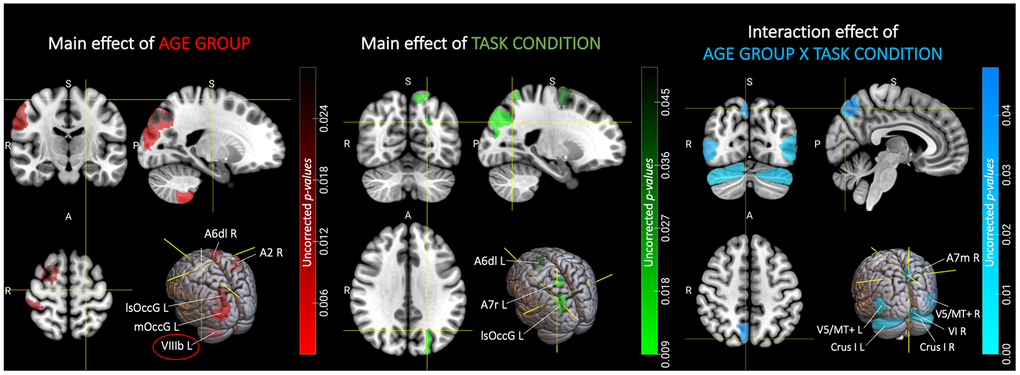
Figure 4.Regions showing significant effects of age group, task condition and their interaction on BOLD variability prior to FDR correction. The figure shows, separately for the main effects of AGE GROUP and TASK CONDITION, as well as their interaction effect, the location of the brain regions that yield a significant result prior to FDR correction. Only the effect of AGE GROUP in the left cerebellar lobule VIIIb (circled region) remained significant after correction for multiple comparisons (with q < 0.05). Color gradients indicate uncorrected p-values for the corresponding effect (red for main effect of AGE GROUP, green for main effect of TASK CONDITION and blue for their interaction) in a given region. Brain slices and volumes depicted in this figure were created with MRIcroGL (Version 1.2.20220720b; https://www.nitrc.org/projects/mricrogl) [37]. Abbreviations: A2 = primary somatosensory cortex; A6dl = dorsolateral premotor cortex; A7m = precuneus; A7r = superior parietal lobe; Crus I = cerebellar lobule Crus I; FDR = False Discovery Rate; L = left; lsOccG = lateral superior occipital gyrus; mOccG = middle occipital gyrus; R = right; V5/MT+ = motion area V5/MT+; VI = cerebellar lobule VI; VIIIb = cerebellar lobule VIIIb.
Figure 4 — Age-specific relationship between the modulation of brain dynamics in response to task demands and bimanual performance | Aging