


Introduction
Preserving the ability to coordinate both hands efficiently in space and time is crucial for executing a vast repertoire of daily activities (e.g., getting dressed, driving a car, and eating with a fork and knife) that are essential for maintaining autonomy and functional independence [1, 2]. However, increasing age is characterized by impaired bimanual coordination manifested by increased task variability [3] and reduced capacity to inhibit between-hand interference, particularly during complex bimanual movements with asymmetric hand-timing demands which require greater executive control [4, 5]. These deficits have been linked to alterations in white matter integrity [3] and diminished differentiation of functional systems [6]. Nonetheless, older adults seem to retain their capacity to modulate brain activity according to task complexity by recruiting additional higher-order cortical areas relative to younger adults to support bimanual performance [6–8]. This suggests that age-related differences in bimanual motor control likely reflect a complex interplay between neural decline and compensatory adaptation that existing cognitive aging theories such as the Dedifferentiation Theory [9], the Scaffolding Theory of Aging and Cognition (STAC) [10] or the Compensation-Related Utilization of Neural Circuits Hypothesis (CRUNCH) [11] account for to varying degrees.
While functional magnetic resonance imaging (fMRI) has been extensively used to address age-related brain activity differences underlying bimanual performance, conventional analyses focus on blood-oxygen-level-dependent (BOLD) signal activation, neglecting the unique, informative potential of BOLD signal variability. Unlike static, mean-based measures, BOLD variability metrics such as BOLD SD (i.e., the standard deviation of the BOLD time series across voxels) capture the moment-to-moment fluctuations in BOLD signal intensity, providing a more comprehensive picture of the dynamic adaptability of neural systems [12]. This emerging fMRI metric was found to be an age-sensitive source of information orthogonal to mean BOLD and is considered to reflect neural efficiency and adaptability to the ever-changing internal and external demands [13–18]. Even though the exact physiology behind BOLD variability remains unclear, it likely reflects a combination of synaptic excitatory-inhibitory balance [19, 20] and interactions between vascular and neuronal factors [21, 22].
In past studies, BOLD variability has been described to change across the lifespan in an inverted U-shape pattern peaking around young adulthood [14, 15], with greater variability generally associated with better cognitive performance [14, 15, 23, 24] as corroborated by recent work from Steinberg and King [25]. By compiling evidence on BOLD variability across a wide variety of cognitive functions, Steinberg and King [25] concluded that, in general, greater BOLD variability benefits task performance, resulting in improved accuracy and lower reaction times. These results are congruent with the Stochastic Resonance Theory, which postulates that neural noise can facilitate processing efficiency by increasing the sensitivity of neural systems to incoming information [26].
Contrasting the findings from Garrett et al. [14, 15], Boylan et al. [27] indicate that the relationship between BOLD variability and age is region-dependent, with older adults typically displaying reduced BOLD variability in cortical regions, relative to younger adults, but increased in subcortical regions. These alterations seen subcortically are potentially driven by reduced dopaminergic neuromodulation [28, 29] or age-related disruptions in structural integrity [30]. Notably, other studies have linked higher BOLD variability in older adults to white matter hyperintensities (WMH), poorer cognition, and reduced dopamine D1 receptor binding [28, 31, 32], suggesting a potential detrimental role of higher BOLD variability in old adulthood.
Research on age-related differences in the modulation of BOLD variability - that is, how BOLD variability changes in response to varying task complexity -, is equally dissonant. Even though higher intra-individual variability across different experimental conditions was generally reported in younger adults relative to older adults [25, 33, 34] the direction of the regulation (i.e., up or down) varied according to the study in question. For instance, whereas results from Boylan et al. [27] pointed out a negative relationship between BOLD variability and task difficulty in younger adults but a positive association in older adults, Rieck et al. [34] reported downregulation across the lifespan. Other studies found instead a consistent up-modulation in both younger and older adults [25, 27, 35, 36]. These discrepancies in findings may stem from differences in the brain regions analyzed, the specific tasks or task conditions used, or even in the experimental design and the BOLD variability metric computed (see [18] for a discussion on the impact of these factors). Therefore, it remains uncertain which direction of modulation (i.e., up- or downregulation) with task demands is detrimental or beneficial in aging. Nonetheless, altered modulation patterns in older adults (relative to younger adults) have frequently been associated with slower, less accurate and less stable behavioral performances in- and out-of-scanner [27, 33, 34, 36].
Despite the growing number of studies investigating BOLD variability in the context of healthy aging, up-to-now, the focus still lies on cognitive functions. To our knowledge, no study has yet investigated how age-related changes in BOLD variability – and in its modulation with task difficulty - affect complex motor functions such as bimanual coordination, despite its immensurable potential. Given that BOLD variability is considered to carry meaningful information beyond mean signal and has been shown to predict age with greater accuracy than traditional activation measures [14], it may serve as a sensitive marker for detecting subtle neural changes that underlie age-related motor impairments, and inform about novel interventions for preserving motor abilities across the lifespan. Moreover, considering the cognitive demands and executive control requirements of complex bimanual tasks [4], it is likely that BOLD variability also modulates motor performance, similarly to how it does in cognitive domains. Hence, examining BOLD variability and its task-dependent modulation during sensorimotor tasks could not only extend our understanding of the neural mechanisms of aging but also provide empirical evidence supporting or contesting current theoretical models of cognitive aging.
To address this gap, the present study examined BOLD variability in younger and older adults during a bimanual coordination task. Specifically, we sought to: 1) examine age-related differences in BOLD variability and its modulation across distinct task demands, and 2) explore how these age differences in the neural dynamics relate to bimanual performance. By doing so, this work sought to elucidate how intrinsic fluctuations in brain activity contribute to motor adaptability and bimanual coordination in aging, potentially offering new insights into mechanisms of functional decline and compensation.
In line with the Stochastic Resonance Theory [26] and recent findings from the review by Steinberg and King [25] suggesting that higher signal variability reflects greater neural flexibility to switch between brain states efficiently [16], we hypothesized that older adults would exhibit less overall BOLD variability during the task and reduced upregulation in response to increasing task difficulty relative to younger adults. Furthermore, we predicted that these differences in brain activity would be associated with relatively poorer bimanual performance in the older group, reflecting diminished dynamic adaptability in sensorimotor control systems.
Results
Behavioral data
Effect of age group and task condition on BTT performance
A 2 x 3 Mixed Model ANOVA was performed to evaluate the effects of AGE GROUP and TASK CONDITION on BTT SCORE. The means and standard deviations for BTT SCORE are presented in Table 1 and can be visualized in Figure 1.
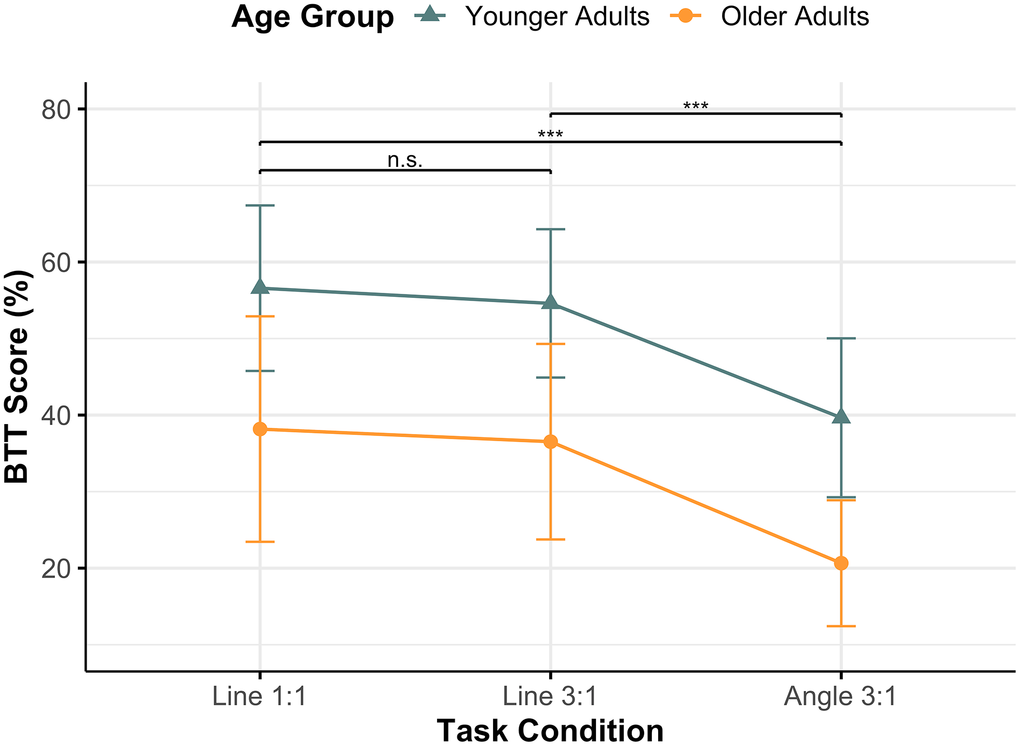
Figure 1. Mean BTT scores across task conditions per age group. The figure shows mean BTT scores (%) for each task condition (Line 1:1, Line 3:1, and Angle 3:1) in Younger Adults (teal, triangle) and Older Adults (orange, circle). Whiskers indicate standard deviation. Both groups achieved their highest scores in Line 1:1 and their lowest in Angle 3:1. Following a significant main effect of TASK CONDITION, post hoc Tukey Honestly Significant Difference tests revealed that Angle 3:1 differed significantly from both Line 1:1 and Line 3:1 (*** p < 0.001), while the two “Line” conditions did not differ (n.s.). Abbreviations: BTT = Bimanual Tracking Task; n.s. = non-significant.
Table 1. Descriptive statistics for BTT score.
| Task condition | Younger adults | Older adults | Overall | ||||||||||||||||||||||||||||||||||||||||||||||||||||||||||||||||||||||||||||||||||||||||||||||||
| Mean | SD | Mean | SD | Mean | SD | ||||||||||||||||||||||||||||||||||||||||||||||||||||||||||||||||||||||||||||||||||||||||||||||
| Line 1:1 | 56.58 | 10.81 | 38.17 | 14.73 | 47.17 | 15.84 | |||||||||||||||||||||||||||||||||||||||||||||||||||||||||||||||||||||||||||||||||||||||||||||
| Line 3:1 | 54.60 | 9.69 | 36.53 | 12.77 | 46.20 | 14.91 | |||||||||||||||||||||||||||||||||||||||||||||||||||||||||||||||||||||||||||||||||||||||||||||
| Angle 3:1 | 39.65 | 10.38 | 20.65 | 8.23 | 29.94 | 13.32 | |||||||||||||||||||||||||||||||||||||||||||||||||||||||||||||||||||||||||||||||||||||||||||||
| Overall | 50.27 | 12.69 | 31.78 | 14.43 | 40.82 | 16.43 | |||||||||||||||||||||||||||||||||||||||||||||||||||||||||||||||||||||||||||||||||||||||||||||
| Mean and standard deviation (SD) values for BTT score across different age groups (Younger Adults and Older Adults) and task conditions (Line 1:1, Line 3:1 and Angle 3:1). | |||||||||||||||||||||||||||||||||||||||||||||||||||||||||||||||||||||||||||||||||||||||||||||||||||
The two-way ANOVA revealed significant main effects of AGE GROUP (F[1,129] = 29.71, p < 0.001) and TASK CONDITION (F[2,129] = 16.80, p < 0.001), indicating that BTT performance differed between younger and older adults and varied across task conditions. As expected, younger adults (mean ± SD = 50.27 ± 12.69) performed on average better than older adults (mean ± SD = 31.78 ± 14.43). Moreover, participants overall performed worse on the Angle 3:1 (mean ± SD = 29.94 ± 13.32) comparatively to Line 3:1 (mean ± SD = 46.20 ± 14.91) and Line 1:1 (mean ± SD = 47.17 ± 15.84). Post-hoc Tukey HSD comparisons confirmed that Angle 3:1 differed from “Line” conditions (q < 0.001), whereas Line 1:1 and Line 3:1 did not differ from one another (q = 0.826). Lastly, the AGE GROUP × TASK CONDITION interaction was not significant (F[2,129] = 0.019, p = 0.981), suggesting that the effect of task condition on BTT performance did not differ between age groups.
Neuroimaging data
Effect of age group and task condition on framewise displacement
We examined differences in framewise displacement (FD) across age groups and task conditions using an Aligned Rank Transform (ART) factorial ANOVA to assess the potential confounding effect of head motion on BOLD SD estimates.
A significant main effect of AGE GROUP was found (F[1,129] = 42.89, p < 0.001), indicating that older adults (mean ± SD = 0.34 ± 0.12) exhibited greater FD during BTT performance compared to younger adults (mean ± SD = 0.23 ± 0.07). However, there was no significant main effect of TASK CONDITION (F[2,129] = 0.39, p = 0.675), suggesting that movement-related artifacts did not systematically differ across task conditions. Additionally, the AGE GROUP × TASK CONDITION interaction was not significant (F[2,129] = 0.17, p = 0.843), indicating that the relationship between BTT conditions and FD did not differ across age groups. These results are depicted in Figure 2.
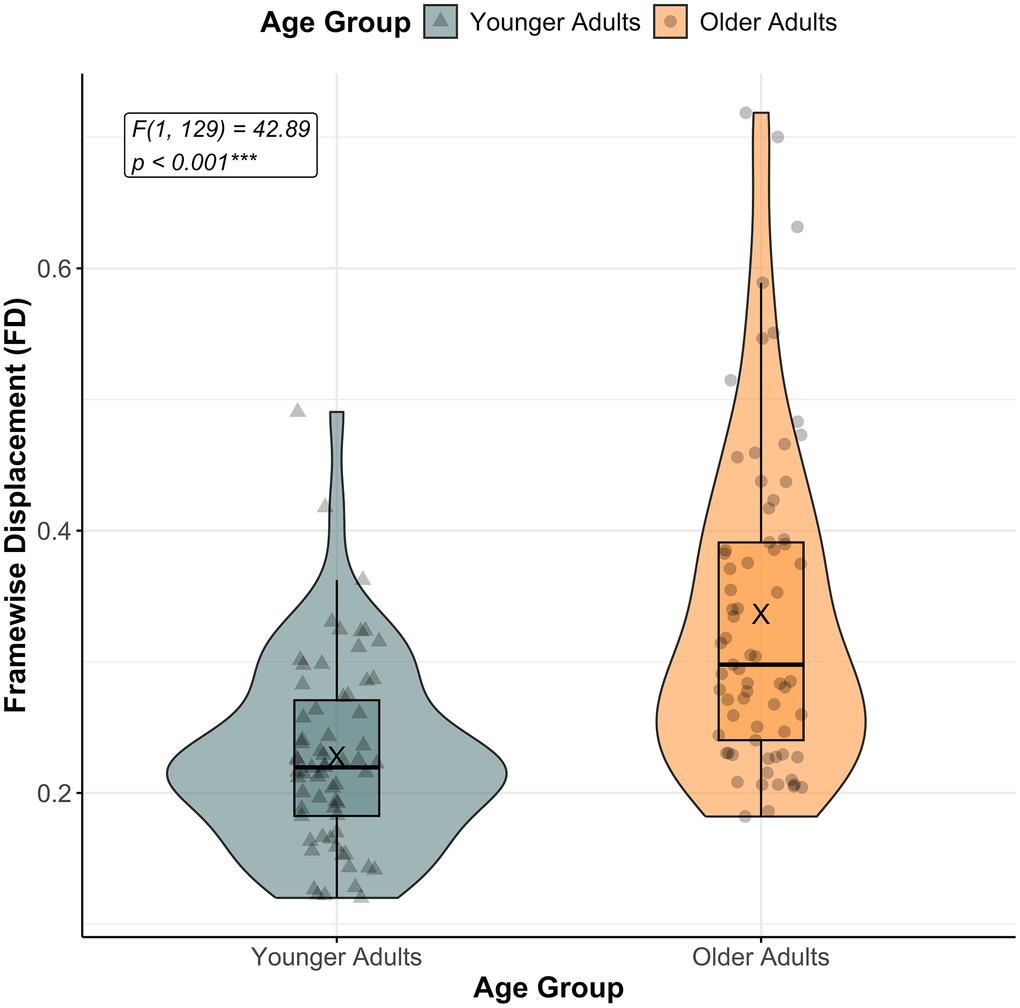
Figure 2. Framewise displacement (FD) across age groups. The figure shows framewise displacement (FD) across age groups (Younger Adults in teal, and Older Adults in orange) while performing the Bimanual Tracking Task (BTT). The “X” indicates mean FD for each age group. A significant main effect of AGE GROUP was observed (the corresponding F-value and p-value are reported), with older adults presenting overall more framewise displacement compared to younger adults. Individual data points reflect mean FD per subject, pooled across task conditions. Significance level: *** p < 0.001.
These findings indicated a potential bias in BOLD SD estimation in older adults compared to younger due to more head motion, reinforcing the importance of controlling for FD in subsequent analyses.
Age-group differences in BOLD variability and BOLD variability modulation during BTT performance
Effect of age group and task condition on BOLD variability
To investigate whether BOLD variability differed across age groups and task conditions in the selected brain regions, a LMM was conducted per ROI, controlling for FD. Subject ID was included as a random intercept to account for within-subject variance. Box-Cox transformations were applied in 21 ROIs to meet model assumptions (see Table 2 for the λ values used in the transformation). On average, two data points of BOLD SD were removed per ROI (i.e., 1.5 % of the total data points; the range of data points excluded was from zero to four), as they were more than three standard deviations of the ROI’s overall mean BOLD SD.
Table 2. Summary of age group, task condition and interaction effects on BOLD variability across ROIs.
| ROIs | λ | Age group | Task condition | Age group x task condition | |||||||||||||||||||||||||||||||||||||||||||||||||||||||||||||||||||||||||||||||||||||||||||||||
| F | q | F | q | F | q | ||||||||||||||||||||||||||||||||||||||||||||||||||||||||||||||||||||||||||||||||||||||||||||||
| RH | A2 | 0.125 | 6.27 | 0.129 | - | - | - | - | |||||||||||||||||||||||||||||||||||||||||||||||||||||||||||||||||||||||||||||||||||||||||||
| LH | A37vl | -0.625 | - | - | - | - | - | - | |||||||||||||||||||||||||||||||||||||||||||||||||||||||||||||||||||||||||||||||||||||||||||
| RH | A39c | - | - | - | - | - | - | - | |||||||||||||||||||||||||||||||||||||||||||||||||||||||||||||||||||||||||||||||||||||||||||
| LH | A40rd | -0.654 | - | - | - | - | - | - | |||||||||||||||||||||||||||||||||||||||||||||||||||||||||||||||||||||||||||||||||||||||||||
| RH | A5l | - | - | - | - | - | - | - | |||||||||||||||||||||||||||||||||||||||||||||||||||||||||||||||||||||||||||||||||||||||||||
| LH | A6cdl | -0.033 | 0.87 | 0.986 | 1.63 | 0.628 | 3.11 | 0.279 | |||||||||||||||||||||||||||||||||||||||||||||||||||||||||||||||||||||||||||||||||||||||||||
| LH | A6dl | -0.801 | - | - | 3.41 | 0.313 | - | - | |||||||||||||||||||||||||||||||||||||||||||||||||||||||||||||||||||||||||||||||||||||||||||
| RH | A6dl | 0.130 | 5.15 | 0.172 | - | - | - | - | |||||||||||||||||||||||||||||||||||||||||||||||||||||||||||||||||||||||||||||||||||||||||||
| LH | A6vl | -0.431 | - | - | - | - | - | - | |||||||||||||||||||||||||||||||||||||||||||||||||||||||||||||||||||||||||||||||||||||||||||
| RH | A7c | -1.634 | - | - | - | - | - | - | |||||||||||||||||||||||||||||||||||||||||||||||||||||||||||||||||||||||||||||||||||||||||||
| RH | A7ip | -0.255 | - | - | - | - | - | - | |||||||||||||||||||||||||||||||||||||||||||||||||||||||||||||||||||||||||||||||||||||||||||
| RH | A7m | -0.092 | 3.45 | 0.287 | 1.18 | 0.426 | 3.15 | 0.279 | |||||||||||||||||||||||||||||||||||||||||||||||||||||||||||||||||||||||||||||||||||||||||||
| LH | A7r | - | - | - | 4.43 | 0.278 | - | - | |||||||||||||||||||||||||||||||||||||||||||||||||||||||||||||||||||||||||||||||||||||||||||
| LH | iOccG | -0.814 | - | - | - | - | - | - | |||||||||||||||||||||||||||||||||||||||||||||||||||||||||||||||||||||||||||||||||||||||||||
| LH | IsOccG | -3.000 | 5.07 | 0.172 | 4.74 | 0.278 | - | - | |||||||||||||||||||||||||||||||||||||||||||||||||||||||||||||||||||||||||||||||||||||||||||
| LH | mOccG | -0.860 | 8.12 | 0.079 | - | - | - | - | |||||||||||||||||||||||||||||||||||||||||||||||||||||||||||||||||||||||||||||||||||||||||||
| LH | OPC | -0.547 | - | - | - | - | - | - | |||||||||||||||||||||||||||||||||||||||||||||||||||||||||||||||||||||||||||||||||||||||||||
| LH | V5/MT+ | -0.800 | 0.64 | 1.000 | 3.07 | 0.323 | 4.17 | 0.279 | |||||||||||||||||||||||||||||||||||||||||||||||||||||||||||||||||||||||||||||||||||||||||||
| RH | V5/MT+ | -1.043 | 0.11 | 1.000 | 2.47 | 0.375 | 3.52 | 0.279 | |||||||||||||||||||||||||||||||||||||||||||||||||||||||||||||||||||||||||||||||||||||||||||
| LH | Crus I | 0.206 | 1.27 | 0.829 | 0.18 | 1.000 | 3.97 | 0.279 | |||||||||||||||||||||||||||||||||||||||||||||||||||||||||||||||||||||||||||||||||||||||||||
| RH | Crus I | -1.788 | 2.14 | 0.536 | 0.07 | 1.000 | 4.73 | 0.279 | |||||||||||||||||||||||||||||||||||||||||||||||||||||||||||||||||||||||||||||||||||||||||||
| LH | VI | - | - | - | - | - | - | - | |||||||||||||||||||||||||||||||||||||||||||||||||||||||||||||||||||||||||||||||||||||||||||
| RH | VI | -1.017 | 0.11 | 1.000 | 2.76 | 0.345 | 4.00 | 0.279 | |||||||||||||||||||||||||||||||||||||||||||||||||||||||||||||||||||||||||||||||||||||||||||
| LH | VIIb | 0.145 | - | - | - | - | - | - | |||||||||||||||||||||||||||||||||||||||||||||||||||||||||||||||||||||||||||||||||||||||||||
| LH | VIIIb | -0.330 | 13.52 | 0.014* | - | - | - | - | |||||||||||||||||||||||||||||||||||||||||||||||||||||||||||||||||||||||||||||||||||||||||||
| Summary of results from the Linear Mixed Model (LMM) conducted per ROI to investigate whether BOLD variability differed across age groups and task conditions while controlling for framewise displacement (at the significance level of q < 0.05, after False Discovery Rate [FDR] correction for multiple comparisons). Values in bold reflect significant effects before FDR correction (p < 0.05). A dash (“-”) indicates that the corresponding term was excluded from the final model following stepwise simplification, or that no Box-Cox transformation was applied to the data. Regions in which all effects are indicated with a dash, the final model solely included framewise displacement as an effect. Significance level: *q < 0.05. | |||||||||||||||||||||||||||||||||||||||||||||||||||||||||||||||||||||||||||||||||||||||||||||||||||
| LH, Left Hemisphere; RH, Right Hemisphere; ROIs, Regions of Interest. | |||||||||||||||||||||||||||||||||||||||||||||||||||||||||||||||||||||||||||||||||||||||||||||||||||
Out of the 25 ROIs analyzed, five showed a significant main effect of AGE GROUP before FDR correction. In all of these regions - namely, right A2, right A6dl, left lsOccG, left mOccG, and left VIIIb – older adults exhibited greater BOLD SD compared to younger adults (see Figure 3; right A2: F[1, 51.03] = 6.27, p = 0.016, β [Younger] = -0.10; right A6dl: F[1, 50.68] = 5.15, p = 0.028, β [Younger] = -0.08; left lsOccG: F[1, 48.70] = 5.07, p = 0.029, β [Younger] = -0.95; left mOccG: F[1, 50.90] = 8.12, p = 0.006, β [Younger] = -0.24); left VIIIb: F[1, 50.64] = 13.52, p < 0.001, β [Younger] = -0.18). After correcting for multiple comparisons (with Benjamini-Hochberg FDR method), only the effect in the left VIIIb (q = 0.014) remained significant at q < 0.05.
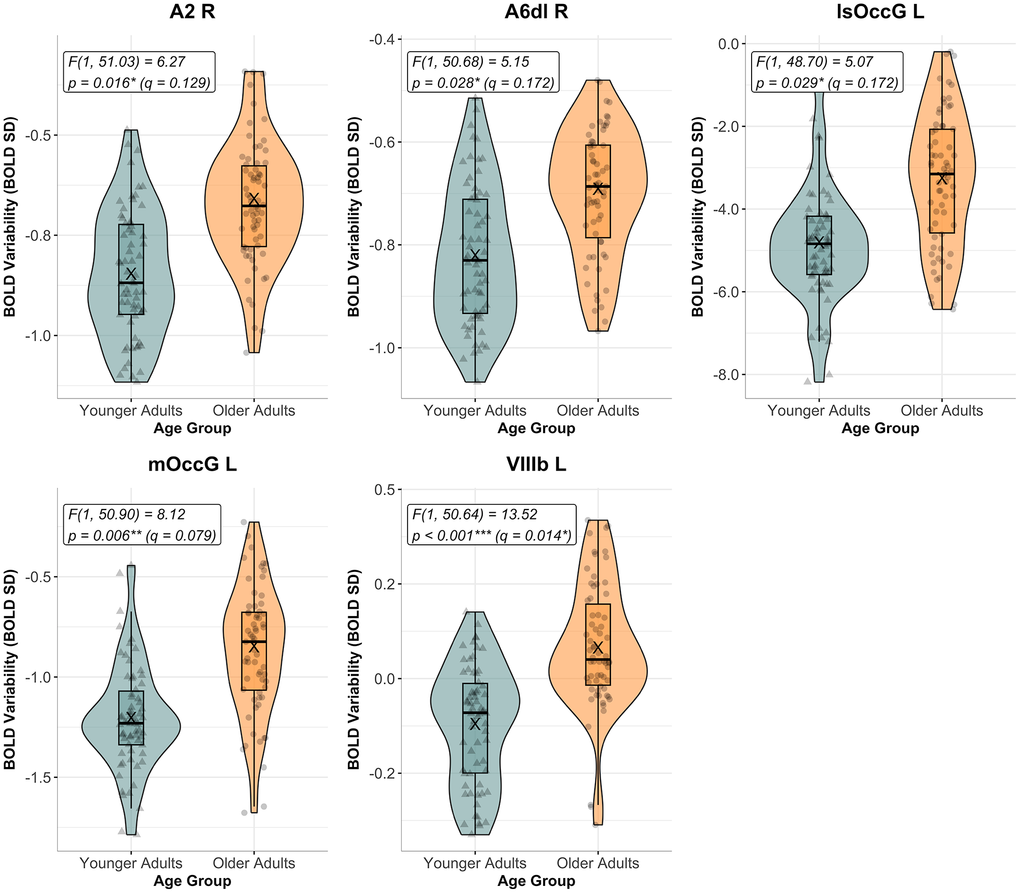
Figure 3. BOLD variability by age group in significant ROIs for main effect of age group before FDR correction. The figure shows transformed BOLD variability (BOLD SD) across age groups (Younger Adults in teal, and Older Adults in orange) during the Bimanual Tracking Task (BTT) for regions of interest (ROIs) that showed a significant main effect of AGE GROUP prior to FDR correction for multiple comparisons (p < 0.05). From these, only the group differences in the cerebellar lobe VIIIb survived correction (with q > 0.05). Individual data points reflect BOLD SD values pooled across all task conditions, per subject. F- and p-values for the main effect of AGE GROUP are reported for each ROI. Uncorrected significance levels: * p < 0.050, ** p < 0.010, *** p < 0.001. Corrected significance level: q < 0.05. Abbreviations: A2 = primary somatosensory cortex; A6dl = dorsolateral premotor cortex; FDR = False Discovery Rate; L = left; lsOccG = lateral superior occipital gyrus; mOccG = middle occipital gyrus; R = right; VIIIb = cerebellar lobule VIIIb.
Regarding TASK CONDITION, uncorrected effects were found in the left A6dl, left A7r, and left lsOccG, with BOLD SD generally scaling up with task difficulty (i.e., Line 1:1 < Line 3:1 < Angle 3:1) in both age groups (left A6dl: F[2, 84.08] = 3.41, p = 0.038, β [Line31] = 0.02 and β [Angle31] = 0.05; left A7r: F[2, 89.36] = 4.43, p = 0.015, β [Line31] < 0.01 and β [Angle31] = 0.49; left lsOccG: F[2, 48.70] = 5.07, p = 0.011, β [Line31] = 0.30 and β [Angle31] = 0.02). However, none of these effects survived FDR correction (with significance set at q < 0.05).
An uncorrected interaction between AGE GROUP and TASK CONDITION was found in six ROIs: right A7m, bilateral V5/MT+, bilateral Crus I, and right VI (right A7m: F[2, 91.08] = 3.14, p = 0.047, β [Younger; Line31] = -0.05 and β [Younger; Angle31] = 0.02); left V5/MT+: F[2, 87.13] = 4.17, p = 0.019, β [Younger; Line31] = -0.02 and β [Younger; Angle31] = 0.08; right V5/MT+: F[2, 90.26] = 3.53, p = 0.033, β [Younger; Line31] = -0.08 and β [Younger; Angle31] = 0.02; left Crus I: F[2, 89.70] = 3.98, p = 0.022, β [Younger; Line31] = -0.03 and β [Younger; Angle31] = 0.03; right Crus I: F[2, 88.92] = 4.73, p = 0.011, β [Younger; Line31] = -0.04 and β [Younger; Angle31] = 0.08; right VI: F[2, 89.95] = 3.99, p = 0.022, β [Younger; Line31] = -0.03 and β [Younger; Angle31] = 0.05). None of the interaction effects survived FDR correction.
A visualization of the regions showing significant uncorrected results for each effect, can be found in Figure 4. For a summary of the corresponding results after FDR correction, see Table 2. In Figure 5, the group-specific patterns of BOLD SD change across task conditions are depicted for ROIs that showed a significant uncorrected effect of TASK CONDITION or AGE GROUP X TASK CONDITION.
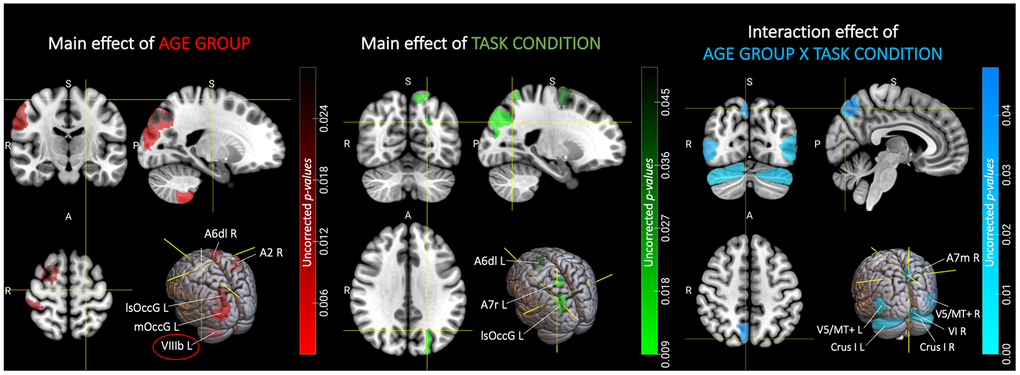
Figure 4. Regions showing significant effects of age group, task condition and their interaction on BOLD variability prior to FDR correction. The figure shows, separately for the main effects of AGE GROUP and TASK CONDITION, as well as their interaction effect, the location of the brain regions that yield a significant result prior to FDR correction. Only the effect of AGE GROUP in the left cerebellar lobule VIIIb (circled region) remained significant after correction for multiple comparisons (with q < 0.05). Color gradients indicate uncorrected p-values for the corresponding effect (red for main effect of AGE GROUP, green for main effect of TASK CONDITION and blue for their interaction) in a given region. Brain slices and volumes depicted in this figure were created with MRIcroGL (Version 1.2.20220720b; https://www.nitrc.org/projects/mricrogl) [37]. Abbreviations: A2 = primary somatosensory cortex; A6dl = dorsolateral premotor cortex; A7m = precuneus; A7r = superior parietal lobe; Crus I = cerebellar lobule Crus I; FDR = False Discovery Rate; L = left; lsOccG = lateral superior occipital gyrus; mOccG = middle occipital gyrus; R = right; V5/MT+ = motion area V5/MT+; VI = cerebellar lobule VI; VIIIb = cerebellar lobule VIIIb.
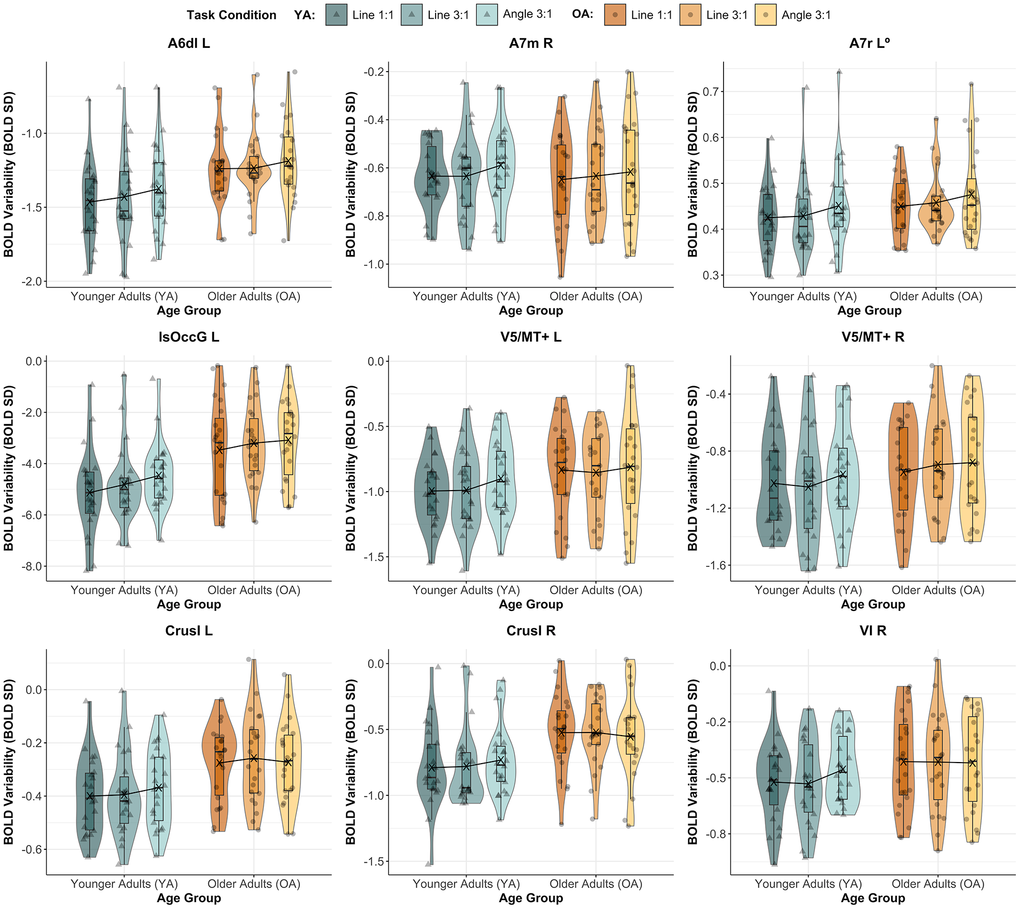
Figure 5. BOLD variability by age group and task condition in several ROIs. Figure shows BOLD variability transformed (except for A7r L, as indicated with “0”) across age groups (Younger Adults in varying shades of teal, and Older Adults in different shades of orange) and task conditions (Line 1:1, Line 3:1 and Angle 3:1) for ROIs with a significant main effect of TASK CONDITION (namely, A6dl L, A7r L and lsOccG L) or AGE GROUP x TASK CONDITION interaction (i.e., A7m R, bilateral V5/MT+, bilateral Crus I and VI R), before correcting for multiple comparisons. None of these results remained significant after correction (in all, q > 0.05). Mean BOLD SD, per group, for each task condition is indicated by an “X”. Abbreviations: A6dl = dorsolateral premotor cortex; A7m = precuneus; A7r = superior parietal lobe; Crus I = cerebellar lobule Crus I; L = Left; L = left; lsOccG = lateral superior occipital gyrus; OA = Older Adults; R = Right; V5/MT+ = motion area V5/MT+; VI = cerebellar lobule VI; YA = Younger Adults.
Lastly, FRAMEWISE DISPLACMENT was consistently a robust predictor across all models, showing a significant positive association with BOLD SD in all ROIs (after FDR correction all ROIs kept a significance of q < 0.001), except in left V5/MT+ (p = 0.006), right VI (p = 0.03), and left VIIIb (p = 0.02).
For detailed results of this analysis by ROI, consult Supplementary Table 1.
Age group differences in BOLD variability modulation
We found an uncorrected age group difference in BOLD SD modulation across several ROIs (see values in Bold in Table 3). These regions included the right A2, right A39c, left A40rd, left lsOccG, left mOccG, right V5/MT+, bilateral Crus I, left VIIb and left VIIIb (right A2: t = 3.15, p = 0.003; right A39c: W = 333, p = 0.034; left A40rd: W = 353, p = 0.009; left lsOccG: W = 342, p = 0.020; left mOccG: W = 336, p = 0.028; right V5/MT+: W = 316, p = 0.040; left Crus I: W = 321, p = 0.030; right Crus I: W = 336, p = 0.011; left VIIb: W = 398, p = 0.001; left VIIIb: W = 406, p = 0.001). After correction for multiple comparisons, four regions remained significant at q < 0.05: the right A2 and the left A40rd (q = 0.025), as well as the cerebellar lobules left VIIb and VIIIb (q = 0.013). Across these regions, older adults consistently showed more BOLD SD modulation than younger adults, with effects sizes of large magnitude (i.e., Cohen’s d > 0.8 or rank-biserial correlation > 0.5; specifically, right A2: Cohen’s d = -0.96; left A40rd: rank-biserial correlation = -0.53; left VIIb: rank-biserial correlation = -0.57; left VIIIb: rank-biserial correlation = -0.61). A summary of the FDR-corrected results, as well as the descriptive statistics by age group is provided in Table 3.
Table 3. Age-group differences in BOLD SD modulation.
| ROIs | W/t∇ | q | Rank-biserial correlation/Cohen's d∇ | Younger adults | Older adults | ||||||||||||||||||||||||||||||||||||||||||||||||||||||||||||||||||||||||||||||||||||||||||||||
| Median/Mean∇ | IQR/SD∇ | Median/Mean∇ | IQR/SD∇ | ||||||||||||||||||||||||||||||||||||||||||||||||||||||||||||||||||||||||||||||||||||||||||||||||
| RH | A2 | 3.15∇ | 0.025* | -0.96 ∇ | 0.086∇ | 0.023∇ | 0.115∇ | 0.037∇ | |||||||||||||||||||||||||||||||||||||||||||||||||||||||||||||||||||||||||||||||||||||||||||
| LH | A37vl | 1.61∇ | 0.184 | -0.49 ∇ | 0.104∇ | 0.031∇ | 0.122∇ | 0.040∇ | |||||||||||||||||||||||||||||||||||||||||||||||||||||||||||||||||||||||||||||||||||||||||||
| RH | A39c | 333 | 0.097 | -0.38 | 0.087 | 0.023 | 0.109 | 0.032 | |||||||||||||||||||||||||||||||||||||||||||||||||||||||||||||||||||||||||||||||||||||||||||
| LH | A40rd | 353 | 0.025* | -0.53 | 0.074 | 0.019 | 0.098 | 0.044 | |||||||||||||||||||||||||||||||||||||||||||||||||||||||||||||||||||||||||||||||||||||||||||
| RH | A5l | 310 | 0.184 | -0.28 | 0.100 | 0.031 | 0.106 | 0.043 | |||||||||||||||||||||||||||||||||||||||||||||||||||||||||||||||||||||||||||||||||||||||||||
| LH | A6cdl | 299 | 0.257 | -0.24 | 0.082 | 0.026 | 0.087 | 0.028 | |||||||||||||||||||||||||||||||||||||||||||||||||||||||||||||||||||||||||||||||||||||||||||
| LH | A6dl | 336 | 0.097 | -0.39 | 0.075 | 0.016 | 0.083 | 0.025 | |||||||||||||||||||||||||||||||||||||||||||||||||||||||||||||||||||||||||||||||||||||||||||
| RH | A6dl | 332 | 0.097 | -0.37 | 0.093 | 0.039 | 0.100 | 0.025 | |||||||||||||||||||||||||||||||||||||||||||||||||||||||||||||||||||||||||||||||||||||||||||
| LH | A6vl | 1.75∇ | 0.157 | -0.53 ∇ | 0.101∇ | 0.023∇ | 0.116∇ | 0.032∇ | |||||||||||||||||||||||||||||||||||||||||||||||||||||||||||||||||||||||||||||||||||||||||||
| RH | A7c | 235 | 0.915 | 0.03 | 0.115 | 0.054 | 0.107 | 0.034 | |||||||||||||||||||||||||||||||||||||||||||||||||||||||||||||||||||||||||||||||||||||||||||
| RH | A7ip | 310 | 0.184 | -0.28 | 0.096 | 0.028 | 0.118 | 0.057 | |||||||||||||||||||||||||||||||||||||||||||||||||||||||||||||||||||||||||||||||||||||||||||
| RH | A7m | 208 | 0.491 | 0.14 | 0.117 | 0.050 | 0.116 | 0.047 | |||||||||||||||||||||||||||||||||||||||||||||||||||||||||||||||||||||||||||||||||||||||||||
| LH | A7r | 243 | 0.991 | -0.00 | 0.090 | 0.038 | 0.091 | 0.035 | |||||||||||||||||||||||||||||||||||||||||||||||||||||||||||||||||||||||||||||||||||||||||||
| LH | iOccG | 314 | 0.097 | -0.36 | 0.122 | 0.047 | 0.156 | 0.057 | |||||||||||||||||||||||||||||||||||||||||||||||||||||||||||||||||||||||||||||||||||||||||||
| LH | IsOccG | 342 | 0.081 | -0.41 | 0.083 | 0.023 | 0.099 | 0.033 | |||||||||||||||||||||||||||||||||||||||||||||||||||||||||||||||||||||||||||||||||||||||||||
| LH | mOccG | 336 | 0.097 | -0.39 | 0.087 | 0.020 | 0.106 | 0.037 | |||||||||||||||||||||||||||||||||||||||||||||||||||||||||||||||||||||||||||||||||||||||||||
| LH | OPC | 288 | 0.357 | -0.19 | 0.131 | 0.041 | 0.149 | 0.075 | |||||||||||||||||||||||||||||||||||||||||||||||||||||||||||||||||||||||||||||||||||||||||||
| LH | V5/MT+ | 257 | 0.582 | -0.13 | 0.105 | 0.040 | 0.108 | 0.021 | |||||||||||||||||||||||||||||||||||||||||||||||||||||||||||||||||||||||||||||||||||||||||||
| RH | V5/MT+ | 316 | 0.097 | -0.37 | 0.100 | 0.029 | 0.121 | 0.046 | |||||||||||||||||||||||||||||||||||||||||||||||||||||||||||||||||||||||||||||||||||||||||||
| LH | Crus I | 321 | 0.097 | -0.39 | 0.131 | 0.051 | 0.180 | 0.077 | |||||||||||||||||||||||||||||||||||||||||||||||||||||||||||||||||||||||||||||||||||||||||||
| RH | Crus I | 336 | 0.056 | -0.46 | 0.124 | 0.030 | 0.152 | 0.052 | |||||||||||||||||||||||||||||||||||||||||||||||||||||||||||||||||||||||||||||||||||||||||||
| LH | VI | 281 | 0.301 | -0.22 | 0.144 | 0.044 | 0.152 | 0.059 | |||||||||||||||||||||||||||||||||||||||||||||||||||||||||||||||||||||||||||||||||||||||||||
| RH | VI | 287 | 0.357 | -0.19 | 0.135 | 0.022 | 0.141 | 0.040 | |||||||||||||||||||||||||||||||||||||||||||||||||||||||||||||||||||||||||||||||||||||||||||
| LH | VIIb | 398 | 0.013* | -0.57 | 0.120 | 0.032 | 0.157 | 0.104 | |||||||||||||||||||||||||||||||||||||||||||||||||||||||||||||||||||||||||||||||||||||||||||
| LH | VIIIb | 406 | 0.013* | -0.61 | 0.178 | 0.052 | 0.229 | 0.140 | |||||||||||||||||||||||||||||||||||||||||||||||||||||||||||||||||||||||||||||||||||||||||||
| Summary of results from analyses examining age-group differences in BOLD SD modulation, for all ROIs, after False Discovery Rate [FDR] correction for multiple comparisons (with significance set at q < 0.05). Significance level: * q < 0.05. Values in bold reflect effects significantly before FDR correction (p < 0.05). Descriptive statistics are provided for each age group. For variables violating normality assumptions, medians and interquartile ranges (IQR) are reported and Wilcoxon Rank Sum tests were used. For normally distributed data, means and standard deviations (SD) are reported and independent-samples T-tests were conducted (indicated with “∇”). | |||||||||||||||||||||||||||||||||||||||||||||||||||||||||||||||||||||||||||||||||||||||||||||||||||
| Effect sizes are reported as rank-biserial correlations or Cohen’s d, depending on whether non-parametric or parametric tests were used for the corresponding age-group comparison. | |||||||||||||||||||||||||||||||||||||||||||||||||||||||||||||||||||||||||||||||||||||||||||||||||||
| IQR, Interquartile Range; LH, Left Hemisphere; RH, Right Hemisphere; ROIs, Regions of Interest; SD, Standard Deviation. | |||||||||||||||||||||||||||||||||||||||||||||||||||||||||||||||||||||||||||||||||||||||||||||||||||
Across ROIs, up to one participant per age group was excluded due to BOLD SD modulation values exceeding three standard deviations from their group's mean in that region.
Impact of age-group differences in BOLD variability and BOLD variability modulation on BTT performance
Effect of BOLD variability differences in age groups and task conditions on BTT performance
For each ROI that showed a significant result in any of the previous analyses before FDR correction, we additionally examined whether BOLD variability, task demands, and age group affect behavioral performance.
For that, we employed a LMM per ROI that tested the effects of BOLD SDREGRESSED (i.e., BOLD SD signal regressed for FD), TASK CONDITION, AGE GROUP and the interactions of BOLD SDREGRESSED x TASK CONDITION and BOLD SDREGRESSED x AGE GROUP on BTT SCORE. This analysis revealed an uncorrected positive association between BOLD SDREGRESSED and BTT performance in the right A7m and left lsOccG (right A7m: F[1, 114.54] = 5.20, p = 0.025, β = 26.57; left lsOccG: F[1, 121.60] = 5.81, p = 0.017, β = 19.49), although neither effect survived FDR correction (q = 0.280 for both regions).
In contrast, AGE GROUP and TASK CONDITION showed consistent main effects in the right A7m, left IsOccG, right Crus I and right VI, with p-values < 0.001 that remained significant after correction for multiple comparisons.
With respect to the interaction BOLD SDREGRESSED x TASK CONDITION, only the left A6dl, right A6dl, left mOccG, left V5/MT+, left Crus I, and left VIIIb yielded uncorrected effects (left A6dl: F[2, 92.66] = 3.32, p = 0.041, β [Line31] = 42.75 and β [Angle31] = 72.14; right A6dl: F[2, 92.30] = 5.03, p = 0.009, β [Line31] = 46.32 and β [Angle31] = 65.03; left mOccG: F[2, 96.84] = 3.60, p = 0.031, β [Line31] = 38.88 and β [Angle31] = 13.72; left V5/MT+: F[2, 91.96] = 4.02, p = 0.021, β [Line31] = 36.57 and β [Angle31] = 16.06; left Crus I: F[2, 94.48] = 5.15, p = 0.007, β [Line31] = 40.76 and β [Angle31] = 33.69; left VIIIb: F[2, 91.92] = 3.48, p = 0.035, β [Line31] = 19.84 and β [Angle31] = 16.04). However, none reached the level of significance after FDR correction (q = 0.120 in the right A6dl, left V5/MT+ and left Crus I; q = 0.125 in the left A6dl, left mOccG and left VIIIb).
Lastly, regarding the BOLD SDREGRESSED x AGE GROUP interaction, a uncorrected effect was found for the right A2, left A40rd and left Crus I (right A2: F[1, 94.60] = 4.00, p = 0.048, β [younger] = -65.23; left A40rd: F[1, 81.82] = 6.56, p = 0.012, β [younger] = -75.88; left Crus I: F[1, 100.71] = 4.28, p = 0.041, β [younger] = -43.34). None of these interaction effects survived correction for multiple comparisons at q < 0.05 (right A2r: q = 0.328; left A40rd: q = 0.196; left Crus I: q = 0.123).
Detailed results of this analysis by ROI can be found in Supplementary Table 2.
Effect of age-group differences in BOLD variability modulation on BTT performance
To investigate the relationship between BOLD variability modulation, the age group and behavioral performance, we conducted a multiple linear regression for each of the sixteen ROIs (i.e., regions highlighted in bold in Table 4). In each model, MEAN BTT SCORE was predicted by BOLD SD MODULATION, AGE GROUP (Younger Adults vs. Older Adults), and their interaction. On average, per ROI, one participant (generally an older adult; corresponding to 2.2% of the total number of participants; ranging from zero to two participants) was excluded from the analysis because BOLD SD modulation was more than three standard deviations from the region’s mean BOLD SD modulation.
Table 4. Local maxima and correspondent brain regions in the atlases.
| Brain region | Atlas label | Local maxima | |||||||||||||||||||||||||||||||||||||||||||||||||||||||||||||||||||||||||||||||||||||||||||||||||
| Z | x | y | z | ||||||||||||||||||||||||||||||||||||||||||||||||||||||||||||||||||||||||||||||||||||||||||||||||
| Brainnetome | |||||||||||||||||||||||||||||||||||||||||||||||||||||||||||||||||||||||||||||||||||||||||||||||||||
| LH | Superior frontal gyrus | A6dl, dorsolateral area 6 | 7 | 5.62 | 56 | 65 | 67 | ||||||||||||||||||||||||||||||||||||||||||||||||||||||||||||||||||||||||||||||||||||||||||||
| RH | Superior frontal gyrus | A6dl, dorsolateral area 6 | 8 | 5.93 | 35 | 68 | 63 | ||||||||||||||||||||||||||||||||||||||||||||||||||||||||||||||||||||||||||||||||||||||||||||
| LH | Middle frontal gyrus | A6vl, ventrolateral area 6 | 25 | 6.08 | 56 | 64 | 61 | ||||||||||||||||||||||||||||||||||||||||||||||||||||||||||||||||||||||||||||||||||||||||||||
| LH | Precentral gyrus | A6cdl, caudal dorsolateral area 6 | 55 | 5.99 | 62 | 59 | 61 | ||||||||||||||||||||||||||||||||||||||||||||||||||||||||||||||||||||||||||||||||||||||||||||
| LH | Inferior temporal gyrus | A37vl, ventrolateral area 37 | 97 | 6.88 | 70 | 31 | 33 | ||||||||||||||||||||||||||||||||||||||||||||||||||||||||||||||||||||||||||||||||||||||||||||
| LH | Superior parietal lobule | A7r, rostral area 7 | 125 | 7.47 | 51 | 30 | 68 | ||||||||||||||||||||||||||||||||||||||||||||||||||||||||||||||||||||||||||||||||||||||||||||
| 6.5 | 53 | 35 | 68 | ||||||||||||||||||||||||||||||||||||||||||||||||||||||||||||||||||||||||||||||||||||||||||||||||
| 6.48 | 51 | 35 | 72 | ||||||||||||||||||||||||||||||||||||||||||||||||||||||||||||||||||||||||||||||||||||||||||||||||
| RH | Superior parietal lobule | A7c, caudal area 7 | 128 | 6.74 | 37 | 26 | 65 | ||||||||||||||||||||||||||||||||||||||||||||||||||||||||||||||||||||||||||||||||||||||||||||
| RH | Superior parietal lobule | A5l, lateral area 5 | 130 | 5.84 | 28 | 45 | 57 | ||||||||||||||||||||||||||||||||||||||||||||||||||||||||||||||||||||||||||||||||||||||||||||
| RH | Superior parietal lobule | A7ip, intraparietal area 7 | 134 | 5.7 | 30 | 38 | 66 | ||||||||||||||||||||||||||||||||||||||||||||||||||||||||||||||||||||||||||||||||||||||||||||
| RH | Superior parietal lobule | A39c, caudal area 39 | 136 | 5.69 | 24 | 31 | 44 | ||||||||||||||||||||||||||||||||||||||||||||||||||||||||||||||||||||||||||||||||||||||||||||
| 5.66 | 21 | 25 | 47 | ||||||||||||||||||||||||||||||||||||||||||||||||||||||||||||||||||||||||||||||||||||||||||||||||
| 5.65 | 24 | 24 | 50 | ||||||||||||||||||||||||||||||||||||||||||||||||||||||||||||||||||||||||||||||||||||||||||||||||
| LH | Inferior parietal lobule | A40rd, rostrodorsal area 40 | 139 | 6.08 | 64 | 43 | 58 | ||||||||||||||||||||||||||||||||||||||||||||||||||||||||||||||||||||||||||||||||||||||||||||
| 5.98 | 68 | 45 | 56 | ||||||||||||||||||||||||||||||||||||||||||||||||||||||||||||||||||||||||||||||||||||||||||||||||
| RH | Precuneus | A7m, medial area 7 | 148 | 6.91 | 42 | 33 | 65 | ||||||||||||||||||||||||||||||||||||||||||||||||||||||||||||||||||||||||||||||||||||||||||||
| RH | Postcentral gyrus | A2, area 2 | 160 | 6.07 | 24 | 49 | 57 | ||||||||||||||||||||||||||||||||||||||||||||||||||||||||||||||||||||||||||||||||||||||||||||
| LH | Lateral occipital cortex | mOccG, middle occipital gyrus | 199 | 7.67 | 59 | 17 | 42 | ||||||||||||||||||||||||||||||||||||||||||||||||||||||||||||||||||||||||||||||||||||||||||||
| 6.97 | 63 | 20 | 38 | ||||||||||||||||||||||||||||||||||||||||||||||||||||||||||||||||||||||||||||||||||||||||||||||||
| LH | Lateral occipital cortex | V5/MT+, area V5/MT+ | 201 | 7.5 | 66 | 27 | 37 | ||||||||||||||||||||||||||||||||||||||||||||||||||||||||||||||||||||||||||||||||||||||||||||
| RH | Lateral occipital cortex | V5/MT+, area V5/MT+ | 202 | 6.69 | 21 | 32 | 37 | ||||||||||||||||||||||||||||||||||||||||||||||||||||||||||||||||||||||||||||||||||||||||||||
| 5.77 | 21 | 26 | 39 | ||||||||||||||||||||||||||||||||||||||||||||||||||||||||||||||||||||||||||||||||||||||||||||||||
| LH | Lateral occipital cortex | OPC, occipital polar cortex | 203 | 6.45 | 53 | 13 | 40 | ||||||||||||||||||||||||||||||||||||||||||||||||||||||||||||||||||||||||||||||||||||||||||||
| LH | Lateral occipital cortex | iOccG, inferior occipital gyrus | 205 | 5.7 | 62 | 22 | 30 | ||||||||||||||||||||||||||||||||||||||||||||||||||||||||||||||||||||||||||||||||||||||||||||
| LH | Lateral occipital cortex | lsOccG, lateral superior occipital gyrus | 209 | 6.92 | 55 | 21 | 57 | ||||||||||||||||||||||||||||||||||||||||||||||||||||||||||||||||||||||||||||||||||||||||||||
| Cerebellum SUIT | |||||||||||||||||||||||||||||||||||||||||||||||||||||||||||||||||||||||||||||||||||||||||||||||||||
| LH | Cerebellum | VI | 5 | 5.86 | 61 | 38 | 18 | ||||||||||||||||||||||||||||||||||||||||||||||||||||||||||||||||||||||||||||||||||||||||||||
| RH | Cerebellum | VI | 7 | 5.73 | 32 | 31 | 23 | ||||||||||||||||||||||||||||||||||||||||||||||||||||||||||||||||||||||||||||||||||||||||||||
| LH | Cerebellum | Crus I | 8 | 5.96 | 65 | 37 | 19 | ||||||||||||||||||||||||||||||||||||||||||||||||||||||||||||||||||||||||||||||||||||||||||||
| RH | Cerebellum | Crus I | 10 | 6.17 | 22 | 32 | 22 | ||||||||||||||||||||||||||||||||||||||||||||||||||||||||||||||||||||||||||||||||||||||||||||
| 5.67 | 26 | 37 | 20 | ||||||||||||||||||||||||||||||||||||||||||||||||||||||||||||||||||||||||||||||||||||||||||||||||
| LH | Cerebellum | VIIb | 14 | 6.4 | 47 | 25 | 16 | ||||||||||||||||||||||||||||||||||||||||||||||||||||||||||||||||||||||||||||||||||||||||||||
| LH | Cerebellum | VIIIb | 20 | 6.16 | 51 | 32 | 10 | ||||||||||||||||||||||||||||||||||||||||||||||||||||||||||||||||||||||||||||||||||||||||||||
| Coordinates and Z-values of local maxima spaced at least 8 mm apart, derived from clusters containing 10 or more voxels identified in the functional activation contrast “Angle 3:1 > Line 3:1”, since the contrast “Line 3:1 > Line 1:1” did not show significant clusters of brain activation. Activation peaks were subsequently labeled using the Brainnetome Atlas (for cortical regions) and the Cerebellum SUIT Atlas (for cerebellar regions), resulting in the 25 brain regions indicated (see Figure 9). Only the regions highlighted in bold integrated all analyses in the current study (see section 4.8.2.3). | |||||||||||||||||||||||||||||||||||||||||||||||||||||||||||||||||||||||||||||||||||||||||||||||||||
| LH, Left hemisphere; RH, Right hemisphere. | |||||||||||||||||||||||||||||||||||||||||||||||||||||||||||||||||||||||||||||||||||||||||||||||||||
After FDR correction, significant main effects of AGE GROUP were consistently observed across all analyzed ROIs (q < 0.001), indicating that age remained a strong predictor of BTT performance regardless of BOLD SD modulation.
An uncorrected main effect of BOLD SD MODULATION was found in the left lsOccG, mOccG and Crus I (left lsOccG: p = 0.028, β = 41.87; left mOccG: p = 0.011, β = 25.66; left Crus I: p = 0.003, β = - 38.18). However, only in the left mOccG and left Crus I these effects remained significant after correction for multiple comparisons (q = 0.042 and q = 0.014, respectively).
Additionally, FDR-corrected significant AGE GROUP × BOLD SD MODULATION interactions emerged in the right A2, left A40rd, left A7m, left A7r, left V5/MT+, right V5/MT+, and right VI (right A2: q = 0.001, β [younger] = - 215.52; left A40rd: q = 0.002, β [younger] = - 123.33; left A7m: q = 0.039, β [younger] = - 81.95; left A7r: q < 0.001, β [younger] = - 172.45; left V5/MT+: q < 0.001, β [younger] = -156.75; right V5/MT+: q < 0.001, β [younger] = - 168.31; right VI: q = 0.003, β [younger] = - 191.81). These results suggested that the relationship between BOLD variability modulation and task performance differed by age in these regions (check Figure 6). A summary of the FDR-corrected results for all regions analyzed can be found in Table 5. Detailed results of this analysis for each ROI are presented in Supplementary Table 3.
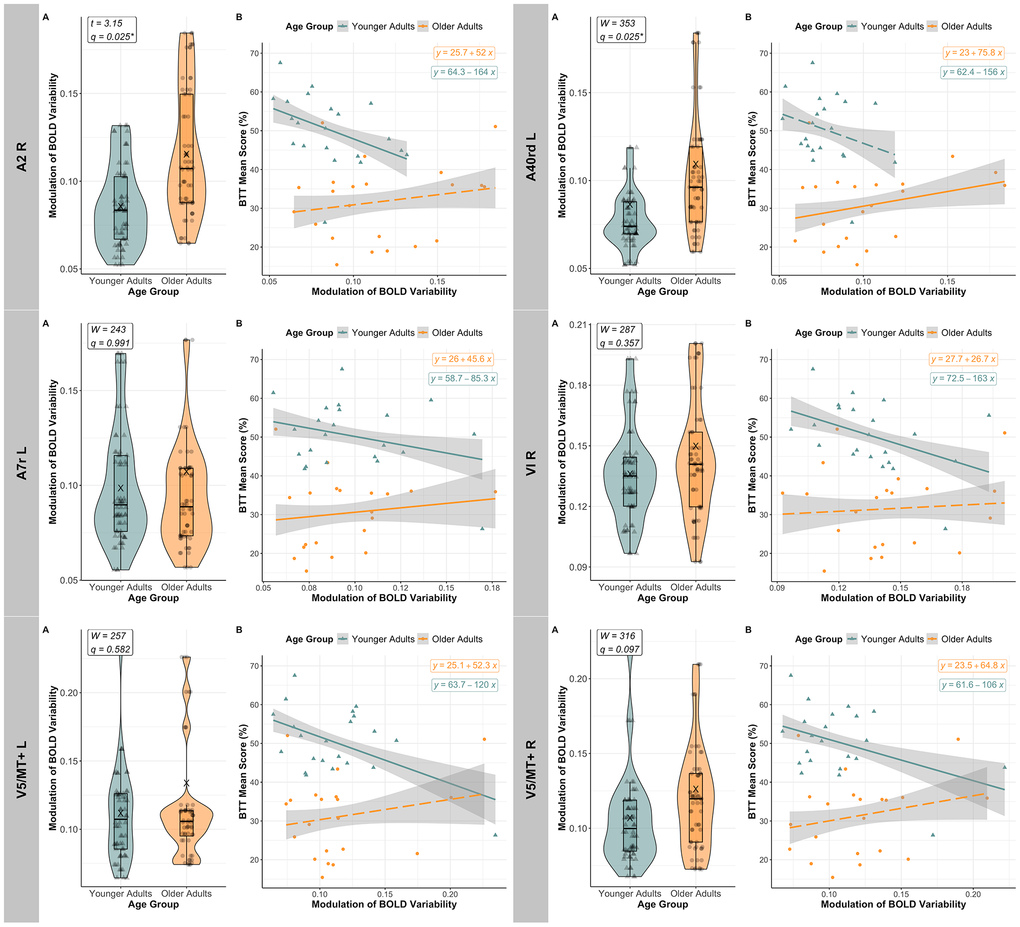
Figure 6. Age-related modulation of BOLD variability and its relationship with BTT performance. For each region of interest (ROI) where BOLD SD MODULATION significantly predicted BTT MEAN SCORE after FDR correction in at least one of the age groups, the figure shows: [A] BOLD variability (BOLD SD) modulation across age groups (Younger Adults in teal [triangles], and Older Adults in orange [circles]). In the right primary somatosensory cortex (A2), the left inferior parietal lobe (A40rd), as well as the left cerebellar lobules VIIb and VIIIb (not displayed in the figure), older adults exhibited, on average (“X”), more BOLD SD modulation than younger adults, with q < 0.05 (FDR-corrected). Significance level: * q < 0.050; [B] The relationship between BOLD SD modulation and mean BTT performance, shown per age-group (Younger Adults again in teal [triangles], and Older Adults in orange [circles]). After FDR correction, younger adults consistently exhibited a significant negative association between BOLD SD modulation and performance across all ROIs analyzed, except for the left inferior parietal lobe (A40rd), while older adults showed a positive relationship in the left inferior and parietal lobes (left A40rd and A7r, respectively). Dashed regression lines identify effects that did not survive FDR correction. Abbreviations: A2 = primary somatosensory cortex; A40rd = inferior parietal lobe; A7r = superior parietal lobe; FDR = False Discovery Rate; L = Left; R = Right; V5/MT+ = motion area V5/MT+; VI = cerebellar lobule VI.
Table 5. Effect of age group, BOLD SD modulation and their interaction on mean BTT score in all ROIs analyzed.
| ROIs | Age group | BOLD SD modulation | Age group X BOLD SD modulation | ||||||||||||||||||||||||||||||||||||||||||||||||||||||||||||||||||||||||||||||||||||||||||||||||
| F | q | F | q | F | q | ||||||||||||||||||||||||||||||||||||||||||||||||||||||||||||||||||||||||||||||||||||||||||||||
| RH | A2 | 44.36 | < 0.001*** | 2.83 | 0.182 | 13.47 | 0.001** | ||||||||||||||||||||||||||||||||||||||||||||||||||||||||||||||||||||||||||||||||||||||||||||
| RH | A39c | 131.19 | < 0.001*** | - | - | - | - | ||||||||||||||||||||||||||||||||||||||||||||||||||||||||||||||||||||||||||||||||||||||||||||
| LH | A40rd | 71.57 | < 0.001*** | 18.85 | < 0.001*** | 12.60 | 0.002** | ||||||||||||||||||||||||||||||||||||||||||||||||||||||||||||||||||||||||||||||||||||||||||||
| LH | A6dl | 131.19 | < 0.001*** | - | - | - | - | ||||||||||||||||||||||||||||||||||||||||||||||||||||||||||||||||||||||||||||||||||||||||||||
| RH | A6dl | 128.53 | < 0.001*** | - | - | - | - | ||||||||||||||||||||||||||||||||||||||||||||||||||||||||||||||||||||||||||||||||||||||||||||
| RH | A7m | 39.73 | < 0.001*** | 2.49 | 0.188 | 5.86 | 0.039* | ||||||||||||||||||||||||||||||||||||||||||||||||||||||||||||||||||||||||||||||||||||||||||||
| LH | A7r | 66.43 | < 0.001*** | 16.42 | < 0.001*** | 17.22 | <0.001*** | ||||||||||||||||||||||||||||||||||||||||||||||||||||||||||||||||||||||||||||||||||||||||||||
| LH | IsOccG | 138.17 | < 0.001*** | 4.94 | 0.064 | - | - | ||||||||||||||||||||||||||||||||||||||||||||||||||||||||||||||||||||||||||||||||||||||||||||
| LH | mOccG | 143.00 | < 0.001*** | 6.74 | 0.042* | - | - | ||||||||||||||||||||||||||||||||||||||||||||||||||||||||||||||||||||||||||||||||||||||||||||
| LH | V5/MT+ | 81.15 | < 0.001*** | 6.04 | 0.042* | 23.02 | <0.001*** | ||||||||||||||||||||||||||||||||||||||||||||||||||||||||||||||||||||||||||||||||||||||||||||
| RH | V5/MT+ | 60.89 | < 0.001*** | 6.50 | 0.042* | 17.58 | <0.001*** | ||||||||||||||||||||||||||||||||||||||||||||||||||||||||||||||||||||||||||||||||||||||||||||
| LH | Crus I | 110.74 | < 0.001*** | 9.35 | 0.014* | - | - | ||||||||||||||||||||||||||||||||||||||||||||||||||||||||||||||||||||||||||||||||||||||||||||
| RH | Crus I | 131.19 | < 0.001*** | - | - | - | - | ||||||||||||||||||||||||||||||||||||||||||||||||||||||||||||||||||||||||||||||||||||||||||||
| RH | VI | 33.23 | < 0.001*** | 1.17 | 0.410 | 12.17 | 0.003** | ||||||||||||||||||||||||||||||||||||||||||||||||||||||||||||||||||||||||||||||||||||||||||||
| LH | VIIb | 123.87 | < 0.001*** | 2.90 | 0.182 | - | - | ||||||||||||||||||||||||||||||||||||||||||||||||||||||||||||||||||||||||||||||||||||||||||||
| LH | VIIIb | 132.90 | < 0.001*** | - | - | - | - | ||||||||||||||||||||||||||||||||||||||||||||||||||||||||||||||||||||||||||||||||||||||||||||
| Summary of results from the regression analyses conducted per ROI to investigate whether BOLD SD modulation predicted mean BTT performance (Mean BTT Score) and whether this relationship differed by age group. Values in bold reflect significant effects (p < 0.05) before FDR correction for multiple comparisons. A dash (“-”) indicates that the corresponding term was excluded from the final model following stepwise simplification. Significance levels: *q < 0.05. **q < 0.01. ***q < 0.001. | |||||||||||||||||||||||||||||||||||||||||||||||||||||||||||||||||||||||||||||||||||||||||||||||||||
| LH, Left Hemisphere; RH, Right hemisphere; ROIs, Regions of Interest. | |||||||||||||||||||||||||||||||||||||||||||||||||||||||||||||||||||||||||||||||||||||||||||||||||||
For ROIs where residuals violated normality or homoscedasticity assumptions, we employed residuals bootstrapping (20,000 samples) to obtain robust estimates and 95% confidence intervals. Predictors whose bootstrapped confidence intervals excluded zero were considered statistically significant. Importantly, after applying this residuals’ bootstrapping procedure, the estimated regression coefficients and confidence intervals remained largely consistent with those from the original models (i.e., 95 % CIs [displayed in Table 6] overlapped with the original estimates). This robustness supported the reliability of the observed effects and reinforced the conclusions drawn from the standard analysis.
Table 6. Confidence intervals from percentile residual bootstrapping analysis.
| ROIs | Age group | BOLD SD modulation | Age group x BOLD SD modulation | ||||||||||||||||||||||||||||||||||||||||||||||||||||||||||||||||||||||||||||||||||||||||||||||||
| 95% bootstrap CIs | 95% bootstrap CIs | 95% bootstrap CIs | |||||||||||||||||||||||||||||||||||||||||||||||||||||||||||||||||||||||||||||||||||||||||||||||||
| RH | A2 | [27.33, 49.81] | [-8.21, 111.28] | [-328.50, -100.30] | |||||||||||||||||||||||||||||||||||||||||||||||||||||||||||||||||||||||||||||||||||||||||||||||
| LH | A40rd | [24.33, 38.98] | [58.60, 154.30] | [-190.90, -55.00] | |||||||||||||||||||||||||||||||||||||||||||||||||||||||||||||||||||||||||||||||||||||||||||||||
| LH | A6dl | [15.03, 37.93] | [-55.32, 78.22] | [-224.40, 33.70] | |||||||||||||||||||||||||||||||||||||||||||||||||||||||||||||||||||||||||||||||||||||||||||||||
| RH | A6dl | [15.32, 40.07] | [-80.60, 96.43] | [-215.80, 27.10] | |||||||||||||||||||||||||||||||||||||||||||||||||||||||||||||||||||||||||||||||||||||||||||||||
| RH | A7m | [20.15, 38.13] | [-8.90, 91.48] | [-146.80, -15.50] | |||||||||||||||||||||||||||||||||||||||||||||||||||||||||||||||||||||||||||||||||||||||||||||||
| LH | A7r | [27.68, 44.89] | [46.70, 129.30] | [-250.80, -91.40] | |||||||||||||||||||||||||||||||||||||||||||||||||||||||||||||||||||||||||||||||||||||||||||||||
| LH | IsOccG | [14.74, 33.49] | [10.93, 92.55] | [-135.99, 46.08] | |||||||||||||||||||||||||||||||||||||||||||||||||||||||||||||||||||||||||||||||||||||||||||||||
| LH | V5/MT+ | [28.99, 44.77] | [8.31, 65.49] | [-218.70, -93.50] | |||||||||||||||||||||||||||||||||||||||||||||||||||||||||||||||||||||||||||||||||||||||||||||||
| RH | Crus I | [9.59, 27.25] | [-41.51, 20.33] | [-55.36, 52.94] | |||||||||||||||||||||||||||||||||||||||||||||||||||||||||||||||||||||||||||||||||||||||||||||||
| RH | VI | [29.86, 60.37] | [-22.27, 80.11] | [-298.89, -85.69] | |||||||||||||||||||||||||||||||||||||||||||||||||||||||||||||||||||||||||||||||||||||||||||||||
| LH | VIIIb | [11.99, 37.37] | [-26.20, 16.57] | [-103.25, 28.67] | |||||||||||||||||||||||||||||||||||||||||||||||||||||||||||||||||||||||||||||||||||||||||||||||
| 95 % Confidence Intervals (CIs) based on percentiles for AGE GROUP, BOLD SD MODULATION and their interaction resulting from a bootstrapping analysis of the residuals conducted for each region of interest (ROI) whose residuals violated normality and/or homoscedasticity assumptions. | |||||||||||||||||||||||||||||||||||||||||||||||||||||||||||||||||||||||||||||||||||||||||||||||||||
| CIs, Confidence Intervals; LH, Left Hemisphere; RH, Right Hemisphere; ROIs, Regions of Interest. | |||||||||||||||||||||||||||||||||||||||||||||||||||||||||||||||||||||||||||||||||||||||||||||||||||
Lastly, a post hoc simple regression analysis was conducted per age group to determine the relationship between MEAN BTT SCORE and BOLD SD MODULATION in regions showing an FDR-corrected significant AGE GROUP X BOLD SD MODULATION interaction. These analyses revealed that younger adults exhibit a significant negative association between BTT performance and BOLD SD modulation in five out of the seven regions analyzed (namely, right A2, left A7r, bilateral V5/MT+ and right cerebellar lobule VI) after FDR correction (all with q < 0.05). Conversely, in older adults, only in the left A40rd and the left A7r, higher BOLD SD modulation predicted higher BTT mean score before and after FDR correction for multiple comparisons (q < 0.001 and q = 0.001, respectively). Consult Figure 6 for a visualization of the relationship between BOLD variability modulation and BTT performance per age group, in all the ROIs analyzed. Coefficient estimates and confidence intervals from the bootstrapping analyses validated these same conclusions. Specifically, for younger adults, the 95% bootstrapped confidence intervals were the following: right A2 [- 276.30, - 57.50], left A40rd [- 126.90, 29.33], right A7m [- 107.98, 19.42], left A7r [- 190.20, 31.40], left V5/MT+ [- 180.70, - 18.50], right V5/MT+ [- 203.38, - 23.66] and right VI [- 328.70, - 36.50]. In contrast, for older adults, the confidence intervals were: right A2 [- 45.42, 142.03], left A40rd [32.8, 165.4], right A7m [- 30.90, 126.45], left A7r [19.30, 144.40], left V5/MT+ [- 4.84, 79.76], right V5/MT+ [- 14.01, 134.65], and right VI [- 53.28, 107.19].
An overview of the main findings from the analyses focusing on BOLD SD modulation was depicted in Figure 7.
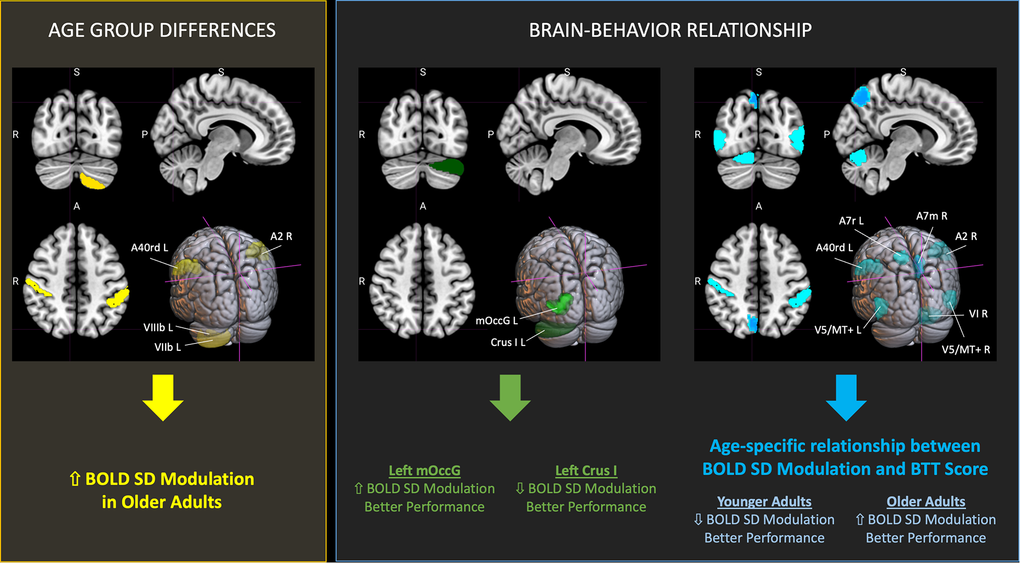
Figure 7. Significant findings on BOLD SD modulation and its relationship with bimanual task performance in aging. Summary of brain regions showing significant findings (FDR-corrected, with q < 0.05) relative to BOLD SD Modulation and its association with performance on the Bimanual Tracking Task (BTT). Cortical regions were defined based on the Brainnetome Atlas [38], and cerebellar regions using the Cerebellum SUIT Atlas [39]. Brain slices and volumes depicted in this figure in the MNI152 Template were created with MRIcroGL (Version 1.2.20220720b; https://www.nitrc.org/projects/mricrogl) [37]. Abbreviations: A2 = primary somatosensory cortex; A40rd = inferior parietal lobe; A7m = precuneus; A7r = superior parietal lobe; Crus I = cerebellar lobule Crus I; FDR = False Discovery Rate; L = left; mOccG = middle occipital gyrus; R = right; V5/MT+ = motion area V5/MT+; VI = cerebellar lobule VI; VIIb = cerebellar lobule VIIb; VIIIb = cerebellar lobule VIIIb.
Discussion
In the current study, we investigated how BOLD variability - specifically, BOLD SD - and its modulation across different levels of task complexity during a bimanual coordination task are affected by advancing age and relate to task performance.
Contrary to our initial hypotheses, compared with younger adults, older adults exhibited higher BOLD variability in the left VIIIb cerebellar lobule, independent of task complexity, as well as greater BOLD SD modulation in several sensorimotor and cerebellar regions. However, the observed age-related differences in BOLD variability did not predict BTT performance. In contrast, in both age groups, BOLD SD modulation in sensorimotor and visuospatial regions was predictive of BTT score.
Notably, in other regions, the relationship between BOLD SD modulation and BTT performance depended on age group. In particular, in younger adults, reduced modulation consistently predicted better performance across several regions, whereas in older adults, higher modulation in the left inferior and superior parietal lobes - regardless of the direction of modulation (i.e., up- or down-modulation) - was associated with better behavioral outcomes. Together, these findings suggest that advancing age influences the regulation of intrinsic neural dynamics in response to task demands, with implications for bimanual performance.
Behavioral results: Lower overall BTT performance in older adults, but similar effect of task condition across age groups
Our behavioral analysis revealed robust age-related differences in bimanual performance. Across all conditions of the BTT, younger adults significantly outperformed older adults. Task difficulty also influenced performance: participants performed best on the two line-tracking conditions (Line 1:1 and Line 3:1), and significantly worse on the angle condition (Angle 3:1), indicating that increased complexity impaired task execution. Post hoc comparisons confirmed that performance in the Angle 3:1 condition was significantly lower than in both line-tracking conditions, while no difference emerged between the two “Line” conditions. Importantly, the lack of an interaction between age group and task condition suggests that both younger and older adults were similarly affected by increasing task demands, even though their overall performance levels differed, which contrasts with previous findings indicating that older adults gradually lose their capacity to adapt to varying task requirements [6, 40–42]. This discrepancy between our results and existing literature may stem from differences in the type or amount of feedback provided [43, 44], or even the amount of exposure to the task conditions during the familiarization session. For instance, in all four aforementioned studies, BTT practice during the familiarization session lasted for a fixed duration of six minutes, which may have favored faster-learning in young adults who improved more during the practice, particularly under more challenging task conditions. In contrast, in our study, training was terminated once participants reached a performance threshold of 10%, thereby minimizing initial inter-individual discrepancies in task performance during the MR session. Nevertheless, these findings support the assumption that the Angle 3:1 condition imposed greater cognitive-motor coordination challenges across the lifespan. They also point to a graded behavioral pattern aligned with task complexity, as performance gradually declined from Line 1:1 to Line 3:1 and then more sharply in the Angle 3:1 condition. Although the difference between the two “Line” conditions did not reach statistical significance, the observed trend is consistent with a complexity-driven performance gradient that may help contextualize neural variability modulation.
Higher BOLD variability in older adults, but no association with BTT performance
While previous cognitive studies reported reduced task-related BOLD variability with aging [14, 15, 34], we found higher task-related BOLD SD in older relative to younger adults in the left VIIIb. This subdivision of the cerebellar lobule VIII is located inferiorly on the posterior cerebellum, and is known to be connected with the somatosensory cerebral network [45], assisting the primary motor cortex (M1) [46] in the execution and coordination of fine limb movements [47], containing, in particular, the somatomotor representations of individual left fingers [48]. This divergence between our results showing higher BOLD SD in older relative to younger adults, and findings from existing literature reporting the opposite pattern, reinforce the notion that variability-age relationships might be task-dependent [27, 31, 32, 35].
Nevertheless, given prior work from Scarapicchia et al. [31] reporting a positive relationship between white matter hyperintensities (WMH) and BOLD variability, particularly in the cerebellum, we speculate that the increase in BOLD variability we observed with aging in the left cerebellar lobule VIIIb might have a vascular or structural origin. It might as well be driven by an age-related disruption of the dopaminergic neuromodulation systems, as lower dopamine has been previously linked to greater BOLD variability, especially in subcortical structures such as the cerebellum [28, 29]. However, the current study did not examine the role of WHM nor of dopaminergic differences in BOLD variability. Hence, future research should investigate these factors as potential mechanisms underlying BOLD variability shifts with aging.
Regarding the potential behavioral relevance of these age-related differences in BOLD variability, we did not find robust evidence supporting a brain-behavior relationship in bimanual performance. This stands in contrast to prior findings in cognitive domains linking BOLD variability to performance [14, 27].
Age-group differences in the magnitude of BOLD variability modulation predict BTT performance
Our data revealed greater BOLD variability modulation across BTT conditions in older compared to younger adults within the right primary somatosensory cortex (A2), left inferior parietal lobule (A40rd) and left cerebellar lobules VIIb and VIIIb. This pattern diverges from prior findings in cognitive domains, where aging has typically been associated with reduced intra-individual brain variability [25, 33, 34], possibly reflecting domain-specific differences in how neural variability is modulated across the lifespan. The right A2 and the left A40rd support the integration of sensory input necessary to motor planning and execution [49, 50], whereas VIIb and VIIIb are implicated in the active maintenance of attentional processes and working memory [45, 47, 51, 52]. Notably, however, these were not the regions where BOLD variability modulation directly predicted bimanual task performance in the present study.
In addition to age-related differences in BOLD variability modulation, we observed region-specific relationships between BOLD variability modulation and task performance. In the left middle occipital gyrus (mOccG), greater modulation of BOLD variability was associated with better behavioral outcomes, suggesting a beneficial role of dynamic neural adaptation in visual processing [53], possibly reflecting enhanced discrimination of visual features across task condition.
In contrast, in left Crus I - a region previously implicated in higher-order cognitive processes crucial for managing the complex demands of bimanual coordination, particularly under cognitive load [4, 42, 51], such as cognitive control and working memory [34, 36, 45, 51, 52, 54–56] - higher BOLD variability modulation predicted poorer performance. One possible interpretation is that individuals who manage a broad range of motor demands more efficiently may rely on relatively stable cognitive control processes across task conditions, potentially reflecting a comparable level of automaticity [43], and consequently, reduced condition-specific modulation of variability in this region. Alternatively, increased modulation of BOLD variability in the left Crus I may be indicative of maladaptive recruitment of cognitive control processes during task execution [57]. These interpretations remain speculative and warrant confirmation in future studies specifically designed to test these relationships.
A key finding of our study is that BOLD SD modulation differentially influenced BTT performance across age groups. In younger adults, lower BOLD SD modulation in the right primary somatosensory cortex (A2), left superior parietal lobule (A7r), bilateral motion-sensitive visual areas (V5/MT+), and right cerebellar lobule VI was associated with better task outcomes. In contrast, in older adults, higher BOLD SD modulation in the left inferior and superior parietal lobules (A40rd and A7r) predicted better performance. This indicates that the neural dynamics supporting successful task execution may be age-specific, with younger and older adults recruiting and modulating distinct networks to meet task demands.
Drawing on recent literature [42, 49, 50, 57, 58], we propose that better performance in younger adults is linked to reduced BOLD variability modulation in sensorimotor and visuospatial regions because they likely possess well-established motor representations that require minimal recalibration through sensory feedback and motor planning, possibly due to greater task automatization. Conversely, in older adults, our results suggest better task performance is associated with greater adaptation of the neural dynamics in regions involved in executive control, motor attention and visuospatial integration [44, 59]. This potentially reflects the need for more active motor control in the absence of automatization. In this context, the observed increase in BOLD variability modulation across BTT conditions may represent heightened neural adaptability, enabling the dynamic integration of sensory input and top-down control processes necessary for real-time behavioral adjustments.
Existing cognitive aging models have been developed primarily based on mean BOLD activation measures, making it challenging to directly extrapolate their principles to BOLD variability findings. Nevertheless, we tentatively propose that the aforementioned age-specific shift in the relationship between brain dynamics and behavioral performance aligns with the STAC [10] and CRUNCH models [11], despite most group differences in BOLD SD modulation in the corresponding regions did not survive FDR correction (potentially due to the severity of the correction, see Figure 6). These frameworks posit that aging is accompanied by compensatory recruitment of additional higher-order neural resources to maintain task performance. Accordingly, in older adults, heightened up-regulation of BOLD SD with task complexity, particularly within the left inferior and superior parietal lobules (A40rd and A7r), may serve as a compensatory feedback-based strategy [42], potentially expressing increased reliance on visual processing and imagery [58], as well as strategic executive processes [3, 4, 7, 8, 59], to attain the same adaptive efficiency, as achieved by younger adults, through more automatized sensorimotor routines [42, 58]. Behaviorally, both age groups were similarly affected by the task conditions, strengthening our interpretation that successful adaptation to task demands is maintained through age-dependent neural strategies, characterized by specific profiles of BOLD variability modulation.
Limitations and future directions
Several limitations warrant consideration. First, the absence of direct measurements of vascular reactivity, WMH burden, or dopaminergic function limits our ability to attribute observed effects to specific physiological mechanisms. Without such data, interpretations regarding neural compensation, structural decline, or neurotransmitter shifts remain speculative.
Second, while our sample size was comparable to similar fMRI studies, the relatively small number of participants may have reduced our power to detect subtle effects, especially after correction for multiple comparisons.
Third, the use of a ROI-based approach, while justified statistically, may have masked finer-grained or network-level effects that could have emerged from a voxel-wise or connectivity-based analysis. Moreover, the choice of these regions based on activation maps may have overlooked regions where variability plays a prominent role despite minimal relevance of the average BOLD signal, given the reported orthogonality of mean and variability measures [16]. Therefore, an alternative ROI selection method, as well as whole-brain or network-level approaches should be considered in future work.
Furthermore, parametric task complexity levels were achieved by simultaneously manipulating two task components: speed of rotation and directional shift, making it difficult to determine how each is independently affected in aging, and their corresponding neural correlates. Similarly, the currently used BTT score does not allow to fully dissociate the behavioral component of speed from accuracy. Alternative BTT scoring methods may prove valuable in future research to better establish links between age-specific performance strategies and the modulation of BOLD signal variability.
Notably, although older adults exhibited greater head motion than younger adults during task performance, which can inflate BOLD SD estimation, we mitigated this unwanted effect by accounting for any post-preprocessing residual FD-related variability in our analyses, as advised by [60]. No additional correction was applied in the analyses concerning BOLD SD modulation, as these metric measures intra-individual variability across task conditions and we did not find significant differences in FD across task conditions that justified such correction. Moreover, given that FD variability might also index other confounds such as physiological noise (e.g., respiration, heart rate) [60, 61], by including it in our statistical models, we likely also minimized this source of variability. Nonetheless, although we implemented a variety of steps to control for these potential confounders, we cannot discard with full certainty the possibility of remaining residual effects on BOLD variability estimation.
Future research should aim to replicate and extend these findings by incorporating multimodal imaging techniques - such as diffusion tensor imaging, arterial spin labeling, positron emission tomography and magnetic resonance spectroscopy to better understand the vascular, structural, and neurochemical correlates of BOLD variability. Longitudinal designs will be particularly valuable in determining whether patterns of variability modulation represent dynamic states shaped by aging, experience, or intervention. Additionally, examining both cognitive and motor domains within the same participants may help clarify whether the neural dynamics of variability modulation are domain-specific or reflect broader, cross-functional signatures of aging while simultaneously shedding light onto the neural correlates of the extensively reported age-related penetration of cognition into action.
Conclusion
In sum, this study highlights the potential role of BOLD variability modulation in shaping bimanual performance during aging. While younger adults appear to benefit from neural stability, older adults may rely on dynamic modulation of variability, particularly in visuospatial and cerebellar networks, to compensate for declining efficiency. These findings complement existing neurocognitive aging theories by identifying BOLD variability modulation as a potential biomarker of neural adaptability and resilience, with relevance for maintaining sensorimotor function in later life.
Materials and Methods
Participants
The study included 22 younger healthy adults (YA; 10 males, mean ± SD [range]: age 31.27 ± 5.42 [25–40] years) and 23 older healthy adults (OA; 12 males, mean ± SD [range]: age 69.52 ± 4.15 [65–79] years), all recruited from Flanders, Belgium. Participants were recruited via social media, as well as posters and flyers placed in locations relevant to the target population, such as universities, senior homes, sports facilities, and hospitals. All participants were right-handed based on the Edinburgh Handedness Inventory Laterality Quotient (EHI LQ; mean ± SD [range]: 94.87 ± 11.03% [50-100]; cutoff score ≥ 50) [62], were fluent Dutch speakers, and had normal or corrected-to-normal eyesight. Cognitive screening was conducted using the Montreal Cognitive Assessment (MoCA; mean ± SD [range]: 28 ± 1.32 [26-30], cutoff score ≥ 26/30) [63]. Depressive symptoms were assessed using age-specific neuropsychological instruments: the Beck’s Depression Inventory – Second Edition (BDI-II; median ± interquartile range [IQR; range]: 3 ± 4.75 [0-12], cutoff score > 13/20) [64] for younger adults, and the 15-item Geriatric Depression Scale (GDS-15; median ± IQR [range]: 1 ± 1 [0-12], cutoff score > 5/15) [65] for older adults.
Exclusion criteria included self-reported neuropsychiatric disorders (e.g., epilepsy or stroke), history of brain injury or surgery, substance abuse (alcohol or drugs), regular use of psychoactive medication (e.g., antidepressants, sedatives), compromised upper limb mobility, or contraindications for magnetic resonance (MR; e.g., cardiac pacemaker, aneurysm clip, metal prosthesis, claustrophobia). Additionally, individuals with a high level of bimanual proficiency (i.e., engaging in specific bimanual tasks for more than five hours per week, as in [66]), were excluded to ensure a comparable level of bimanual skills across participants at baseline.
Prior to enrolling, participants provided written informed consent. The study protocol was approved by the Ethics Committee Research of UZ/KU Leuven (study number S66028) and complied with the ethical principles regarding research with humans stipulated in the latest amendment of the Declaration of Helsinki [67].
Experimental protocol
The experimental protocol consisted of two sessions, each of about two hours. The first session was divided into two parts: (1) a comprehensive eligibility screening using standard neuropsychological tests and questionnaires, and (2) a familiarization session with the task used in the current study to assess bimanual coordination, the Bimanual Tracking Task (BTT).
For the screening, participants completed the MoCA [63], EHI [62], BDI-II [64], GDS-15 [65], and a questionnaire assessing MRI exclusion criteria. A summary of the group average scores at each test can be found in Table 7.
Table 7. Participants’ demographics.
| Measure | Younger Adults | Older Adults | Group comparison | ||||||||||||||||||||||||||||||||||||||||||||||||||||||||||||||||||||||||||||||||||||||||||||||||
| Median | IQR | Median | IQR | W | p-value | ||||||||||||||||||||||||||||||||||||||||||||||||||||||||||||||||||||||||||||||||||||||||||||||
| MoCA (/30) | 29 | 2.00 | 29 | 2.00 | 218.5 | 0.427 | |||||||||||||||||||||||||||||||||||||||||||||||||||||||||||||||||||||||||||||||||||||||||||||
| EHI LQ (%) | 100 | 11.88 | 100 | 0 | 283 | 0.374 | |||||||||||||||||||||||||||||||||||||||||||||||||||||||||||||||||||||||||||||||||||||||||||||
| BDI-II (/63) | 3 | 4.75 | |||||||||||||||||||||||||||||||||||||||||||||||||||||||||||||||||||||||||||||||||||||||||||||||||
| GDS-15 (/15) | 1 | 1 | |||||||||||||||||||||||||||||||||||||||||||||||||||||||||||||||||||||||||||||||||||||||||||||||||
| Descriptive statistics are provided for each age group based on scores for the tests administered to attest eligibility. Given that data consistently violated the assumption of normality, medians and interquartile ranges (IQR) are reported and Wilcoxon Rank Sum tests were used. No group comparisons were performed for depressive symptoms as each age group completed a different test (BDI-II for younger adults; GDS-15 for older adults). Results indicate that the age groups did not differ in general cognition or handedness. Significance level: *** p < 0.001. | |||||||||||||||||||||||||||||||||||||||||||||||||||||||||||||||||||||||||||||||||||||||||||||||||||
| BDI-II, Beck Depression Inventory – Second Edition; EHI LQ, Edinburgh Handedness Inventory Lateralization Quotient; GDS-15, Geriatric Depression Scale – 15 Items; IQR, Interquartile Range; MoCA, Montreal Cognitive Assessment. | |||||||||||||||||||||||||||||||||||||||||||||||||||||||||||||||||||||||||||||||||||||||||||||||||||
During the familiarization session, participants practiced the BTT for eight blocks or until they reached a minimum performance score of 15% in a dummy magnetic resonance (MR) scanner. Each practice block included the same movement patterns as those later performed in the real MR scanner (i.e., Line 1:1, Line 3:1 and Angle 3:1 [left:right hand movements]; see details in section 4.4), but each condition was presented in all four possible directional combinations of dial rotation (Figure 8). This session aimed to ensure participants understood the task instructions in a simulated MRI environment and to minimize the effects of early skill learning.
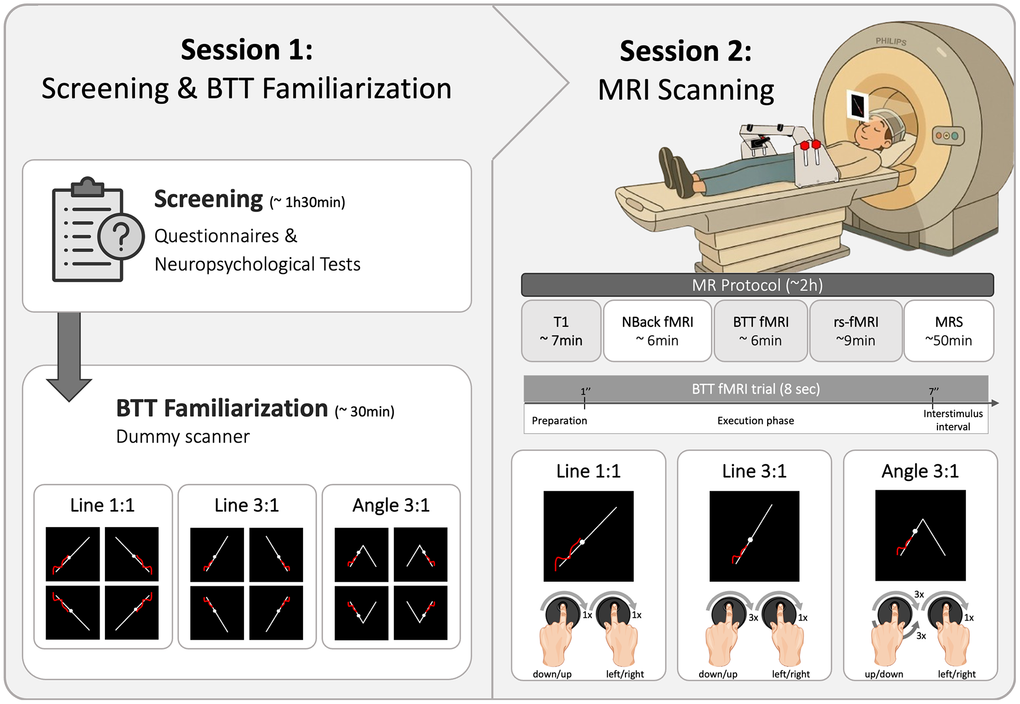
Figure 8. Experimental protocol. The figure shows the study protocol consisting of two sessions, each lasting approximately two hours. The first session included a screening and BTT familiarization in a dummy MR scanner. During this session, participants were introduced to the Bimanual Tracking Task (BTT) and performed three task conditions - Line 1:1, Line 3:1, and Angle 3:1 - in all possible directions. The task setup was placed over the participants' hips while they lay supine in the scanner. In the second session, participants underwent an MR protocol comprising several sequences. Each trial of the BTT during fMRI included a 1-second preparation phase, a 6-second execution phase, and a 1-second interstimulus interval. The same three BTT conditions were used during the fMRI scan, but only in a single direction, as shown in the figure. Abbreviations: BTT = Bimanual Tracking Task; fMRI = functional Magnetic Resonance Imaging; MR = Magnetic Resonance; MRS = Magnetic Resonance Spectroscopy; rs-fMRI = resting-state fMRI; T1 = T1-weighted.
In the second experimental session, participants completed an extensive imaging protocol consisting of a 7-minute high-resolution T1-weighted structural scan, a 9-minute resting-state functional MRI (fMRI) image, two 6-minute task-related fMRI images (namely, BTT and N-back), and several magnetic resonance spectroscopy (MRS) scans (which took approximately 50 minutes). MR data acquisition took place at the University Hospital of KU Leuven. For the current paper, only data concerning the structural and the functional BTT images were examined.
Imaging acquisition
All MRI data were collected using a Philips Achieva DStream 3-Tesla scanner equipped with a 32-channel receiver coil. Functional task-related data for the BTT were acquired using a T2*-weighted Echo Planar Imaging (EPI) sequence with the following parameters: repetition time (TR) = 1400 ms, echo time (TE) = 33 ms, flip angle = 70°, voxel size = 2.5 × 2.5 × 2.5 mm³, field of view (FOV) = 240 × 240 × 150 mm³, matrix size = 96 × 95, 60 transverse slices acquired in a sequential ascending order, SENSE/Multiband SENSE factors = 1.5/3, phase-encoding direction = posterior-anterior. A total of 258 dynamic scans were acquired, preceded by 7 dummy scans to allow for magnetic field stabilization. Additionally, high-resolution anatomical images were obtained using a T1-weighted (T1w) Magnetization Prepared Rapid Gradient Echo (MPRAGE) sequence with the following parameters: TR = 5.9 ms, TE = 2.6 ms, flip angle = 8°, voxel size = 0.8 × 0.8 × 0.8 mm³, FOV = 256 × 240 × 166.4 mm³, matrix size = 320 × 300, and 208 transverse slices.
fMRI task description
A nonferromagnetic version of the Bimanual Tracking Task (BTT) was used to assess visuomotor bimanual coordination during the task-related fMRI scan [68]. This setup, consisting of two handles and two rotational dials (5 cm diameter), was designed to be placed over the participants’ hips, allowing them to perform the task while lying supine in the MR scanner. The task was projected onto a screen positioned at the back of the scanner, and made visible to participants via a mirror (~14 × 9 cm).
BTT performance required the coordinated rotation of two dials using both index fingers, each positioned in a circular groove on the respective dial and controlling either horizontal (x-axis) or vertical movement (y-axis). The objective was to track a white target dot as it moved along a predetermined white trajectory at a constant speed. Participants’ real-time movement trajectory, generated by dial rotation, was displayed as a red line, providing concurrent performance feedback.
BTT conditions differed in inter-hand frequency ratios and/or rotational direction (i.e., clockwise or counterclockwise) of each dial, thereby varying in complexity. Frequency ratios refer to the relative speed of each index finger’s movement. In a 1:1 ratio, both fingers moved at the same speed (i.e., iso-frequency movement), whereas in a 3:1 ratio, the left finger moved three times faster than the right (i.e., non-iso-frequency movement). In this study, three task conditions were used: Line 1:1, Line 3:1, and Angle 3:1 (left:right hand movements). In “Line” conditions, both dials maintained the same rotational direction throughout the entire trial duration (clockwise in this experiment). In contrast, “Angle” conditions required a mid-trial change in the rotational direction of the dial controlling vertical movement (in this study, the left dial). These BTT conditions were chosen based on prior work from our research group that examined how different age groups coped with increasing task complexity using the same task [6, 42].
The BTT was performed during approximately six minutes in a block design. Each task condition was presented for five non-consecutive blocks (each 24 seconds), with three trials per block, totaling 45 trials (3 BTT conditions x 5 blocks x 3 trials/block = 45 trials). All trials had a constant duration of eight seconds. Each began with a 1-second preparation phase during which the target trajectory appeared on a black background, followed by a 6-second movement phase where the white dot moved along the target trajectory, and ended with a 1-second inter-trial interval (see Figure 8). The BTT conditions were presented in a fixed order for each participant but varied across participants in a pseudorandomized manner.
Behavioral outcome measure
Participant performance on the BTT was expressed in a percentage, with 100 % indicating perfect accuracy. The final BTT score (S) was derived from the multiplication of two key components (S = P × D): a preliminary score (P) reflecting movement accuracy and a distance correction factor (D) accounting for deviations from the target trajectory.
The preliminary score (P), calculated as described in [41], resulted from dividing the proportion of unique target points successfully covered in the correct order during the participant’s movement trajectory, by the total number of points forming the target trajectory, all multiplied by 100. These unique target points corresponded to those with the minimal Euclidean distance from the actual movement path, considering a sampling rate of 100 Hz (i.e., every 10 ms; see Figure 1D in [41]). Hence, a higher P value indicated greater accuracy in following the intended path. However, a limitation of this method was that it did not distinguish between movements that closely follow the target trajectory and those that are parallel to it.
To penalize movement trajectories parallel to the target trajectory over closely following it, a correction factor (D) was applied as previously done in studies from our research group [66, 69]. This factor adjusted the preliminary score based on the average distance () between the actual movement path and the target trajectory throughout a trial. The correction was implemented using the formula:
Unlike prior studies in which the scaling factor (N) was set to 5 [66, 69], in this study it was adjusted to 8 to better account for performance variability across different age groups. This adjusted N was determined by analyzing unpublished independent BTT data from our research group with a similar set of participants, and aimed to mitigate floor and ceiling effects, ensuring a more accurate assessment of skill differences.
Imaging preprocessing
Following acquisition, all MRI data were converted to BIDS format and preprocessed at the individual level using fMRIPrep 24.0.01 [70, 71], a robust and standardized preprocessing pipeline implemented in Nipype 1.8.6 [72]. The structural T1-weighted (T1w) image was first corrected for intensity non-uniformity (INU) using ANTs 2.5.1 (Advanced Normalization Tools) [73] and subsequently used as the T1w reference. Skull-stripping was performed using ANTs, and the image was segmented into cerebrospinal fluid (CSF), white matter (WM), and gray matter (GM) using FAST from FSL 6.0.5.2 (FMRIB Software Library) [74]. FreeSurfer 7.3.2 [75] was then used to reconstruct brain surfaces. The T1w image was normalized to MNI152NLin2009cAsym space with an isotropic resolution of 2 mm using nonlinear registration with ANTs, utilizing the brain-extracted versions of both the T1w reference and the T1w template.
Functional image preprocessing began with motion correction of BOLD volumes using MCFLIRT [76] from FSL with a reference BOLD image. Susceptibility distortion correction was performed using a fieldmap-less distortion approach (i.e., SyN correction) [77], in which deformation fields were estimated by co-registering the EPI reference to the same-subject T1w reference with its intensity inverted. Functional images were then corrected for slice timing differences with 3DTshift from AFNI 24.1.22 (Analysis of Functional NeuroImages) [78], and the structural and functional images were co-registered using FreeSurfer with boundary-based registration (BBR) [79], which was implemented with 12 degrees of freedom. To address noise and confounding signals, nuisance regressors, including framewise displacement (FD; a measure of frame-to-frame head movement determined from the realignment estimates), DVARS (i.e., spatial standard deviation of the data after temporal differing), and global signals from WM and CSF, were identified using CompCor [80] and Nilearn [81].
After implementing the standard preprocessing steps in fMRIPrep, further temporal denoising was performed using the Denoiser Toolbox (https://github.com/arielletambini/denoiser). This process of temporal detrending involved regressing out the WM and CSF signals, as well as the three translational (trans_x, trans_y, trans_z) and three rotational (rot_x, rot_y, rot_z) head-movement parameters and their temporal derivatives. High-pass filtering was applied to the functional data with a cutoff of 0.006 Hz (~167 seconds) in the BTT fMRI. Finally, spatial smoothing was performed in SPM12 [82] with MATLAB R2022a (version 9.12.0.2009381) [83], using a Gaussian kernel of 6 mm full width at half maximum (FWHM).
Brain variability measure
After preprocessing, a whole-brain detrended standard deviation map of the BOLD series (BOLD SD) was computed for each BTT condition (i.e., Line 1:1, Line 3:1, and Angle 3:1) and for the total 9-minute rest scan using the Variability Toolbox (VarTbx; https://github.com/LNDG/vartbx) in SPM12 [82]. An additional whole brain BOLD SD map containing the absolute magnitude of change in BOLD SD across BTT conditions (whereafter referred to as BOLD SD modulation) was posteriorly generated by calculating, per voxel, the sum of the absolute differences in BOLD SD between the different task conditions, as described in the following mathematical formula:
Hence, this composite, between task condition measure was intended to capture the overall amount of change in BOLD SD across all BTT conditions, irrespective of direction (i.e., increase or decreases in BOLD SD). An illustrative example on how to calculate BOLD SD modulation considering the provided formula can be visualized on Supplementary Figure 1.
In this study, a region-of-interest (ROI)-based approach was chosen over a voxel-wise approach for all statistical analyses given the limited number of subjects per age group (i.e., 22 young adults and 23 older adults). In total, 25 ROIs were analyzed. These regions, listed in Table 4 and displayed in Figure 9, were selected based on a preliminary analysis in FSL, which examined brain activation during BTT performance using independent data from a similar study conducted by our research group. In particular, the included ROIs correspond to local maxima at least 8 mm apart, present in clusters of 10 or more significant voxels after applying a threshold of Z > 5.5 to the contrast Z-maps “Line 3:1 > Line 1:1” and “Angle 3:1 > Line 3:1” (even though no local maxima were found for the contrast map “Line 3:1 > Line 1:1”; thus, consult Table 4 for the coordinates of each local maxima found for the contrast “Angle 3:1 > Line 3:1”). To label the brain regions corresponding to the peak activation coordinates, two widely recognized atlases were used: the Brainnetome Atlas [38] for cortical regions, and the SUIT atlas [39] for cerebellar regions. Subsequently, masks derived from these atlases were created in the same T1w template space and isotropic resolution of 2 mm3 as the preprocessed functional images. The resulting masks were applied to the BOLD SD brain maps previously generated per task condition using MATLAB R2022a (version 9.12.0.2009381). For each of these BOLD SD maps, a mean BOLD SD value was extracted per ROI by averaging the BOLD SD across all voxels within the masked regions. Similarly, a mean value of BOLD SD modulation was calculated for each ROI.
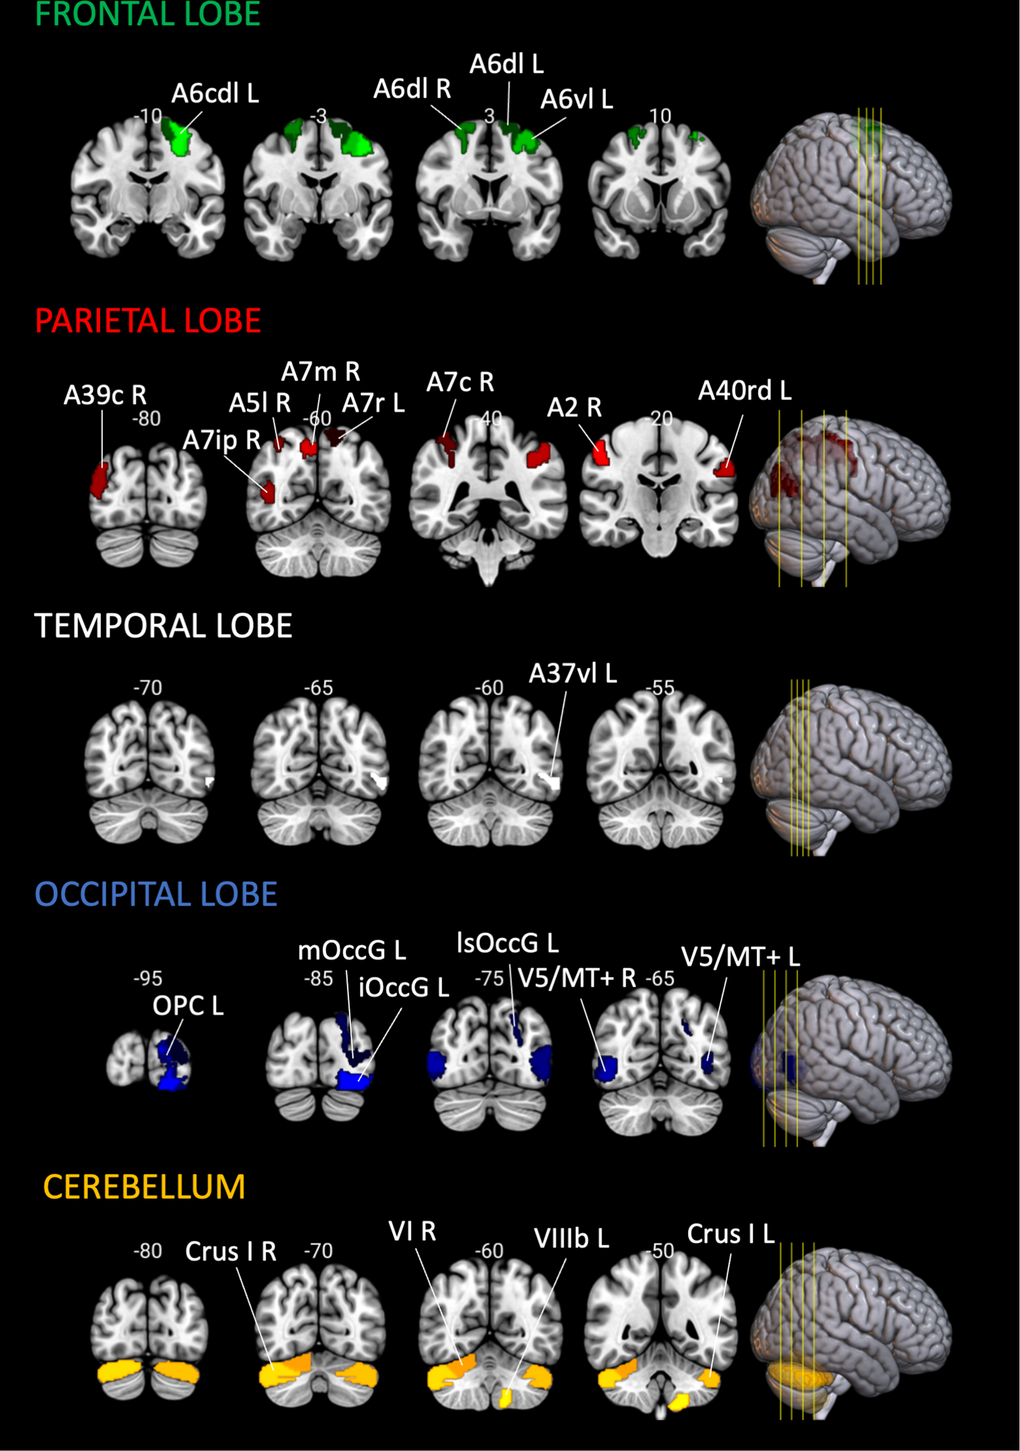
Figure 9. Location of the brain regions analyzed. Brain regions analyzed, visualized in the coronal plane, in the MNI152 Template. Cortical regions were labeled using the Brainnetome Atlas [38], and cerebellar regions with Cerebellum SUIT Atlas [39]. Brain slices and volumes depicted in this figure were created with MRIcroGL (Version 1.2.20220720b; https://www.nitrc.org/projects/mricrogl) [37].
Statistical analyses
All statistical tests were conducted in R (version 4.4.2) [84], with the significance threshold (α) set at 0.05 unless stated otherwise. Prior to analysis, normality was assessed using the Shapiro-Wilk test for the data, and by visually inspecting quantile–quantile (Q-Q) plots for the model residuals. Homoscedasticity was examined using residual-by-predicted plots.
For Linear Mixed Models (LMMs) and Multiple Linear Regressions, model simplification followed a stepwise backward elimination approach, where non-significant terms were sequentially removed, unless they were part of a significant interaction. The significance of model terms was assessed using Type III analysis of variance (ANOVA). When appropriate, post hoc Tukey Honestly Significant Difference tests were performed. Moreover, before running the statistical models, per ROI, datapoints of BOLD SD or BOLD SD modulation more than three standard deviations from the mean were excluded.
To control for Type I error in region-of-interest (ROI) analyses involving multiple comparisons, false discovery rate (FDR) correction was applied using the Benjamini -Hochberg (BH) [85] procedure, with q < 0.05 (FDR threshold; q-values are FDR-adjusted p-values).
Behavioral data
Effect of age group and task condition on BTT performance
BTT behavioral data were recorded and processed online with LabVIEW 8.5 [86]. Subsequent offline data processing was carried out using custom in-house MATLAB scripts (R2023b version 23.2.0.2365128).
To examine differences in BTT score across age groups and task conditions, a 2x3 Mixed Model ANOVA was implemented, with AGE GROUP as a between-subject factor with 2 levels (Younger Adults and Older Adults), TASK CONDITON as within-subjects factor with three levels (Line11, Line31 and Angle31) and BTT SCORE as dependent variable.
Neuroimaging data
Effect of age group and task condition on framewise displacement
Studies such as [60] have shown that BOLD signal remains positively associated with head motion parameters, even after standard denoising steps. Moreover, based on previous research, we expected older adults to exhibit higher average framewise displacement (FD) and anticipated that different task conditions would elicit varying levels of movement-related artifacts. Therefore, to assess the confounding effect of FD on BOLD SD estimations during BTT performance, we tested for FD differences across age groups (younger vs. older adults) and task conditions (Line 1:1, Line 3:1, Angle 3:1) using an Aligned Rank Transform (ART) factorial ANOVA (“ARTool” package) [87], as data did not meet required assumptions to implement an equivalent parametric approach.
Age-group differences in BOLD variability and BOLD variability modulation during BTT performance
Effect of age group and task condition on BOLD variability
To determine how BOLD SD varies by age group and task condition during BTT performance in the selected ROIs, we conducted 25 separate LMMs - one per region - using the “lme4” and “car” R packages [88, 89]. TASK CONDITION (with three levels: Line11, Line31 and Angle31) was included as a within-subjects fixed effect, while AGE GROUP (with two levels: Younger Adults and Older Adults) was treated as a between-subjects fixed effect. In addition, we included in the model the AGE GROUP x TASK CONDITION interaction term, and BOLD SD as the dependent variable. To account for repeated measures, “SUBJECT ID” was modeled as a random intercept, and mean framewise displacement per BTT condition (FRAMEWISE DISPLACEMENT) was included as a covariate of no interest to control for motion-related artifacts in BOLD SD. Thus, the initial model for each ROI was specified in R as: BOLD SD ~ AGE GROUP + TASK CONDITION + AGE GROUP X TASK CONDITION + FRAMEWISE DISPLACEMENT + (1|SUBJECT ID).
When necessary to meet LMM assumptions, BOLD SD was transformed using the Box-Cox transformation (“car” package) [89].
Age-group differences in BOLD variability modulation
For each of the 25 ROIs tested in the previous analysis, we additionally examined age-group differences in BOLD SD modulation. Depending on whether the assumptions of normality and homoscedasticity were met, a T-test or a Wilcoxon Rank-Sum Test was employed per brain region. Effect sizes were estimated using Cohen’s d or rank-biserial correlations, depending on whether parametric or non-parametric tests were used for the corresponding age-group comparison.
Impact of age-group differences in BOLD variability and BOLD variability modulation on BTT performance
To increase statistical power, the following analyses concerning the brain-behavioral relationship between BOLD variability measures (i.e., BOLD SD and BOLD SD modulation) and BTT performance only included brain regions among the initial 25 selected ROIs that presented significant results before multiple comparisons in any of the analyses previously conducted. Therefore, 16 regions (highlighted in bold, in Table 4) were analyzed.
Effect of BOLD variability differences in age groups and task conditions on BTT performance
A key objective of this study was to examine whether age-group differences in BOLD SD and changes in BOLD SD across different BTT conditions with increasing complexity are associated with BTT performance.
To account for motion-related variability in BOLD SD that might have persisted after denoising during preprocessing, we regressed out mean FD from BOLD SD without centering data around zero (by re-adding the intercept, preserving the original data scale), creating a new variable: BOLD SDREGRESSED (datawizard package) [90]. Posteriorly, per ROI, we conducted the following LMM: BTT SCORE ~ BOLD SDREGRESSED + TASK CONDITION + AGE GROUP + BOLD SDREGRESSED X TASK CONDITION + BOLD SDREGRESSED X AGE GROUP + (1|SUBJECT ID). This means that BOLD SDREGRESSED, TASK CONDITON (with three level: Line11, Line31 and Angle31), their interaction (namely, BOLD SD X TASK CONDITION), AGE GROUP (with two levels: Younger Adults and Older Adults), as well as the interaction BOLD SDREGRESSED X AGE GROUP, were included as fixed effects, and SUBJECT ID as random intercept.
Effect of age-group differences in BOLD variability modulation on BTT performance
In parallel, for the same 16 ROIs, we also performed a Multiple Linear Regression separately for each ROI to study how the effect of aging on BOLD SD modulation impacts overall BTT performance. Therefore, MEAN BTT SCORE was modeled as a function of BOLD SD MODULATION (check section 4.4 to see how it was calculated), AGE GROUP (with two levels: Younger Adults and Older Adults) and the interaction BOLD SD MODULATION x AGE GROUP. This resulted in the following model: MEAN BTT SCORE ~ BOLD SD MODULATION + AGE GROUP + BOLD SD MODULATION X AGE GROUP.
For ROIs in which residuals were non-normally distributed and/or heteroscedastic, even after data transformation, we employed residuals bootstrapping to obtain more robust coefficients estimates (using “boot” package). This non-parametric method generated 20,000 bootstrap samples by resampling residuals from the original model and adding them back to fitted values. The regression was re-estimated for each sample, and 95% confidence intervals for coefficients were derived from the 2.5th and 97.5th percentiles of the bootstrap distribution. Regressors with confidence intervals excluding zero were considered significantly associated with MEAN BTT SCORE.
Furthermore, upon an interaction effect that remained significant after correction for multiple comparisons, the simple linear regression “MEAN BTT Score ~ BOLD SD MODULATION” was conducted post hoc per age group to examine how the two variables relate in each age group. Once more, when data violated the assumptions of normality and/or homoscedasticity, residuals bootstrapping was performed in the same way as before to determine robust coefficient estimates and compare results from both analyses. P-values from the simple regression were corrected with FDR with significance set at q < 0.05.
Supplementary Materials
Author Contributions
S.M.F.: Conceptualization, Methodology, Investigation, Formal analysis, Writing - Original Draft, Visualization. M.B.: Methodology, Investigation, Writing - Review & Editing. J.F.: Methodology, Investigation, Writing - Review & Editing. R.M.: Methodology, Resources, Writing - Review & Editing. S.P.S.: Resources, Writing - Review & Editing. K.C.: Supervision, Resources, Writing - Review & Editing.
Acknowledgements
The authors are immensely grateful to Engineer Marc Geraerts for developing the nonferromagnetic version of the Bimanual Tracking Task (BTT) used to acquire the task-related fMRI data, and for all the technical support provided throughout all data acquisition.
Conflicts of Interest
The authors declare that they have no conflicts of interest.
Ethical Statement and Consent
The Ethics Committee Research of UZ/KU Leuven approved the study protocol (study number S66028). All participants provided written informed consent prior to their inclusion in the study.
Funding
The study is a part of the FWO Senior Research Project G039821N. This study was supported by the Research Foundation Flanders grant SRN W001325N.MB was funded by a FWO PhD fellowship G1155025N and the additional BOF bench fee BOF24INCENT16.
References
- 1. Swinnen SP, Wenderoth N. Two hands, one brain: cognitive neuroscience of bimanual skill. Trends Cogn Sci. 2004; 8:18–25. https://doi.org/10.1016/j.tics.2003.10.017 [PubMed]
- 2. Swinnen SP. Intermanual coordination: from behavioural principles to neural-network interactions. Nat Rev Neurosci. 2002; 3:348–59. https://doi.org/10.1038/nrn807 [PubMed]
- 3. Seidler RD, Bernard JA, Burutolu TB, Fling BW, Gordon MT, Gwin JT, Kwak Y, Lipps DB. Motor control and aging: links to age-related brain structural, functional, and biochemical effects. Neurosci Biobehav Rev. 2010; 34:721–33. https://doi.org/10.1016/j.neubiorev.2009.10.005 [PubMed]
- 4. Seer C, Sidlauskaite J, Lange F, Rodríguez-Nieto G, Swinnen SP. Cognition and action: a latent variable approach to study contributions of executive functions to motor control in older adults. Aging (Albany NY). 2021; 13:15942–63. https://doi.org/10.18632/aging.203239 [PubMed]
- 5. Swinnen SP. AGE-RELATED DEFICITS IN MOTOR LEARNING AND DIFFERENCES IN FEEDBACK PROCESSING DURING THE PRODUCTION OF A BIMANUAL COORDINATION PATTERN. Cogn Neuropsychol. 1998; 15:439–66. https://doi.org/10.1080/026432998381104 [PubMed]
- 6. Monteiro TS, Zivari Adab H, Chalavi S, Gooijers J, King BB, Cuypers K, Mantini D, Swinnen SP. Reduced Modulation of Task-Related Connectivity Mediates Age-Related Declines in Bimanual Performance. Cereb Cortex. 2020; 30:4346–60. https://doi.org/10.1093/cercor/bhaa021 [PubMed]
- 7. Goble DJ, Coxon JP, Van Impe A, De Vos J, Wenderoth N, Swinnen SP. The neural control of bimanual movements in the elderly: Brain regions exhibiting age-related increases in activity, frequency-induced neural modulation, and task-specific compensatory recruitment. Hum Brain Mapp. 2010; 31:1281–95. https://doi.org/10.1002/hbm.20943 [PubMed]
- 8. Heuninckx S, Wenderoth N, Swinnen SP. Systems neuroplasticity in the aging brain: recruiting additional neural resources for successful motor performance in elderly persons. J Neurosci. 2008; 28:91–9. https://doi.org/10.1523/JNEUROSCI.3300-07.2008 [PubMed]
- 9. Li S-C, Lindenberger U. Cross-level unification: A computational exploration of the link between deterioration of neurotransmitter systems and dedifferentiation of cognitive abilities in old age. Cognitive neuroscience of memory. Hogrefe & Huber; 1999:103–46.
- 10. Park DC, Reuter-Lorenz P. The adaptive brain: aging and neurocognitive scaffolding. Annu Rev Psychol. 2009; 60:173–96. https://doi.org/10.1146/annurev.psych.59.103006.093656 [PubMed]
- 11. Reuter-Lorenz PA, Cappell KA. Neurocognitive Aging and the Compensation Hypothesis. Curr Dir Psychol Sci. 2008; 17:177–82. https://doi.org/10.1111/j.1467-8721.2008.00570.x
- 12. Uddin LQ. Bring the Noise: Reconceptualizing Spontaneous Neural Activity. Trends Cogn Sci. 2020; 24:734–46. https://doi.org/10.1016/j.tics.2020.06.003 [PubMed]
- 13. Cohen MR, Maunsell JH. Attention improves performance primarily by reducing interneuronal correlations. Nat Neurosci. 2009; 12:1594–600. https://doi.org/10.1038/nn.2439 [PubMed]
- 14. Garrett DD, Kovacevic N, McIntosh AR, Grady CL. Blood oxygen level-dependent signal variability is more than just noise. J Neurosci. 2010; 30:4914–21. https://doi.org/10.1523/JNEUROSCI.5166-09.2010 [PubMed]
- 15. Garrett DD, Kovacevic N, McIntosh AR, Grady CL. The importance of being variable. J Neurosci. 2011; 31:4496–503. https://doi.org/10.1523/JNEUROSCI.5641-10.2011 [PubMed]
- 16. Garrett DD, Samanez-Larkin GR, MacDonald SW, Lindenberger U, McIntosh AR, Grady CL. Moment-to-moment brain signal variability: a next frontier in human brain mapping? Neurosci Biobehav Rev. 2013; 37:610–24. https://doi.org/10.1016/j.neubiorev.2013.02.015 [PubMed]
- 17. Garrett DD, McIntosh AR, Grady CL. Brain signal variability is parametrically modifiable. Cereb Cortex. 2014; 24:2931–40. https://doi.org/10.1093/cercor/bht150 [PubMed]
- 18. Waschke L, Kloosterman NA, Obleser J, Garrett DD. Behavior needs neural variability. Neuron. 2021; 109:751–66. https://doi.org/10.1016/j.neuron.2021.01.023 [PubMed]
- 19. Shew WL, Yang H, Petermann T, Roy R, Plenz D. Neuronal avalanches imply maximum dynamic range in cortical networks at criticality. J Neurosci. 2009; 29:15595–600. https://doi.org/10.1523/JNEUROSCI.3864-09.2009 [PubMed]
- 20. Shew WL, Yang H, Yu S, Roy R, Plenz D. Information capacity and transmission are maximized in balanced cortical networks with neuronal avalanches. J Neurosci. 2011; 31:55–63. https://doi.org/10.1523/JNEUROSCI.4637-10.2011 [PubMed]
- 21. Tsvetanov KA, Henson RN, Rowe JB. Separating vascular and neuronal effects of age on fMRI BOLD signals. Philos Trans R Soc Lond B Biol Sci. 2021; 376:20190631. https://doi.org/10.1098/rstb.2019.0631 [PubMed]
- 22. Tsvetanov KA, Henson RN, Jones PS, Mutsaerts H, Fuhrmann D, Tyler LK, Rowe JB, and Cam-CAN. The effects of age on resting-state BOLD signal variability is explained by cardiovascular and cerebrovascular factors. Psychophysiology. 2021; 58:e13714. https://doi.org/10.1111/psyp.13714 [PubMed]
- 23. Lippe S. Differential maturation of brain signal complexity in the human auditory and visual system. Front Hum Neurosci [Internet]. 2009. Available from: http://journal.frontiersin.org/article/10.3389/neuro.09.048.2009/abstract.
- 24. Misić B, Mills T, Taylor MJ, McIntosh AR. Brain noise is task dependent and region specific. J Neurophysiol. 2010; 104:2667–76. https://doi.org/10.1152/jn.00648.2010 [PubMed]
- 25. Steinberg SN, King TZ. Within-Individual BOLD Signal Variability and its Implications for Task-Based Cognition: A Systematic Review. Neuropsychol Rev. 2024; 34:1115–64. https://doi.org/10.1007/s11065-023-09619-x [PubMed]
- 26. Garrett DD, Epp SM, Perry A, Lindenberger U. Local temporal variability reflects functional integration in the human brain. Neuroimage. 2018; 183:776–87. https://doi.org/10.1016/j.neuroimage.2018.08.019 [PubMed]
- 27. Boylan MA, Foster CM, Pongpipat EE, Webb CE, Rodrigue KM, Kennedy KM. Greater BOLD Variability is Associated With Poorer Cognitive Function in an Adult Lifespan Sample. Cereb Cortex. 2021; 31:562–74. https://doi.org/10.1093/cercor/bhaa243 [PubMed]
- 28. Guitart-Masip M, Salami A, Garrett D, Rieckmann A, Lindenberger U, Bäckman L. BOLD Variability is Related to Dopaminergic Neurotransmission and Cognitive Aging. Cereb Cortex. 2016; 26:2074–83. https://doi.org/10.1093/cercor/bhv029 [PubMed]
- 29. Karrer TM, Josef AK, Mata R, Morris ED, Samanez-Larkin GR. Reduced dopamine receptors and transporters but not synthesis capacity in normal aging adults: a meta-analysis. Neurobiol Aging. 2017; 57:36–46. https://doi.org/10.1016/j.neurobiolaging.2017.05.006 [PubMed]
- 30. Pur DR, Eagleson RA, de Ribaupierre A, Mella N, de Ribaupierre S. Moderating Effect of Cortical Thickness on BOLD Signal Variability Age-Related Changes. Front Aging Neurosci. 2019; 11:46. https://doi.org/10.3389/fnagi.2019.00046 [PubMed]
- 31. Scarapicchia V, Mazerolle EL, Fisk JD, Ritchie LJ, Gawryluk JR. Resting State BOLD Variability in Alzheimer's Disease: A Marker of Cognitive Decline or Cerebrovascular Status? Front Aging Neurosci. 2018; 10:39. https://doi.org/10.3389/fnagi.2018.00039 [PubMed]
- 32. Scarapicchia V, Garcia-Barrera M, MacDonald S, Gawryluk JR. Resting State BOLD Variability Is Linked to White Matter Vascular Burden in Healthy Aging but Not in Older Adults With Subjective Cognitive Decline. Front Hum Neurosci. 2019; 13:429. https://doi.org/10.3389/fnhum.2019.00429 [PubMed]
- 33. Garrett DD, Kovacevic N, McIntosh AR, Grady CL. The modulation of BOLD variability between cognitive states varies by age and Cognitive Performance. Cereb Cortex. 2013; 23:684–93. https://doi.org/10.1093/cercor/bhs055 [PubMed]
- 34. Rieck JR, DeSouza B, Baracchini G, Grady CL. Reduced modulation of BOLD variability as a function of cognitive load in healthy aging. Neurobiol Aging. 2022; 112:215–30. https://doi.org/10.1016/j.neurobiolaging.2022.01.010 [PubMed]
- 35. Armbruster-Genç DJ, Ueltzhöffer K, Fiebach CJ. Brain Signal Variability Differentially Affects Cognitive Flexibility and Cognitive Stability. J Neurosci. 2016; 36:3978–87. https://doi.org/10.1523/JNEUROSCI.2517-14.2016 [PubMed]
- 36. Grady CL, Garrett DD. Brain signal variability is modulated as a function of internal and external demand in younger and older adults. Neuroimage. 2018; 169:510–23. https://doi.org/10.1016/j.neuroimage.2017.12.031 [PubMed]
- 37. Rorden C. MRIcroGL [Internet]. 2017. Available from: https://www.nitrc.org/projects/mricrogl/.
- 38. Fan L, Li H, Zhuo J, Zhang Y, Wang J, Chen L, Yang Z, Chu C, Xie S, Laird AR, Fox PT, Eickhoff SB, Yu C, Jiang T. The Human Brainnetome Atlas: A New Brain Atlas Based on Connectional Architecture. Cereb Cortex. 2016; 26:3508–26. https://doi.org/10.1093/cercor/bhw157 [PubMed]
- 39. Diedrichsen J, Balsters JH, Flavell J, Cussans E, Ramnani N. A probabilistic MR atlas of the human cerebellum. Neuroimage. 2009; 46:39–46. https://doi.org/10.1016/j.neuroimage.2009.01.045 [PubMed]
- 40. Monteiro TS, King BR, Seer C, Mantini D, Swinnen SP. Network-specific differences in transient brain activity at rest are associated with age-related reductions in motor performance. Neuroimage. 2022; 252:119025. https://doi.org/10.1016/j.neuroimage.2022.119025 [PubMed]
- 41. Zivari Adab H, Chalavi S, Monteiro TS, Gooijers J, Dhollander T, Mantini D, Swinnen SP. Fiber-specific variations in anterior transcallosal white matter structure contribute to age-related differences in motor performance. Neuroimage. 2020; 209:116530. https://doi.org/10.1016/j.neuroimage.2020.116530 [PubMed]
- 42. Van Ruitenbeek P, Santos Monteiro T, Chalavi S, King BR, Cuypers K, Sunaert S, Peeters R, Swinnen SP. Interactions between the aging brain and motor task complexity across the lifespan: balancing brain activity resource demand and supply. Cereb Cortex. 2023; 33:6420–34. https://doi.org/10.1093/cercor/bhac514 [PubMed]
- 43. Maes C, Swinnen SP, Albouy G, Sunaert S, Gooijers J, Chalavi S, Pauwels L. The role of the PMd in task complexity: functional connectivity is modulated by motor learning and age. Neurobiol Aging. 2020; 92:12–27. https://doi.org/10.1016/j.neurobiolaging.2020.03.016 [PubMed]
- 44. Maes C, Gooijers J, Orban de Xivry JJ, Swinnen SP, Boisgontier MP. Two hands, one brain, and aging. Neurosci Biobehav Rev. 2017; 75:234–56. https://doi.org/10.1016/j.neubiorev.2017.01.052 [PubMed]
- 45. Buckner RL, Krienen FM, Castellanos A, Diaz JC, Yeo BT. The organization of the human cerebellum estimated by intrinsic functional connectivity. J Neurophysiol. 2011; 106:2322–45. https://doi.org/10.1152/jn.00339.2011 [PubMed]
- 46. Kelly RM, Strick PL. Cerebellar loops with motor cortex and prefrontal cortex of a nonhuman primate. J Neurosci. 2003; 23:8432–44. https://doi.org/10.1523/JNEUROSCI.23-23-08432.2003 [PubMed]
- 47. Diedrichsen J, King M, Hernandez-Castillo C, Sereno M, Ivry RB. Universal Transform or Multiple Functionality? Understanding the Contribution of the Human Cerebellum across Task Domains. Neuron. 2019; 102:918–28. https://doi.org/10.1016/j.neuron.2019.04.021 [PubMed]
- 48. Wiestler T, McGonigle DJ, Diedrichsen J. Integration of sensory and motor representations of single fingers in the human cerebellum. J Neurophysiol. 2011; 105:3042–53. https://doi.org/10.1152/jn.00106.2011 [PubMed]
- 49. Fogassi L, Luppino G. Motor functions of the parietal lobe. Curr Opin Neurobiol. 2005; 15:626–31. https://doi.org/10.1016/j.conb.2005.10.015 [PubMed]
- 50. Whittier TT, Patrick CM, Fling BW. Somatosensory Information in Skilled Motor Performance: A Narrative Review. J Mot Behav. 2023; 55:453–74. https://doi.org/10.1080/00222895.2023.2213198 [PubMed]
- 51. Stoodley CJ. The cerebellum and cognition: evidence from functional imaging studies. Cerebellum. 2012; 11:352–65. https://doi.org/10.1007/s12311-011-0260-7 [PubMed]
- 52. Stoodley CJ, Valera EM, Schmahmann JD. Functional topography of the cerebellum for motor and cognitive tasks: an fMRI study. Neuroimage. 2012; 59:1560–70. https://doi.org/10.1016/j.neuroimage.2011.08.065 [PubMed]
- 53. Frässle S, Manjaly ZM, Do CT, Kasper L, Pruessmann KP, Stephan KE. Whole-brain estimates of directed connectivity for human connectomics. Neuroimage. 2021; 225:117491. https://doi.org/10.1016/j.neuroimage.2020.117491 [PubMed]
- 54. Beets IA, Gooijers J, Boisgontier MP, Pauwels L, Coxon JP, Wittenberg G, Swinnen SP. Reduced Neural Differentiation Between Feedback Conditions After Bimanual Coordination Training with and without Augmented Visual Feedback. Cereb Cortex. 2015; 25:1958–69. https://doi.org/10.1093/cercor/bhu005 [PubMed]
- 55. Kennedy KM, Boylan MA, Rieck JR, Foster CM, Rodrigue KM. Dynamic range in BOLD modulation: lifespan aging trajectories and association with performance. Neurobiol Aging. 2017; 60:153–63. https://doi.org/10.1016/j.neurobiolaging.2017.08.027 [PubMed]
- 56. Shomstein S. Cognitive functions of the posterior parietal cortex: top-down and bottom-up attentional control. Front Integr Neurosci. 2012; 6:38. https://doi.org/10.3389/fnint.2012.00038 [PubMed]
- 57. Balsters JH, Laird AR, Fox PT, Eickhoff SB. Bridging the gap between functional and anatomical features of cortico-cerebellar circuits using meta-analytic connectivity modeling. Hum Brain Mapp. 2014; 35:3152–69. https://doi.org/10.1002/hbm.22392 [PubMed]
- 58. Zapparoli L, Mariano M, Paulesu E. How the motor system copes with aging: a quantitative meta-analysis of the effect of aging on motor function control. Commun Biol. 2022; 5:79. https://doi.org/10.1038/s42003-022-03027-2 [PubMed]
- 59. Santos Monteiro T, Beets IA, Boisgontier MP, Gooijers J, Pauwels L, Chalavi S, King B, Albouy G, Swinnen SP. Relative cortico-subcortical shift in brain activity but preserved training-induced neural modulation in older adults during bimanual motor learning. Neurobiol Aging. 2017; 58:54–67. https://doi.org/10.1016/j.neurobiolaging.2017.06.004 [PubMed]
- 60. Power JD, Plitt M, Laumann TO, Martin A. Sources and implications of whole-brain fMRI signals in humans. Neuroimage. 2017; 146:609–25. https://doi.org/10.1016/j.neuroimage.2016.09.038 [PubMed]
- 61. Power JD, Mitra A, Laumann TO, Snyder AZ, Schlaggar BL, Petersen SE. Methods to detect, characterize, and remove motion artifact in resting state fMRI. Neuroimage. 2014; 84:320–41. https://doi.org/10.1016/j.neuroimage.2013.08.048 [PubMed]
- 62. Oldfield RC. The assessment and analysis of handedness: the Edinburgh inventory. Neuropsychologia. 1971; 9:97–113. https://doi.org/10.1016/0028-3932(71)90067-4 [PubMed]
- 63. Nasreddine ZS, Phillips NA, Bédirian V, Charbonneau S, Whitehead V, Collin I, Cummings JL, Chertkow H. The Montreal Cognitive Assessment, MoCA: a brief screening tool for mild cognitive impairment. J Am Geriatr Soc. 2005; 53:695–9. https://doi.org/10.1111/j.1532-5415.2005.53221.x [PubMed]
- 64. Beck AT, Ward CH, Mendelson M, Mock J, Erbaugh J. An inventory for measuring depression. Arch Gen Psychiatry. 1961; 4:561–71. https://doi.org/10.1001/archpsyc.1961.01710120031004 [PubMed]
- 65. Sheikh JI, Yesavage JA. Geriatric Depression Scale (GDS): recent evidence and development of a shorter version. Clinical gerontology. Routledge; 2014:165–73.
- 66. Hehl M, Malderen SV, Blashchuk S, Sunaert S, Edden RA, Swinnen SP, Cuypers K. The Reciprocal Relationship Between Short- and Long-Term Motor Learning and Neurometabolites. Hum Brain Mapp. 2025; 46:e70170. https://doi.org/10.1002/hbm.70170 [PubMed]
- 67. World Medical Association. World Medical Association Declaration of Helsinki: ethical principles for medical research involving human subjects. JAMA. 2013; 310:2191–4. https://doi.org/10.1001/jama.2013.281053 [PubMed]
- 68. Sisti HM, Geurts M, Clerckx R, Gooijers J, Coxon JP, Heitger MH, Caeyenberghs K, Beets IA, Serbruyns L, Swinnen SP. Testing multiple coordination constraints with a novel bimanual visuomotor task. PLoS One. 2011; 6:e23619. https://doi.org/10.1371/journal.pone.0023619 [PubMed]
- 69. Van Malderen S, Hehl M, Nuyts M, Verstraelen S, Heemels RE, Hardwick RM, Swinnen SP, Cuypers K. Age-related differences in task-related modulation of cerebellar brain inhibition. Neurobiol Aging. 2025; 150:53–68. https://doi.org/10.1016/j.neurobiolaging.2025.02.009 [PubMed]
- 70. Esteban O, Markiewicz CJ, Blair RW, Moodie CA, Isik AI, Erramuzpe A, Kent JD, Goncalves M, DuPre E, Snyder M, Oya H, Ghosh SS, Wright J, et al. fMRIPrep: a robust preprocessing pipeline for functional MRI. Nat Methods. 2019; 16:111–16. https://doi.org/10.1038/s41592-018-0235-4 [PubMed]
- 71. Esteban O, Ciric R, Finc K, Blair RW, Markiewicz CJ, Moodie CA, Kent JD, Goncalves M, DuPre E, Gomez DE, Ye Z, Salo T, Valabregue R, et al. Analysis of task-based functional MRI data preprocessed with fMRIPrep. Nat Protoc. 2020; 15:2186–202. https://doi.org/10.1038/s41596-020-0327-3 [PubMed]
- 72. Gorgolewski K, Burns CD, Madison C, Clark D, Halchenko YO, Waskom ML, Ghosh SS. Nipype: a flexible, lightweight and extensible neuroimaging data processing framework in python. Front Neuroinform. 2011; 5:13. https://doi.org/10.3389/fninf.2011.00013 [PubMed]
- 73. Avants BB, Tustison N, Song G. Advanced Normalization Tools (ANTS). 2009; https://doi.org/10.54294/uvnhin
- 74. Jenkinson M, Beckmann CF, Behrens TE, Woolrich MW, Smith SM. FSL. Neuroimage. 2012; 62:782–90. https://doi.org/10.1016/j.neuroimage.2011.09.015 [PubMed]
- 75. Fischl B. FreeSurfer. Neuroimage. 2012; 62:774–81. https://doi.org/10.1016/j.neuroimage.2012.01.021 [PubMed]
- 76. Jenkinson M, Bannister P, Brady M, Smith S. Improved optimization for the robust and accurate linear registration and motion correction of brain images. Neuroimage. 2002; 17:825–41. https://doi.org/10.1016/s1053-8119(02)91132-8 [PubMed]
- 77. Wang S, Peterson DJ, Gatenby JC, Li W, Grabowski TJ, Madhyastha TM. Evaluation of Field Map and Nonlinear Registration Methods for Correction of Susceptibility Artifacts in Diffusion MRI. Front Neuroinform. 2017; 11:17. https://doi.org/10.3389/fninf.2017.00017 [PubMed]
- 78. Cox RW, Hyde JS. Software tools for analysis and visualization of fMRI data. NMR Biomed. 1997; 10:171–8. https://doi.org/10.1002/(sici)1099-1492(199706/08)10:4/5<171::aid-nbm453>3.0.co;2-l [PubMed]
- 79. Greve DN, Fischl B. Accurate and robust brain image alignment using boundary-based registration. Neuroimage. 2009; 48:63–72. https://doi.org/10.1016/j.neuroimage.2009.06.060 [PubMed]
- 80. Behzadi Y, Restom K, Liau J, Liu TT. A component based noise correction method (CompCor) for BOLD and perfusion based fMRI. Neuroimage. 2007; 37:90–101. https://doi.org/10.1016/j.neuroimage.2007.04.042 [PubMed]
- 81. Wang HT, Meisler SL, Sharmarke H, Clarke N, Gensollen N, Markiewicz CJ, Paugam F, Thirion B, Bellec P. Continuous evaluation of denoising strategies in resting-state fMRI connectivity using fMRIPrep and Nilearn. PLoS Comput Biol. 2024; 20:e1011942. https://doi.org/10.1371/journal.pcbi.1011942 [PubMed]
- 82. Friston KJ. Statistical parametric mapping: the analysis of functional brain images. ed. Amsterdam Boston: Elsevier / Academic Press. 2007.
- 83. MATLAB. MA: MathWorks; 2022.
- 84. GBD 2023 Disease and Injury and Risk Factor Collaborators. Burden of 375 diseases and injuries, risk-attributable burden of 88 risk factors, and healthy life expectancy in 204 countries and territories, including 660 subnational locations, 1990-2023: a systematic analysis for the Global Burden of Disease Study 2023. Lancet. 2025; 406:1873–922. https://doi.org/10.1016/S0140-6736(25)01637-X [PubMed]
- 85. Benjamini Y, Hochberg Y. Controlling the False Discovery Rate: A Practical and Powerful Approach to Multiple Testing. Journal of the Royal Statistical Society Series B: Statistical Methodology. 1995; 57:289–300. https://doi.org/10.1111/j.2517-6161.1995.tb02031.x
- 86. LabVIEW. Austin: National Instruments.
- 87. Kay M, Elkin LA, Higgins JJ, Wobbrock JO. ARTool: Aligned Rank Transform [Internet]. 2014. p. 0.11.2. Available from: https://CRAN.R-project.org/package=ARTool.
- 88. Bates D, Mächler M, Bolker B, Walker S. Fitting Linear Mixed-Effects Models Using lme4. J Stat Soft. 2015; 67. Available from: http://www.jstatsoft.org/v67/i01/.
- 89. Fox J, Weisberg S, Price B. carData: Companion to Applied Regression Data Sets. 2017:3.0–5. Available from: https://CRAN.R-project.org/package=carData.
- 90. Patil I, Makowski D, Ben-Shachar MS, Wiernik BM, Bacher E, Lüdecke D. datawizard: An R Package for Easy Data Preparation and Statistical Transformations. JOSS. 2022; 7:4684. https://doi.org/10.21105/joss.04684