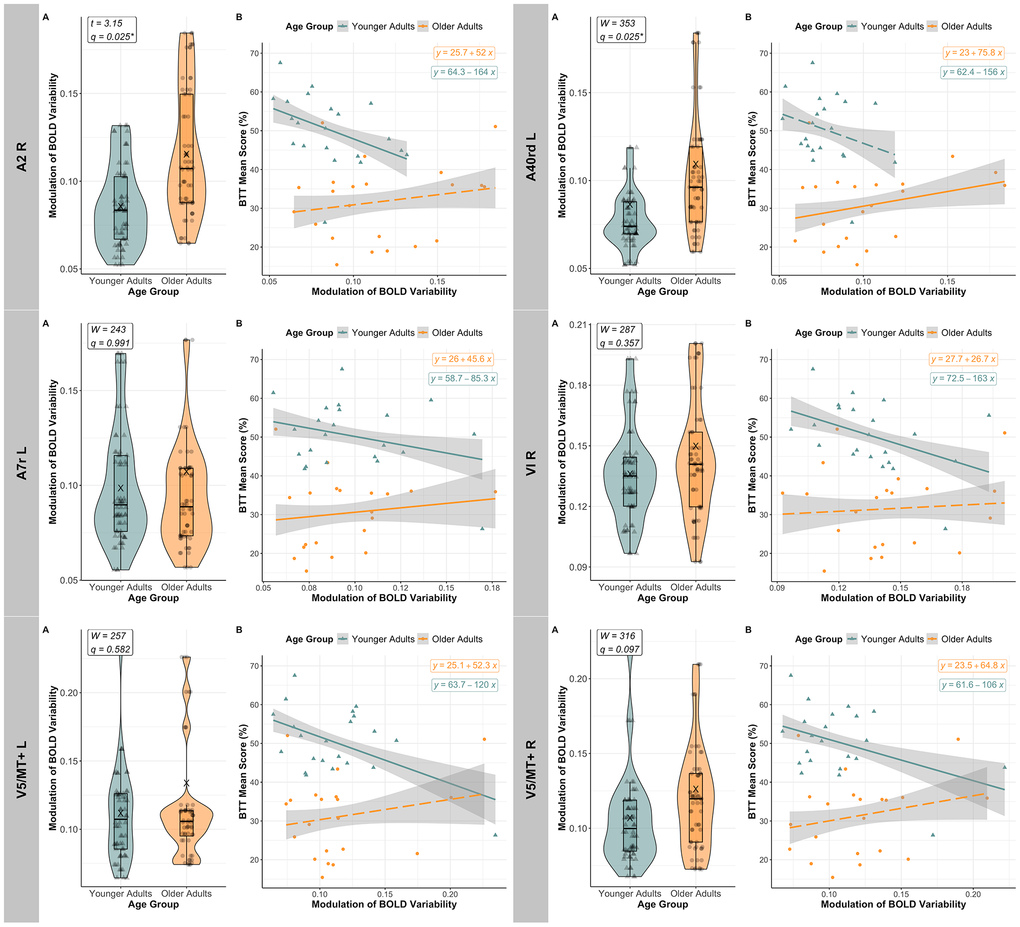
Figure 6.Age-related modulation of BOLD variability and its relationship with BTT performance. For each region of interest (ROI) where BOLD SD MODULATION significantly predicted BTT MEAN SCORE after FDR correction in at least one of the age groups, the figure shows: [A] BOLD variability (BOLD SD) modulation across age groups (Younger Adults in teal [triangles], and Older Adults in orange [circles]). In the right primary somatosensory cortex (A2), the left inferior parietal lobe (A40rd), as well as the left cerebellar lobules VIIb and VIIIb (not displayed in the figure), older adults exhibited, on average (“X”), more BOLD SD modulation than younger adults, with q < 0.05 (FDR-corrected). Significance level: * q < 0.050; [B] The relationship between BOLD SD modulation and mean BTT performance, shown per age-group (Younger Adults again in teal [triangles], and Older Adults in orange [circles]). After FDR correction, younger adults consistently exhibited a significant negative association between BOLD SD modulation and performance across all ROIs analyzed, except for the left inferior parietal lobe (A40rd), while older adults showed a positive relationship in the left inferior and parietal lobes (left A40rd and A7r, respectively). Dashed regression lines identify effects that did not survive FDR correction. Abbreviations: A2 = primary somatosensory cortex; A40rd = inferior parietal lobe; A7r = superior parietal lobe; FDR = False Discovery Rate; L = Left; R = Right; V5/MT+ = motion area V5/MT+; VI = cerebellar lobule VI.