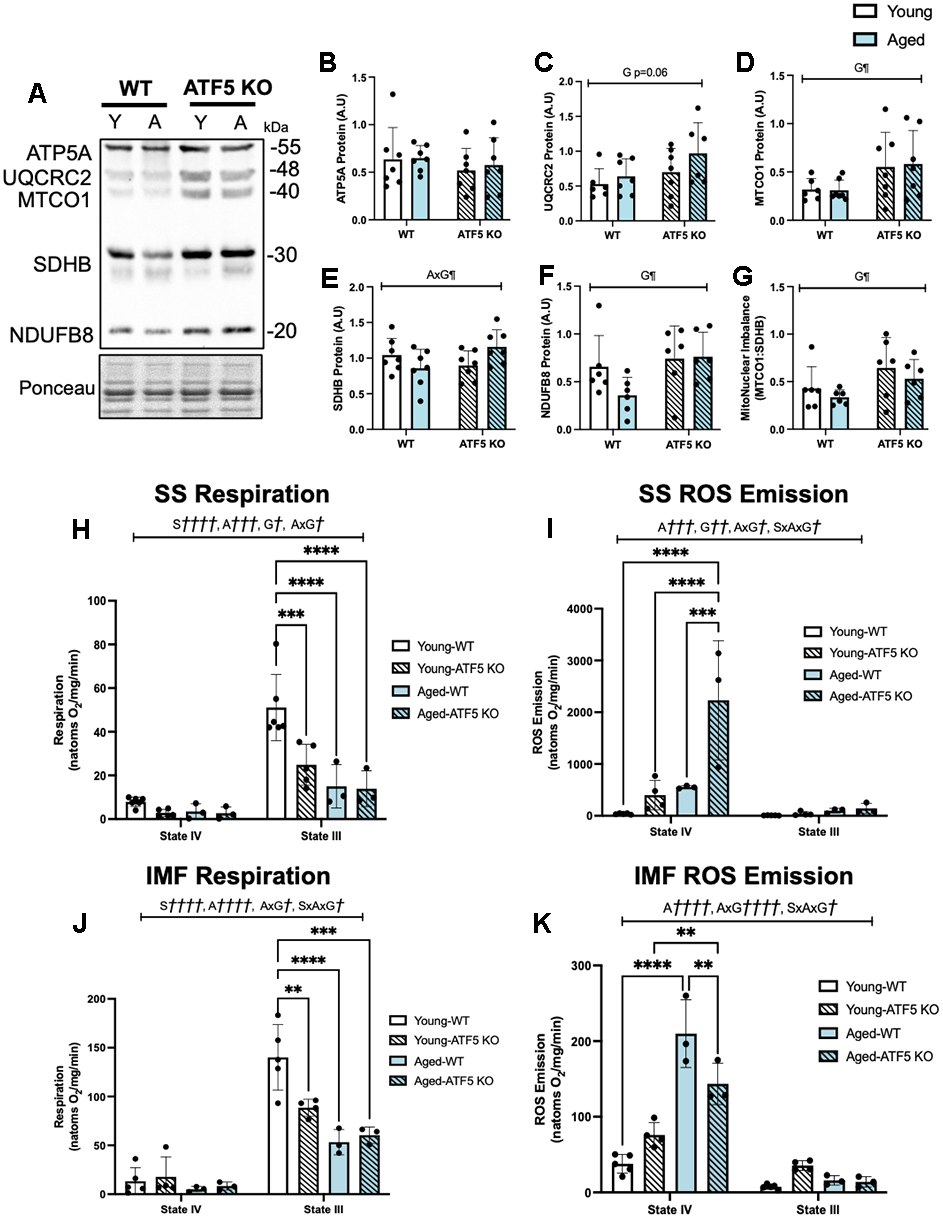
Figure 5.ATF5 KO mice contain a greater pool of poorly functioning skeletal muscle mitochondria, which is exacerbated with age. (A) Representative total OXPHOS blot (ATP5A, UQCRC2, MTCO1, SDHB, and NDUFB8), corrected to Ponceau, with respective quantifications (B–G). The approximate molecular weights of proteins are indicated with a hash bar in kilodaltons (kDa) (n=4-7/group). (H) Mitochondrial respiration, expressed in natoms O2/mg/min in both passive (State IV) and active (State III) respiratory conditions in SS mitochondria alongside (I) ROS emission. (J) Mitochondrial respiration and (K) ROS emission in IMF mitochondrial subfractions. (n=3-6/group). A¶¶¶ P<0.001, A¶¶¶¶ P<0.0001, main effect of age; G¶ P<0.05, G¶¶ P<0.01, main effect of genotype; AxG¶ P<0.05, AxG¶¶¶¶ P<0.0001, interaction between age and genotype; Two-way ANOVA (n=4-8/group). S†††† P<0.0001, main effect of respiratory state;A††† P<0.001, A†††† P<0.0001 main effect of age; G† P<0.05, G†† P<0.01, main effect of genotype; AxG† P<0.05, AxG†††† P<0.0001, interaction between age and genotype, SxAxG P<0.05, interaction between state, age and genotype; Three-way ANOVA (n=3-6/group), Tukey’s post-hoc analyses, Young WT vs. Young ATF5 KO, Aged WT vs. Aged ATF5 KO, Young WT vs. Aged WT, Young ATF5 KO vs. Aged ATF5 KO, Young ATF5 KO vs. Aged WT, Young WT vs. Aged ATF5 KO in both states. Tukey’s post-hoc: **P<0.01, ***P<0.001, ****P<0.0001. Data are means SD.