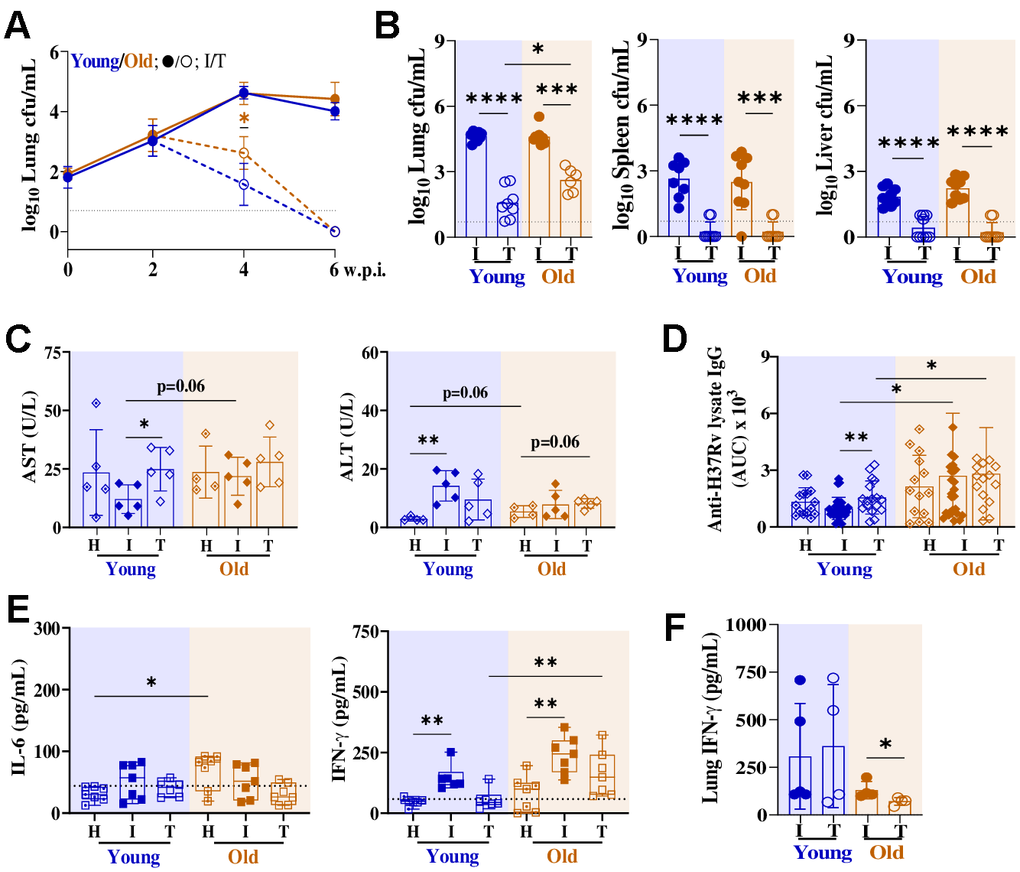
Figure 2.Old C57BL/6 mice exhibit delayed lung Mtb clearance following two weeks of RIF-INH treatment. (A) Lung bacterial burden (in log10cfu/mL) in male C57BL/6 mice from infected (I; at 2, 4 and 6 w.p.i.) and treated (T; at 2 and 4 w.p.t.; treatment started at 2 w.p.i.) groups; n=10/timepoint/age group/condition; dashed horizontal line represents limit of detection (LOD). A set of two independent experiments is depicted. (B–F) showing data of infected groups at 4 w.p.i. and treated groups at 2 w.p.t.. (B) Bacterial load (in log10cfu/mL) in lung, spleen and liver; individual data points at 4 w.p.i./2 w.p.t. presented in histograms (n=10/age group/condition). (C) Serum alanine transaminase (ALT) and aspartate aminotransferase (AST) activities in mice of different groups (n=5/age group/condition) at 4 w.p.i./2 w.p.t.. (D) Area under the curve (AUC) for Mtb H37Rv lysate-specific serum IgG in healthy (H; n=15/age group), infected (I; n=27-28/age group) and treated (T; n= 16-17/age group) mice at 4 w.p.i./2 w.p.t.. (E) Serum cytokines (in picogram per milliliter): IL-6, IFN-γ in different mice groups (n=6-7/age group/condition) at 4 w.p.i./2 w.p.t.. (F) Lung IFN-γ in the different mice groups (n=4-5/age group/condition) at 4 w.p.i./2 w.p.t.. Young (2-4 months) in blue and old (17-19 months) mice in brown; cfu= colony forming unit; w.p.i.= weeks post infection; w.p.t.= weeks post treatment; p-values: * ≤0.05, ** <0.005, *** <0.0005 and **** <0.0001 at 95% confidence interval by Mann-Whitney test. Data shown as mean ± SD. See also Supplementary Figures 1, 4.