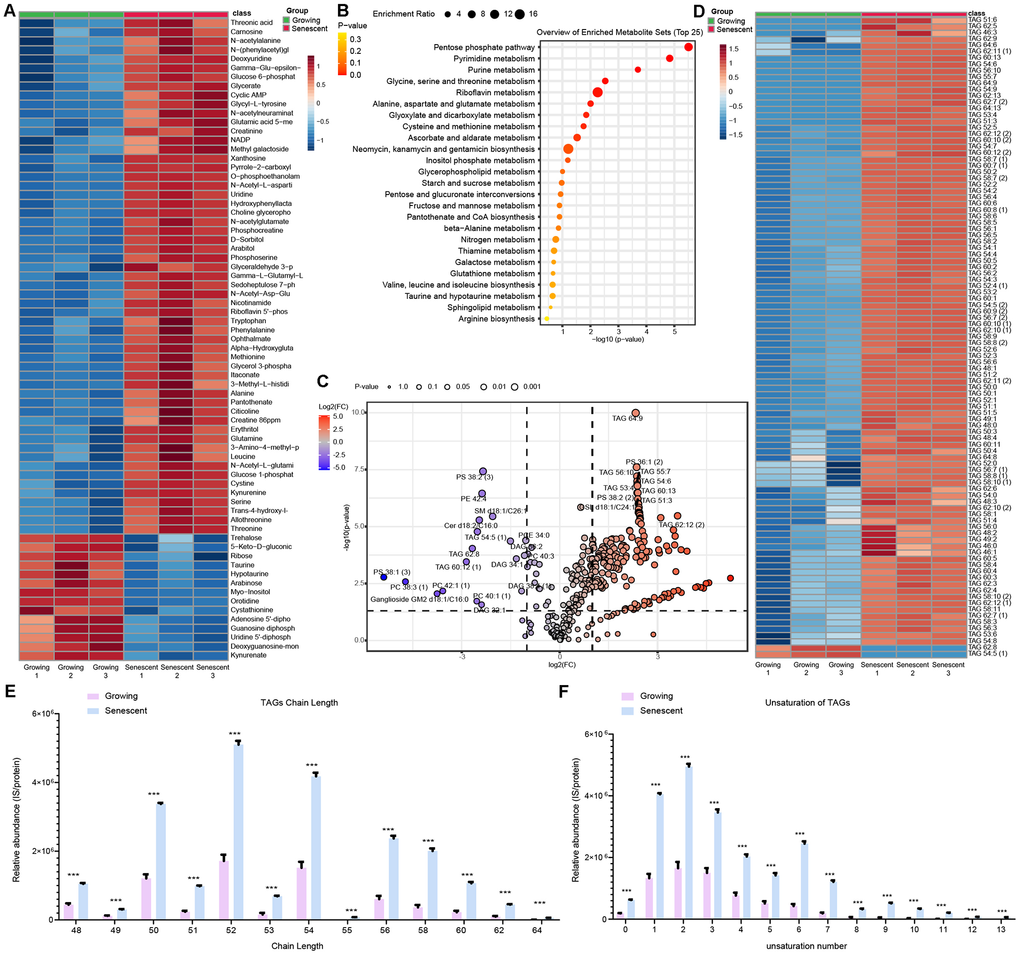
Figure 1.SnCs exhibit enhanced metabolic activity. Senescence was induced in BJ fibroblasts by a 48-hour incubation with 50 μM Etoposide, and cells were analysed one week post treatment [43]. Lipid profiling identified 370 lipid species, among them 184 were differentially expressed (DE) and 239 polar metabolites, 71 of them were DE. Parentheses indicate isomers. (A) DE polar metabolites in senescent BJ cells (n=3, red line) compared to control BJ cells (n=3, green line). (B) Over-represented pathways of significantly altered metabolites in senescent versus growing cells, ranked and coloured by –log10(p-value) and the size of the circle represents the enrichment ratio. (C) Volcano plot displaying the log2 fold change (x-axis) and statistical significance (-log10(p-value), y-axis) of lipid species in senescent versus control BJ cells. The size of the circle represents the value of P-value. (D) DE lipids of the triacylglycerol class in senescent BJ cells (n=3, red line) compared to control BJ cells (n=3, green line). (E) Relative abundance of triacylglycerol (TAG) species in senescent and growing cells categorized by total carbon chain length. (F) Relative abundance of TAG species by degree of unsaturation of chains (number of double bonds). Data are shown as mean ± SD. ***P < 0.001, **P < 0.01, *P < 0.05.