


Introduction
Cellular senescence is a state of cell cycle arrest in previously proliferating cells, triggered by cellular stress [1–3]. This complex biological process can exert both beneficial and detrimental effects in a biological context-dependent manner [1–3]. Cellular senescence acts as a barrier to tumorigenesis by limiting the excessive proliferation of damaged cells [4]. In addition, Senescent cells (SnCs) play a functional role in regeneration [5–7], reprogramming [8], and development [9–11]. However, the accumulation of SnCs in tissues with age contributes to age-related pathologies, including cancer [12], lung diseases [13, 14], cardiovascular disease [15], and neurodegenerative conditions [16] such as Alzheimer’s disease (AD) [17, 18]. This effect is primarily attributed to the secretion of pro-inflammatory cytokines, chemokines, and proteases, known as the Senescence-Associated Secretory Phenotype (SASP) [2, 12]. While the diverse functional consequences of SnCs accumulation are well appreciated, the underlying metabolic adaptations of these cells and how they contribute to diverse phenotypes of SnCs are less understood.
SnCs undergo extensive metabolic reprogramming to support their survival and SASP. Key alterations include increased glycolysis [19], changes in mitochondrial functions [20], and metabolic rewiring that impacts redox homeostasis [21]. These changes can be triggered by various senescence-inducing factors, including mutant oncogenes [22, 23]. In a murine lymphoma model of chemotherapy-induced senescence, inhibiting glucose metabolism led to tumor regression [24]. This effect was partially attributed to the elimination of senescent cells and their SASP from the tumor microenvironment [24]. In addition to the changes in glycolysis, a dysregulation of lipid metabolism was also noted in SnCs [25, 26]. One of the cellular organelles that plays a central role in lipid metabolism is Lipid droplets (LDs) [27]. LDs are evolutionarily conserved organelles crucial for storing neutral lipids and maintaining energy homeostasis [27, 28]. Excessive LDs have been implicated in various age-related pathologies [28–30], such as cancer [31], renal fibrosis [32], and non-alcoholic fatty liver disease [33], resembling the detrimental impact of SnCs accumulation. Given the roles of both SnCs and altered lipid metabolism in aging and disease, particularly in neurodegenerative conditions [16, 34–36], including Alzheimer’s disease (AD) [17, 37], we hypothesized that there is a link between these two phenomena.
The accumulation of LDs has been described in several age-related neurological pathologies, including stroke [38] and AD [39]. In AD, microglia exposed to amyloid-beta exhibit LDs accumulation, which impairs their ability to clear amyloid plaques [40]. Furthermore, LDs are more prevalent in microglia from individuals with the APOE/e4 genotype and contribute to neurotoxicity [37]. In addition, the initial description of AD by Alois Alzheimer himself noted the presence of “many glial cells showing adipose saccules” in patient brains, highlighting a potentially underappreciated role for lipid accumulation in glial cells in this disease [37, 41, 42]. Given the involvement of senescent microglia in AD pathogenesis, it is necessary to understand if the accumulation of LDs is a defining characteristic of these detrimental senescent cells.
To test this hypothesis, we conducted an integrative analysis combining in vitro, in vivo, and human data. In senescent human fibroblasts, we observed elevated glycolysis and lipid metabolism, characterized by triacylglycerol accumulation and upregulation of LDs markers. A similar upregulation of LDs markers was detected in senescent microglia from 5xFAD mice, a mouse model of AD. In these mice, senescent microglia co-expressed LDs and senescence markers. Finally, single-nucleus RNA sequencing from post-mortem AD brains revealed that senescent brain cells, particularly microglia, exhibit increased expression of the LDs marker Plin2, along with other LDs-associated markers. These findings suggest that LDs accumulation is a conserved feature across senescent cells.
Results
To gain an unbiased understanding of the metabolic alterations associated with cellular senescence, we performed metabolic profiling of senescent BJ primary human fibroblasts. We induced senescence in the BJ cells by exposure to the DNA-damage agent Etoposide, a well-established model for studying senescence in culture [43]. We then analyzed changes in both lipids and polar metabolic profiles, comparing SnCs to growing control BJ cells. Overall, we identified 370 lipid species (Supplementary Table 1), among them 184 were differentially expressed (DE) (Supplementary Figure 1A), and 239 polar metabolites (Supplementary Table 2), 71 of them were DE (Figure 1A). The analysis of polar metabolites revealed an increase in glycolysis-related metabolites (e.g. Glucose 6-phosphate, Glyceraldehyde 3-phosphate, Glycerate) (Figure 1A), which was further analysed through pathway analysis showing an elevation in the pentose phosphate pathway (Figure 1B). This pathway is known to be activated during oxidative stress [44]. In addition, glycerol 3-phosphate, cyclic AMP, and NADP were also upregulated, which could reflect metabolic adaptations in senescent cells involving anabolic processes, redox balance and stress signaling (Figure 1A). Data analysis of lipid molecules revealed an overall elevation in lipid metabolites (Figure 1C and Supplementary Figure 1A), with the most pronounced increase observed in members of Triacylglycerol (TAG) family in the SnCs compared to the control cells (Figure 1D). Unsaturated long-chain TAGs were more abundant in SnCs (Figure 1E, 1F). We also found that unsaturated amphipathic lipid species are elevated in SnCs (Supplementary Figure 1B). These lipids increase membrane fluidity [45], which could affect membrane properties and contribute to morphological changes, which are known characteristics of senescent cells [46]. Our comprehensive metabolic profiling approach thus revealed a notable shift towards increased lipid metabolism, specifically TAG upregulation, alongside enhanced glycolytic activity and alterations in the pentose phosphate pathway in senescent fibroblasts.
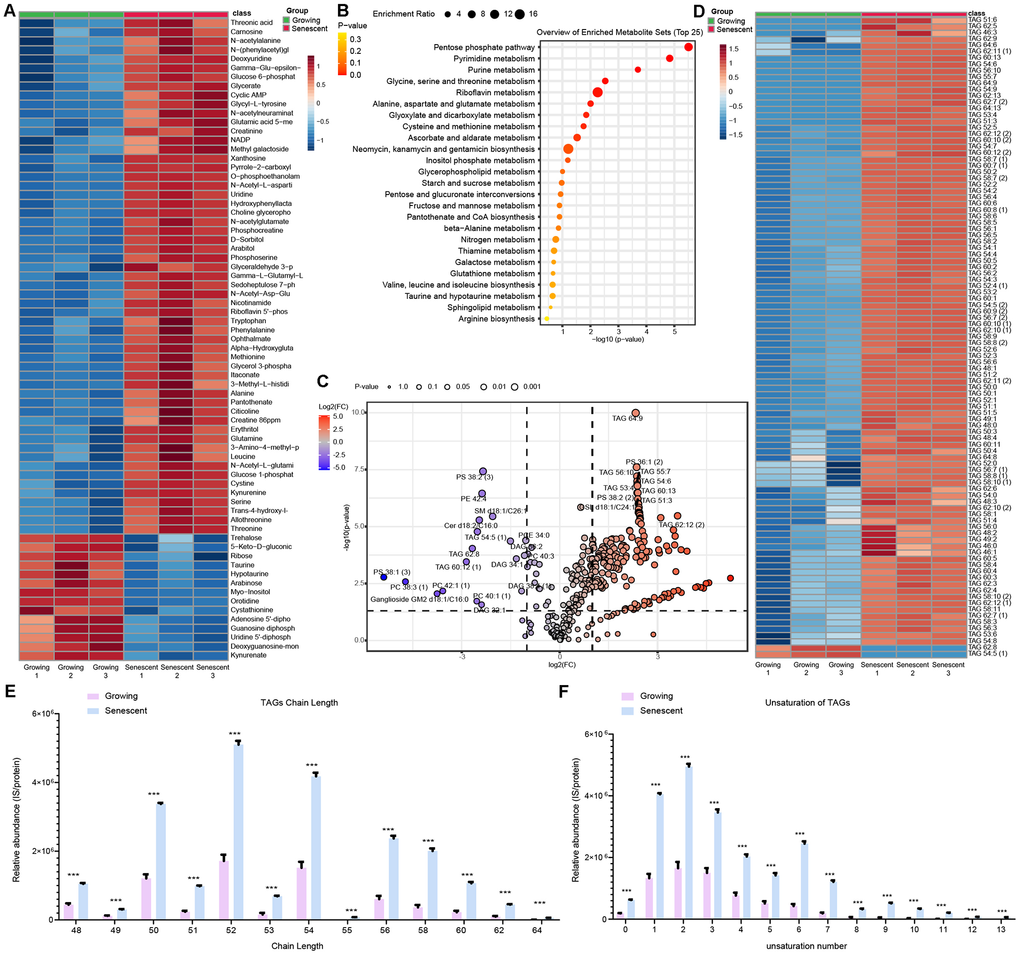
Figure 1. SnCs exhibit enhanced metabolic activity. Senescence was induced in BJ fibroblasts by a 48-hour incubation with 50 μM Etoposide, and cells were analysed one week post treatment [43]. Lipid profiling identified 370 lipid species, among them 184 were differentially expressed (DE) and 239 polar metabolites, 71 of them were DE. Parentheses indicate isomers. (A) DE polar metabolites in senescent BJ cells (n=3, red line) compared to control BJ cells (n=3, green line). (B) Over-represented pathways of significantly altered metabolites in senescent versus growing cells, ranked and coloured by –log10(p-value) and the size of the circle represents the enrichment ratio. (C) Volcano plot displaying the log2 fold change (x-axis) and statistical significance (-log10(p-value), y-axis) of lipid species in senescent versus control BJ cells. The size of the circle represents the value of P-value. (D) DE lipids of the triacylglycerol class in senescent BJ cells (n=3, red line) compared to control BJ cells (n=3, green line). (E) Relative abundance of triacylglycerol (TAG) species in senescent and growing cells categorized by total carbon chain length. (F) Relative abundance of TAG species by degree of unsaturation of chains (number of double bonds). Data are shown as mean ± SD. ***P < 0.001, **P < 0.01, *P < 0.05.
TAGs serve as the primary precursors for lipid droplets (LDs) formation [28]. We therefore hypothesize that the observed accumulation of TAGs reflects the build-up of LDs in senescent fibroblasts. To test this hypothesis, we evaluated the presence of LDs in senescent BJ fibroblasts compared to control BJ fibroblasts using LipidSpot staining, a neutral lipid dye commonly used to visualize lipid droplets for fluorescence imaging. We observed a significant increase in LDs levels in senescent BJ fibroblasts compared to control cells (P = 0.0068, t(17) = 3.080; Figure 2A). Additionally, we performed quantitative RT-PCR analysis for the expression of key LDs marker genes, Plin2 and ApoE. We detected a significant increase in the expression of these markers in SnCs compared to the control cells (ApoE: P = 0.0002, t(13) = 5.184; Plin2: P = 0.0169, t(13) = 2.739; Figure 2B). Overall, our results suggest that LDs accumulate in senescent fibroblasts. These results are consistent with prior findings in therapy-induced senescent tumor cells, where lipid droplet accumulation was observed [25].
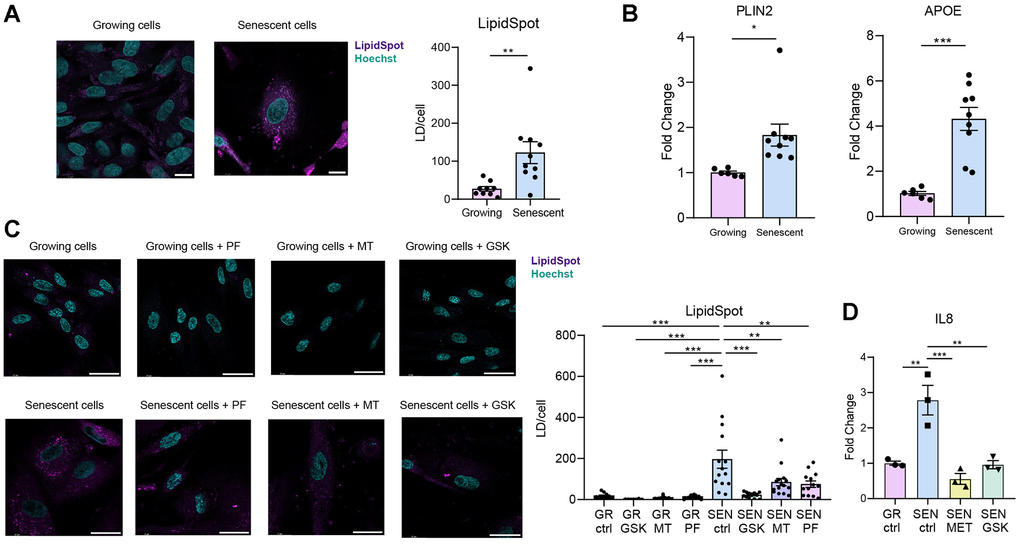
Figure 2. SnCs accumulate lipid droplets (LDs). Senescence was induced in BJ fibroblasts by a 48-hour incubation with 50 μM Etoposide, and cells were analysed one week post treatment [43]. (A) Representative confocal microscopy images and quantification of LDs in growing and senescent BJ fibroblasts, visualized by LipidSpot staining. LDs numbers were counted and normalized to cell count. (B) RT-PCR analysis of the expression of LDs marker genes in senescent BJ fibroblasts compared to growing controls. (C) Representative confocal microscopy images and quantification of LDs in BJ fibroblasts treated with AMPK activators (10 μM for 48 hours) following senescence induction. LDs numbers were counted and normalized to cell count. The significant increase in LDs in senescent BJ cells was reversed by AMPK activators. (D) RT-PCR analysis of the expression of IL8 in senescent BJ fibroblasts non-treated and treated with GSK621 (10 μM) or with Metformin (3mM) compared to growing controls. Statistical significance was assessed using a two-tailed unpaired t-test (*P<0.05, **P<0.005, ***P<0.0005). Data are presented as mean ± SEM. Scale bar = 10 μm.
Rewiring of metabolic and signaling pathways is necessary for LDs accumulation and overall increase in TAGs in SnCs. To explore a molecular pathway potentially associated with the changes in lipid metabolism, we focused on AMP-activated protein kinase (AMPK), a central regulator of cellular energy homeostasis [47]. AMPK promotes catabolic pathways, while inhibiting anabolic processes such as lipid and fatty acid synthesis. To evaluate the effect of AMPK on the changes in lipid metabolism in SnCs, we treated senescent BJ fibroblasts with three distinct AMPK activators (GSK621, PF-739, and MT63-78), all of which significantly reduced LDs content, as visualized by LipidSpot staining (one-way ANOVA: F(7,86) = 10.11, P < 0.0001; Figure 2C). Thus, treatment with AMPK activators restricted LDs levels in SnCs to those of non-senescent control cells. Interestingly, this lipid-lowering effect was accompanied by reduced levels of phosphorylated TBK1, a kinase involved in pro-inflammatory signaling (Supplementary Figure 2A) and SASP pro-inflammatory cytokine IL-8 (Figure 2D, one-way ANOVA, F (3, 8) = 18.34, P = 0.0006), suggesting that AMPK activation may also attenuate inflammatory pathways associated with senescence. Together, these results suggest that AMPK activation modulates metabolic pathways in senescent cells, leading to reduced LDs accumulation and diminished inflammatory pathway activation. Importantly, our findings are consistent with recent reports showing that neuronal AMPK regulates LDs formation in microglia in tauopathy models [48], indicating that this mechanism may be conserved across different senescent cell types.
Considering the previous reports implicating both lipid droplets-accumulating microglia and senescent microglia in the progression of Alzheimer’s disease pathology, we sought to investigate whether these two cellular states might converge within the same cell population in vivo, potentially representing a single key driver of neurodegeneration. Our goal was to determine, at the single-cell level, whether senescent microglia also accumulate LDs. We applied Cytometry by Time of Flight (CyTOF) to a single-cell suspension of the brains from 5xFAD mice aged 11.5-13.3 months, a model of Alzheimer’s disease (AD). These mice accumulate senescent microglia [17]. The CyTOF analysis combined markers for senescence (p16, p19, p21, gH2AX) and LDs (Plin2 and ApoE). This combination revealed that the distinct population of senescent microglia in the 5xFAD mouse brain upregulated expression of the LDs markers (Figure 3A–3D). To explore the clinical relevance of our observations, we extended our investigation to post-mortem human brain tissue from AD patients and age-matched controls, aiming to identify the co-occurrence of senescence markers and LDs markers in human brain cells. We analyzed single-nucleus RNA sequencing (snRNA-seq) data [49] and revealed that human senescent brain cells upregulate LDs markers. Based on transcriptional signatures and marker gene expression, we identified a cluster of brain microglia (Figure 4A and Supplementary Figure 3). We focused our analysis on this microglial cluster and, within it, we stratified the cells based on their senescence scores. Cells with a senescence score above the 99th percentile were classified as ‘High’ senescence, those with a score ≤ 0 as ‘Low,’ and all others as ‘Medium (Figure 4B). Analysis of all the brain cells with high senescence scores exhibited elevated expression of Plin2, a lipid droplets-associated gene, as well as ApoE, compared to low-senescence-score (Figure 4C). Comparing microglia in the highest versus lowest senescence score quartiles revealed that Plin2, a lipid droplet-associated gene, was significantly upregulated in highly senescent microglia (Figure 4D). To explore molecular pathways associated with a senescent LDs-marker positive microglia transcriptional profile, we performed enrichment analysis. We visualized the results as a network of overlapping gene sets (Figure 4E). Among the significantly enriched pathways, the lipid and atherosclerosis pathways are connected to senescence-relevant pathways, including Toll-like receptor signaling, MAPK signaling, apoptosis, and HIF-1 signaling. These interconnected pathways might provide a mechanistic link between LDs accumulation and the inflammatory and stress responses characteristic of senescent microglia. Therefore, snRNA-seq analysis supports the presence of senescent LDs-containing microglia in the human brain.
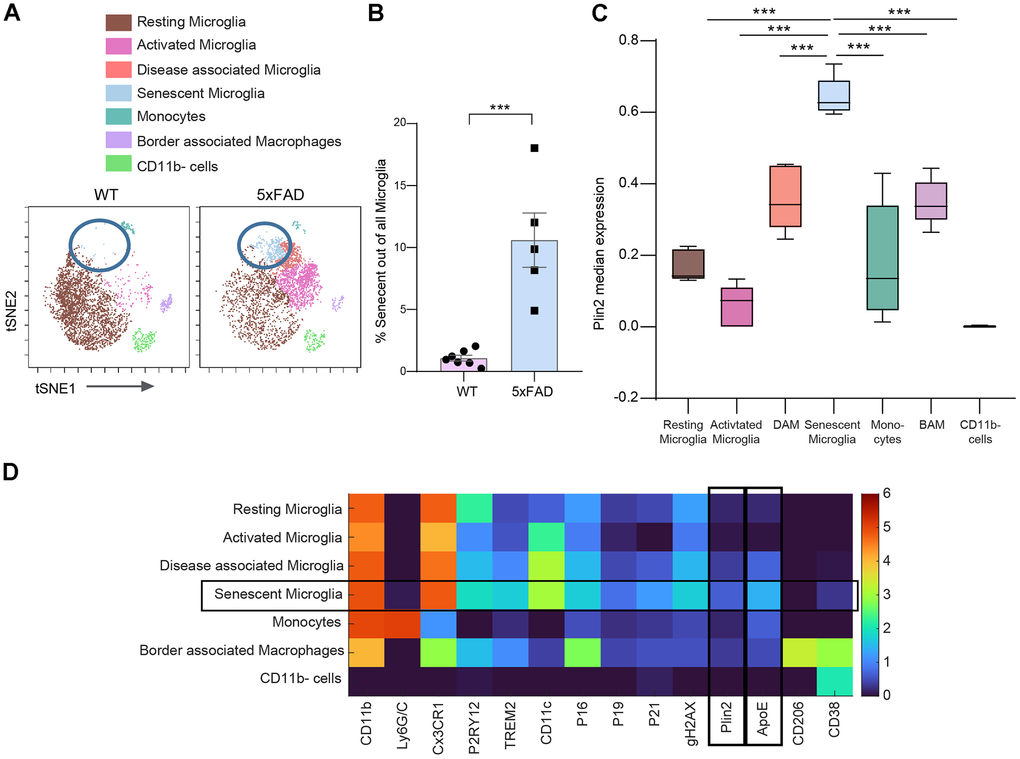
Figure 3. Senescent microglia accumulate LDs. Mass cytometry analysis was performed on brain tissue from wild-type (WT) mice (female (n = 4), male (n = 3), 10.9-13.3-month-old), and 5xFAD mice (females (n = 2), males (n = 3), 10.9-11.6-month-old). (A) Representative t-distributed Stochastic Neighbor Embedding (t-SNE) plots visualizing CD45+ cells (n = 39,504; 3,292 cells per sample) from each experimental group, with colors indicating FlowSOM-guided cell clusters. (B) Quantification of the percentage of senescent microglia within the total microglia population (Two-tailed Student’s t-test, P = 0.0112). (C) Feature plot showing the expression levels of Plin2 across the t-SNE clusters within the 5xFAD mouse group. (D) Heatmap displaying median marker expression values across the identified cell populations (average profile of n = 5; 5xFAD mice). *P<0.05, **P<0.005, ***P<0.0005; data represent mean ± SEM).
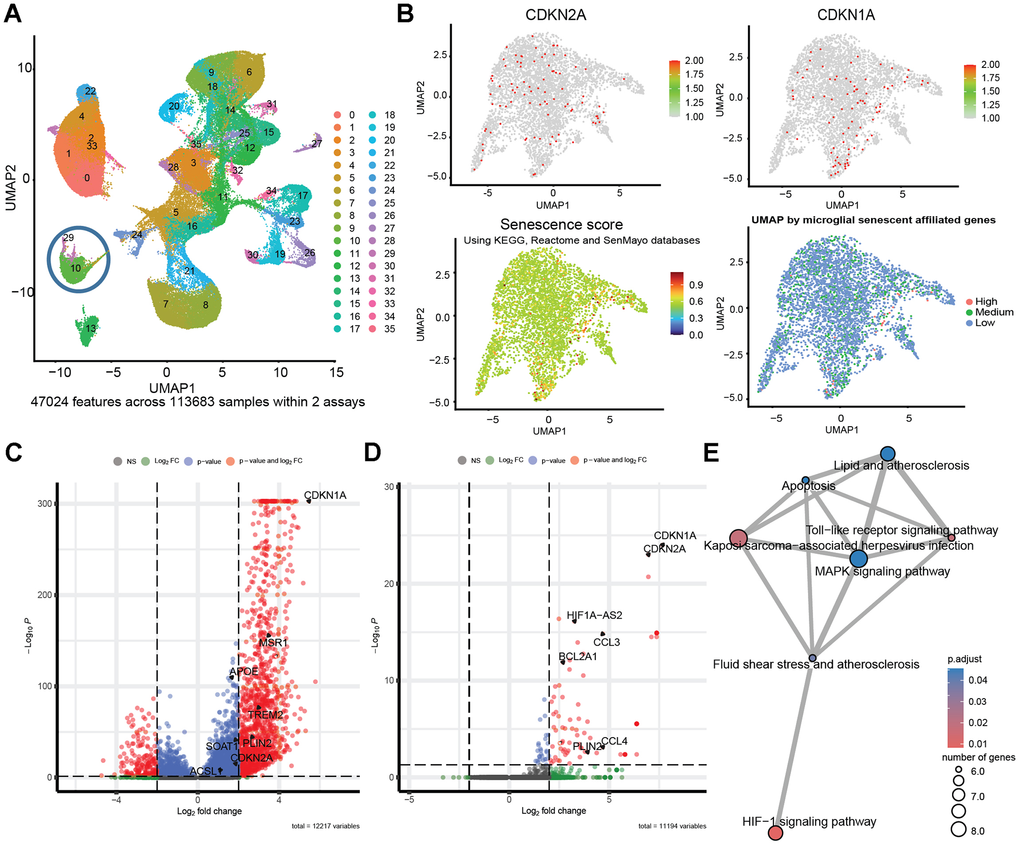
Figure 4. Human senescent brain cells accumulate LDs. Analysis of published single-nucleus RNA sequencing (snRNA-seq) data from post-mortem human Alzheimer’s patients and controls showing 35 clusters from 11 people with AD carrying TREM2-CV, 10 carrying TREM2-R62H and 11 non-AD controls [49]. (A) UMAP clusters generated by SCTransform. (B) Microglia cluster feature plots of CDKN2A, CDKN1A, module score of senescence related genes; components leading to the assembly of senescence score, and factorial distribution of senescence score (“High” ≥ 99%, “Low” ≤ 0). Senescence score (snRNA-seq) was calculated per nucleus. Per nucleus we combined (i) a Seurat AddModuleScore based on KEGG and Reactome “cellular senescence” plus SenMayo genes (excluding CDKN1A/CDKN2A) and (ii) CDKN1A + CDKN2A expression (zeros set to 1). The final score is the product of (i) and (ii). (C) Volcano plot of Differentially Expressed Genes (DEG) between all brain cells with “High” and “Low” senescent scores. (D) Detailed analysis of DEG in “High” versus “Low” senescence score cells within the microglia cluster, emphasizing the upregulation of Plin2 in senescent microglial cells. (E) Enrichment plot displaying relationship between enriched pathways in a network.
Discussion
In this study, we provide evidence across in vitro, in vivo, and post-mortem human data demonstrating a connection between cellular senescence and the accumulation of lipid droplets (LDs). Our metabolomic profiling of senescent fibroblasts revealed elevated levels of triacylglycerols, precursors of LDs, which coincided with increased LDs abundance. In the context of Alzheimer’s disease (AD), senescent microglia exhibit increased expression of LDs markers in a mouse model of AD. The analysis of single-nucleus RNA sequencing data from human AD brains displayed a similar accumulation of LDs markers in senescent glial cells. Together, these convergent findings suggest that LDs accumulation is a feature of cellular senescence, potentially contributing to their detrimental role in age-related diseases. Previous studies have established a connection between LDs and various age-related pathologies, including cancer, where LDs can provide energy and building blocks for rapid proliferation and confer drug resistance [50], obesity, where excessive LDs storage in adipocytes contributes to metabolic dysfunction [51], and neurodegenerative diseases [52], where altered lipid metabolism and LDs accumulation can impair cellular function and contribute to toxic protein aggregation [40]. Our findings provide evidence linking cellular senescence with LDs accumulation, suggesting that these two processes are interconnected and mutually supporting aging and disease. Specifically, the accumulation of LDs in senescent microglia, as observed in both the AD mouse model and the brains of human AD patients, highlights a potential pathological mechanism by which SnCs contribute to neuroinflammation in AD. Myelin degeneration is a hallmark of aging and Alzheimer’s disease models [53], where its breakdown exacerbates cognitive decline [54]. Plin2 was found to promote LDs accumulation which, in turn, prevented remyelination in a demyelination model [55]. Studies have shown that microglia play a critical role in myelination [56]. During aging, there may be an increase in demyelination [54], and senescent microglia with LDs accumulation might be incapable of promoting regeneration of the myelin sheath, thereby contributing to Alzheimer’s disease pathology.
Our study integrates in vivo, in vitro, and human datasets analyses. However, we acknowledge the limitation of the in vitro analyses which relied on a single senescence-induction paradigm, DNA damage induced senescence. This paradigm is widely used in the field. Within this framework, activation of AMPK consistently reduced lipid droplets (LDs) accumulation specifically in senescent cells and was accompanied by a reduction in IL-8, a prominent pro-inflammatory SASP factor. These findings support a link between senescence-associated metabolic remodeling and inflammatory signaling. LDs might serve as intracellular signaling platforms, influencing the production and release of SASP factors, including pro-inflammatory cytokines [36, 48]. Conversely, the SASP itself might alter cellular metabolism in a way that promotes LDs accumulation. Investigating this could reveal novel therapeutic targets for modulating both the inflammatory and metabolic dysregulation associated with SnCs accumulation. On a broader scale, this study raises important questions about the nature of the relationship between SnCs and LDs. Are LDs simply a byproduct of the altered metabolism in SnCs, or do they play an active role in promoting the detrimental effects of cellular senescence? Future studies should explore the mechanisms linking these processes and investigate whether targeting LDs may ameliorate the adverse effects of SnCs in aging and age-related diseases while preserving their beneficial effects. For instance, by examining whether LD reduction in senescent cells affects SASP secretion and cell survival. In addition, future work incorporating optimized spatial and imaging-based approaches will be required to simultaneously visualize lipid droplets and senescent cells in the brain and define their anatomical distribution.
In summary, our findings demonstrate that LDs accumulation in senescent cells is a feature that extends from in vitro to Alzheimer’s disease in both murine model and human patients. By elucidating the connections between SnCs, LDs, and metabolic pathways, particularly within microglial cells, this study might provide a crucial foundation for the development of novel therapeutic strategies aimed at mitigating the harmful effects of cellular senescence in aging and age-related pathologies, with a specific focus on reducing LDs in senescent microglia and potentially slowing the progression of AD.
Methods
Cell culture and induction of senescence
Human BJ fibroblasts were obtained from the American Type Culture Collection (ATCC) and placed in a low oxygen (5% CO2, 3% O2) incubator at 37° C. The cells were maintained in DMEM (11965-092, Thermo Fisher Scientific) supplemented with 2 mM l-glutamine, 100 units/ml of penicillin, 100 mg/ml of streptomycin (03-031-1B, Biological Industries) and 10% fetal bovine serum (FBS) (10270, Thermo Fisher Scientific). DNA damage-induced senescence (DIS) was induced by treatment with etoposide (E1383, Sigma-Aldrich) at a concentration of 50 μM for 48 hr. By 7 days post-treatment, the cells had acquired the senescence phenotype. Treatment with AMPK activators (MT63-78 cat-AOB31992, PF-739 cat-AOB33584, GSK621 cat-SML2003, metformin cat- PHR1084) was either 10 μM for MT63, PF-739 and GSK621 or 3mM for Metformin for 48 hours following senescence induction with Etoposide.
Metabolite extraction
Extraction and analysis of polar metabolites and lipids were performed according previously described in Malitsky et al. (2016) [57] and Zheng et al. (2015) [21], with minor modifications. Senescent or control BJ cells pellets were extracted with 1 mL of a pre-cooled (−20° C) homogeneous mixture of methanol:methyl-tert-butyl ether (MTBE) at a 1:3 (v/v) ratio. The extraction solvent included internal standards: phosphatidylcholine (17:0/17:0, Avanti) at 0.1 μg/mL, phosphatidylethanolamine (17:0/17:0, Avanti) at 0.4 μg/mL, Ceramide/Sphingoid Internal Standard Mixture II (Avanti, LM6005) at 0.15 nmol/mL, d5-triacylglycerol Internal Standard Mixture I (Avanti, LM6000) at 0.0267 μg/mL, and palmitic acid-13C (Sigma, 605573) at 0.1 μg/mL. Samples were briefly vortexed and then sonicated for 30 minutes in an ice-cold sonication bath, with brief vortexing every 10 minutes. Subsequently, 0.5 mL of UPLC-grade water (DDW):methanol (3:1, v/v) containing C13- and N15-labeled amino acid standards (Sigma, 767964; (1:1500)) was added. After vortexing thoroughly and centrifugation, the upper organic phase was transferred into a new tube. The remaining polar phase underwent a second extraction with an additional 0.5 mL of MTBE. Organic extracts from both extractions were combined, and the polar phase was transferred to a separate tube. Both extracts were dried under a gentle nitrogen stream and stored at −80° C.
LC-MS analysis of polar metabolites
Dried polar extracts were resuspended in 150 μL methanol:DDW (50:50), centrifuged twice, and 120 μL was transferred to HPLC vials. Metabolite profiling was performed using an Acquity I-class UPLC system (Waters) coupled to a Q Exactive Plus Orbitrap™ mass spectrometer (Thermo Fisher Scientific), operating in negative ionization mode. Chromatographic separation was conducted using a SeQuant Zic-pHilic column (150 mm × 2.1 mm) with a SeQuant guard column (20 mm × 2.1 mm) (Merck). Mobile phase B consisted of acetonitrile, while mobile phase A comprised 20 mM ammonium carbonate with 0.1% ammonium hydroxide in DDW:acetonitrile (80:20, v/v). The flow rate was 200 μL/min with the column temperature maintained at 45° C. The gradient conditions were: 0–2 min at 75% B; linear decrease to 25% B by 14 min, maintained until 18 min; increased to 75% B at 19 min, held for 4 min, and maintained at 75% B until 23 min. Injection volume: 2 μL.
Mass spectral data were acquired within an m/z range of 70–1050 using heated electrospray ionization (HESI) in negative mode. Ion source parameters included capillary temperature at 325° C, spray voltage at 3.25 kV, sheath gas flow rate at 40, auxiliary gas flow rate at 10 (arbitrary units), and auxiliary gas temperature at 50° C. MS1 spectra were acquired at a resolution of 35,000 FWHM, with data-dependent MS/MS acquisition conducted using an isolation window of 3 m/z and a resolution of 17,500 FWHM.
Polar metabolites data analysis
Data processing was done using TraceFinder (Thermo Fisher Scientific) software, when detected compounds were identified by retention time, and fragments were verified using an in-house-generated mass spectra library.
LC-MS for lipidomics analysis
Lipid extracts were reconstituted in 150 μL of acetonitrile:isopropanol (ACN:IPA, 75:25), vortexed, and centrifuged. Subsequently, 130 μL of supernatant was transferred into HPLC vials. Lipid analysis was performed using an Acquity I-class UPLC system (Waters) coupled to a Q Exactive Plus Orbitrap™ mass spectrometer (Thermo Fisher Scientific). Chromatographic separation was conducted on an ACQUITY UPLC BEH C8 column (2.1 × 100 mm, 1.7 μm; Waters). Mobile phase A was DDW:ACN:IPA (46:38:16, v/v/v) with 1% 1M NH4Ac and 0.1% acetic acid, and mobile phase B was DDW:ACN:IPA (1:69:30, v/v/v) with identical additives. The flow rate was 0.4 mL/min with the column temperature maintained at 40° C. The gradient program was as follows: 100% A for 1 min, decreased linearly to 25% A at 12 min, decreased further to 0% A at 16 min, held at 100% B until 21 min, returned to 100% A at 21.5 min, and equilibrated at 100% A until 25 min. Injection volume: 2 μL.
Mass spectral data were acquired within an m/z range of 100–1500 using heated electrospray ionization (HESI), operated in switching positive and negative ionization modes. Ion source parameters included capillary temperature at 275° C, spray voltage at 3.1 kV, sheath gas flow rate at 60, auxiliary gas flow rate at 20 (arbitrary units), and auxiliary gas temperature at 300° C. MS1 spectra were acquired at a resolution of 35,000 FWHM, with data-dependent MS/MS acquisition conducted using an isolation window of 1 m/z and a resolution of 17,500 FWHM.
Lipid data analysis
Lipid data were analyzed using LipidSearch™ (Thermo Fisher Scientific). Identification was validated by comparison with a homemade lipid library from various organisms and by correlation of retention times with carbon chain length and degree of unsaturation.
Relative levels of polar and lipid metabolites were normalized to the internal standards and protein content of the original samples.
Metabolomic analysis
Metabolite intensities of both polar metabolites and lipids were analyzed using MetaboAnalyst 6.0 framework [58]. Metabolites were considered differential using T-test statistics when detected in both groups, and had an absolute fold-change (log2) of over 1 with FDR <0.05. Over-represented pathways were detected using the “Global test” enrichment against the KEGG human metabolic pathways database (updated Dec. 2023), with all measurable metabolites as a reference. Lipidomics analyses such as chain length and unsaturation were applied using LipidOne 2.0 tools [59].
Stainings
BJ fibroblast cells were seeded in 4-well ibidiTreat™ μ-slide (Ibidi GmbH). Lipid droplets were stained using LipidSpotTM 610 (1:1000 from 1mg/ml stock solution in DMSO; Biotium), while cell nuclei were labelled by Hoechst 33342 (1:2000, Thermo Fisher Scientific). Before imaging cell medium was replaced with fresh DMEM medium without phenol red.
Confocal fluorescence microscopy
Confocal imaging of live BJ fibroblasts (senescent and control, both treated and non-treated) cells was performed using an inverted Leica TCS SP8 STED3X microscope, equipped with internal Hybrid (HyD) detectors and an acousto-optical tunable filter (AOTF) (Leica Microsystems CMS GmbH, Germany), a white light laser (WLL), and a 405 nm diode laser. Cells were seeded in μ-Slide 4 Well - a chambered coverslip with 4 wells (IBD-80426).
Imaging was performed with an HC PL APO 86×/1.20 NA water-immersion objective. Cells were imaged sequentially in two detection settings. In the first sequence, excitation was performed with the 592 nm WLL line, and emission was collected with the HyD detector from 610–705 nm (magenta channel). In the second sequence, excitation was performed with the 405 nm diode laser, and emission was collected with the HyD detector from 415–456 nm (cyan channel). Samples were imaged in xyz scan mode with bidirectional scanning at 600 Hz, at single z-planes. Images were acquired using the galvanometric scanner in 1976 × 1976 format (pixel size 68 nm), with a line average of 4, and a pinhole of 1 Airy unit (152.2 μm at 580 nm). Images were collected as single frames. Image visualization and processing were carried out using ImageJ (NIH).
Lipid droplet staining analysis
Lipid droplet accumulation was quantified using a custom Python script (scikit-image). For each image, the number of lipid droplet particles was determined and normalized to the cell count. Number of lipid droplets was corrected for clustering.
Mice
A mouse model of Alzheimer’s disease was used: heterozygous 5×FAD [60] transgenic mice (on a C57/BL6-SJL background), which express familial AD mutant forms of human APP (the Swedish mutation, K670N/M671L; the Florida mutation, I716V; and the London mutation, V717I), and PS1 (M146L/L286V) transgenes under transcriptional control of the neuron-specific mouse Thy-1 promoter (5×FAD line Tg6799, The Jackson Laboratory).
RNA purification, cDNA synthesis and quantitative real-time PCR analysis
Total RNA from BJ cells was extracted using a RNeasy mini kit (74104, QIAGEN), followed by DNase-I treatment. The expression of specific mRNAs was measured using fluorescence-based quantitative real-time PCR (rt–qPCR; Fast-SYBR PCR Master Mix, Applied Biosystems). cDNA was produced using random hexamers (N8080127, Thermo Fisher Scientific). The cDNA samples were amplified using Platinum SYBR Green qPCR SuperMix (11744-500, Life Technologies) in a QuantStudio™ 3 System. Relative expressions were normalized using the expression levels of HPRT. Quantification reactions were performed in duplicates for each sample using the ‘ΔΔCt’ method. Hypoxanthine phosphoribosyltransferase (HPRT) was chosen as a reference (housekeeping) gene.
| Gene | Forward | Reverse |
| Human ApoE | 5’-GGGTCGCTTTTGGGATTACCT | 5’-CAGTTGTTCCTCCAGTTCCGA |
| Human Plin2 | 5’-AACAACACGCCCCTCAACTG | 5’-TTATGCTCAGATCGCTGGGTC |
| Human IL-8 | 5’-GTCTGCTAGCCAGGATCCAC | 5’-GCTTCCACATGTCCTCACAA |
| Human HPRT | 5’-TGACACTGGCAAAACAATGCA | 5’-GGTCCTTTTCACCAGCAAGCT- |
Conjugation of metals to antibodies
Antibodies were conjugated to metals using the MIBItag Conjugation Kit (IONpath), according to the manufacturer’s protocols. Metals for conjugation were chosen to minimize noise and spillover between channels, according to guidelines in Han et al. [61]. A detailed list of antibodies used is provided in the supplementary materials (Supplementary Table 3).
CyTOF sample preparation
The single-cell suspensions of brain cells were stained by 1.25 μM Cell-ID cisplatin in Maxpar Cell Staining Buffer (Standard BioTools). Then, the samples were washed twice with Maxpar Cell Staining Buffer. Next, they were incubated with Fc-block CD16/32 (BD Biosciences; 10 min, room temperature), followed by incubation with the antibodies for extracellular markers (60 min, 4° C). The samples were fixed and resuspended with 4% formaldehyde (Pierce) for 10 min, and washed and kept on ice for 10 min. The cells were permeabilized using 90% methanol for 15 min on ice, blocked with 1% donkey serum and stained with antibodies for intracellular markers in buffer with 1% phosphatase inhibitor for 60 min at room temperature. Next, the samples were washed twice and kept in 4% formaldehyde (Pierce) with iridium (125 nM) at 4° C overnight. On the day of analysis, the samples were washed twice with Maxpar Cell Staining Buffer and then washed twice with Maxpar Cell Acquisition Solution Plus (Standard BioTools) before acquisition, using a CyTOF Helios system (Standard BioTools); before the reading, the cells were resuspended in 1:10 Four Element Calibration Beads in Maxpar Cell Acquisition Solution Plus solution (Standard BioTools) at a concentration of up to 300K cell/ml and filtered (35-μm nylon mesh). A detailed list of antibodies used is provided in the supplementary materials (Supplementary Table 3).
CyTOF data processing and analysis
CyTOF data underwent the following pre-processing before analyses. The CyTOF software by Standard BioTools was used to normalize and concatenate the acquired data. Then, gates were applied using the Cytobank platform (Beckman Coulter). First, the CD11b stable signal across time was gated and then the event length and the Gaussian residual parameters. Then, the beads were gated out using the 140Ce beads channel. Live single cells were gated using the cisplatin 195Pt and the iridium DNA label in 193Ir, and single cells were gated using the two channels for iridium. Lastly, we gated for CD45+cells. A representative sample illustrating the gating strategy is shown in Supplementary Figure 4.
The CyTOF data were analyzed using Cytobank and MATLAB. In Cytobank, CD45+cells were processed with equal sampling. The two-dimensional reduction was applied using the Cytobank ‘visne’ (Vi-distributed stochastic neighbour embedding (Vi-SNE)) method, and FlowSOM-based clustering was performed.
snRNA-seq analysis of data from Human Post-Mortem Brain
Single-nucleus RNA sequencing (snRNA-seq) data from post-mortem human Alzheimer’s disease patients and controls were analyzed to investigate LDs accumulation in senescent brain cells. Differential gene expression analysis was conducted, focusing on the expression of LDs markers in cells with “High” versus “Low” senescence scores. We obtained data from Zhou et al. [49], available on AD Knowledge Portal, this study provides single-nucleus transcriptomic data from the prefrontal cortex from individuals with TREM2 variants selected from the Religious Orders Study and Memory and Aging Project (ROSMAP). Details about sample processing and sequencing can be found in the original publication [49] and AD Knowledge Portal.
Data were uploaded into R version 4.4.1 and RStudio version 2024.04.2. Data handling and analysis were done using Seurat V5.0.2, and following SCTransform guidelines for integration, quality and normalization of data. All cells with less than 200 features or features appearing in less than 5 cells were removed. Cell annotations were assigned using combination of human brain maps from “DarmanisBrainData”, “DPollenGliaData”, “ZhongPrefrontalData” and “HumanPrimaryCellAtlasData” from “celldex” package. The best fitted annotation was assigned for each cell based on the annotation score and its UMAP coordinates proximity to other major brain cells. Odd and scarce cell annotations were removed, and microglial cell cluster was manually selected based on Supplementary Figure 3, using Seurat’s “CellSelector” function as shown in Supplementary Figure 5. These microglial cells cluster were the subject focused upon in the following analyses. Shortly, SCTransform, RunPCA (npcs = 30), FindNeighbors (dims = 1:30), FindClusters (resolution = 1) and RunUMAP (dims = 1:30) were executed on microglia cluster. Senescence score was assigned and composed for each cell based on CDKN1A, CDKN2A, and senescence related genes found in SenMayo [62], and in “cellular senescence” pathway in KEGG and Reactome databases. Senescence score was established using combination of “AddModuleScore” function and sum of CDKN1A and CDKN2A. First, for the “AddModuleScore” function, all genes, excluding CDKN1A and CDKN2A, found in KEGG and Reactome under “cellular senescence”, and SenMayo gene set were utilized to receive a module score of most genes related to cellular senescence. Second, another score of the sum of CDKN1A and CDKN2A expression levels was calculated, replacing zero value with 1. Then, multiplication of both scores was calculated for each cell to receive our cellular senescence scale. Figure 4A shows the UMAP representation of all brain single nucleus analysis from AD patients from Zhou et. al. [49] human brain dataset. Figure 4B are feature plots of CDKN1A, CDKN2A, Module score of other senescence related genes, and factorial distribution of “High” (≥99% of senescence scores), “Medium”, and “Low” (senescence score ≤ 0). Figure 4C, 4D were created using “EnhancedVolcano” package. Figure 4E, enrichment plot, was created using “enrichplot” and “clusterProfiler”.
Data availability
Human snRNA-seq data that support the findings of this study are available via the AD Knowledge Portal (https://adknowledgeportal.org) under studysnRNAseqAD_TREM2and are also accessible through https://doi.org/10.7303/syn21125841.
Supplementary Materials
Abbreviations
SnCs: Senescent cells; SASP: Senescence-Associated Secretory Phenotype; LDs: lipid droplets; AD: Alzheimer’s disease; DE: differentially expressed; TAG: Triacylglycerol; AMPK: AMP-activated protein kinase; CyTOF: Cytometry by Time of Flight; snRNA-seq: single-nucleus RNA sequencing; HPRT: Hypoxanthine phosphoribosyltransferase; Vi-SNE: Vi-distributed stochastic neighbour embedding.
Author Contributions
N.R.C., R.S., and V.K. planned the experiments. N.R.C. designed and performed the in vivo experiment as well and RT-PCR for in vitro studies. R.S. designed and conducted most of the in vitro studies. S.P. performed the immunostaining analysis. B.D. analyzed the metabolomic data. H.A. analyzed the single-nucleus RNA-seq data. U.C. contributed to experimental execution. M.I. and S.M. performed metabolomic profiling and conducted preliminary data processing, including normalization of the raw output from the instrument. B.K. and N.R.C. conducted and analyzed the RT-PCR experiments. T.M.S supported the mass cytometry experiments. G.I. performed image acquisition. N.R.C. coordinated the work among all contributing authors and collected the data. N.R.C. and V.K. wrote the manuscript. V.K. supervised the study. All authors read and approved the final version.
Acknowledgements
We sincerely thank all members of the Krizhanovsky laboratory for helpful discussions. We thank Ayelet Erez for her helpful comments and thoughtful review of the manuscript. We thank Daniel Deitch for reviewing the MATLAB code. This study was supported by the grants from the European Research Council H2020 SyG program (no. 856487), the ISF (no. 1626/20), the Deutsche Forschungsgemeinschaft (CRC 1506), the Weizmann Benoziyo Center for Neurological Diseases and the Sagol Institutes for Longevity Research and Aging Brain, SABRA Yeda-Sela program (given to V.K.). V.K. is a Director of EKARD Institute for Cancer Diagnosis Research. S.M.’s and M.I.’s work was supported by the Vera and John Schwartz Family Center for Metabolic Biology. Optical imaging data was acquired at the de Picciotto Cancer Cell Observatory, in the memory of Wolfgang and Ruth Lesser of the Moross Integrated Cancer Center. The results published here are in whole or in part based on data obtained from the AD Knowledge Portal (https://adknowledgeportal.org). The data available in the AD Knowledge Portal would not be possible without the participation of research volunteers and the contribution of data by collaborating researchers.
Conflicts of Interest
The authors declare that they have no conflicts of interest.
Ethical Statement and Consent
All animal experiments were conducted in strict accordance with the Israeli Animal Welfare Act (Experiments on Animals, 1994) and were approved by the Institutional Animal Care and Use Committee (IACUC) of the Weizmann Institute of Science, under the authorization of the Council for Experiments on Animals. The animal study was approved under application number 00420121-2 (Principal Investigator: Valery Krizhanovsky). All procedures were designed to minimize animal suffering and to reduce the number of animals used.
The results published here are in whole or in part based on data obtained from the AD Knowledge Portal (https://adknowledgeportal.org). The data available in the AD Knowledge Portal would not be possible without the participation of research volunteers and the contribution of data by collaborating researchers. Human single-nucleus RNA-sequencing (snRNA-seq) data supporting the findings of this study are available via the AD Knowledge Portal under the study snRNAseqAD_TREM2 and are also accessible through https://doi.org/10.7303/syn21125841. All human data were generated and shared by the original studies in accordance with the relevant ethical regulations and with informed consent obtained by the contributing investigators.
Funding
This study was supported by the grants from the European Research Council H2020 SyG program (no. 856487), the ISF (no. 1626/20), the Deutsche Forschungsgemeinschaft (CRC 1506), the Weizmann Benoziyo Center for Neurological Diseases and the Sagol Institutes for Longevity Research and Aging Brain, SABRA Yeda-Sela program (given to V.K.). S.M.’s and M.I.’s work was supported by the Vera and John Schwartz Family Center for Metabolic Biology.
References
- 1. Gorgoulis V, Adams PD, Alimonti A, Bennett DC, Bischof O, Bishop C, Campisi J, Collado M, Evangelou K, Ferbeyre G, Gil J, Hara E, Krizhanovsky V, et al. Cellular Senescence: Defining a Path Forward. Cell. 2019; 179:813–27. https://doi.org/10.1016/j.cell.2019.10.005 [PubMed]
- 2. Herranz N, Gil J. Mechanisms and functions of cellular senescence. J Clin Invest. 2018; 128:1238–46. https://doi.org/10.1172/JCI95148 [PubMed]
- 3. Ogrodnik M, Carlos Acosta J, Adams PD, d'Adda di Fagagna F, Baker DJ, Bishop CL, Chandra T, Collado M, Gil J, Gorgoulis V, Gruber F, Hara E, Jansen-Dürr P, et al. Guidelines for minimal information on cellular senescence experimentation in vivo. Cell. 2024; 187:4150–75. https://doi.org/10.1016/j.cell.2024.05.059 [PubMed]
- 4. Serrano M, Lin AW, McCurrach ME, Beach D, Lowe SW. Oncogenic ras provokes premature cell senescence associated with accumulation of p53 and p16INK4a. Cell. 1997; 88:593–602. https://doi.org/10.1016/s0092-8674(00)81902-9 [PubMed]
- 5. Krizhanovsky V, Yon M, Dickins RA, Hearn S, Simon J, Miething C, Yee H, Zender L, Lowe SW. Senescence of activated stellate cells limits liver fibrosis. Cell. 2008; 134:657–67. https://doi.org/10.1016/j.cell.2008.06.049 [PubMed]
- 6. Demaria M, Ohtani N, Youssef SA, Rodier F, Toussaint W, Mitchell JR, Laberge RM, Vijg J, Van Steeg H, Dollé ME, Hoeijmakers JH, de Bruin A, Hara E, Campisi J. An essential role for senescent cells in optimal wound healing through secretion of PDGF-AA. Dev Cell. 2014; 31:722–33. https://doi.org/10.1016/j.devcel.2014.11.012 [PubMed]
- 7. Jun JI, Lau LF. The matricellular protein CCN1 induces fibroblast senescence and restricts fibrosis in cutaneous wound healing. Nat Cell Biol. 2010; 12:676–85. https://doi.org/10.1038/ncb2070 [PubMed]
- 8. Krizhanovsky V, Lowe SW. Stem cells: The promises and perils of p53. Nature. 2009; 460:1085–6. https://doi.org/10.1038/4601085a [PubMed]
- 9. Gal H, Lysenko M, Stroganov S, Vadai E, Youssef SA, Tzadikevitch-Geffen K, Rotkopf R, Biron-Shental T, de Bruin A, Neeman M, Krizhanovsky V. Molecular pathways of senescence regulate placental structure and function. EMBO J. 2019; 38:e100849. https://doi.org/10.15252/embj.2018100849 [PubMed]
- 10. Storer M, Mas A, Robert-Moreno A, Pecoraro M, Ortells MC, Di Giacomo V, Yosef R, Pilpel N, Krizhanovsky V, Sharpe J, Keyes WM. Senescence is a developmental mechanism that contributes to embryonic growth and patterning. Cell. 2013; 155:1119–30. https://doi.org/10.1016/j.cell.2013.10.041 [PubMed]
- 11. Muñoz-Espín D, Cañamero M, Maraver A, Gómez-López G, Contreras J, Murillo-Cuesta S, Rodríguez-Baeza A, Varela-Nieto I, Ruberte J, Collado M, Serrano M. Programmed cell senescence during mammalian embryonic development. Cell. 2013; 155:1104–18. https://doi.org/10.1016/j.cell.2013.10.019 [PubMed]
- 12. Coppé JP, Patil CK, Rodier F, Sun Y, Muñoz DP, Goldstein J, Nelson PS, Desprez PY, Campisi J. Senescence-associated secretory phenotypes reveal cell-nonautonomous functions of oncogenic RAS and the p53 tumor suppressor. PLoS Biol. 2008; 6:2853–68. https://doi.org/10.1371/journal.pbio.0060301 [PubMed]
- 13. Sagiv A, Bar-Shai A, Levi N, Hatzav M, Zada L, Ovadya Y, Roitman L, Manella G, Regev O, Majewska J, Vadai E, Eilam R, Feigelson SW, et al. p53 in Bronchial Club Cells Facilitates Chronic Lung Inflammation by Promoting Senescence. Cell Rep. 2018; 22:3468–79. https://doi.org/10.1016/j.celrep.2018.03.009 [PubMed]
- 14. Schafer MJ, White TA, Iijima K, Haak AJ, Ligresti G, Atkinson EJ, Oberg AL, Birch J, Salmonowicz H, Zhu Y, Mazula DL, Brooks RW, Fuhrmann-Stroissnigg H, et al. Cellular senescence mediates fibrotic pulmonary disease. Nat Commun. 2017; 8:14532. https://doi.org/10.1038/ncomms14532 [PubMed]
- 15. Childs BG, Baker DJ, Wijshake T, Conover CA, Campisi J, van Deursen JM. Senescent intimal foam cells are deleterious at all stages of atherosclerosis. Science. 2016; 354:472–7. https://doi.org/10.1126/science.aaf6659 [PubMed]
- 16. Bussian TJ, Aziz A, Meyer CF, Swenson BL, van Deursen JM, Baker DJ. Clearance of senescent glial cells prevents tau-dependent pathology and cognitive decline. Nature. 2018; 562:578–82. https://doi.org/10.1038/s41586-018-0543-y [PubMed]
- 17. Rachmian N, Medina S, Cherqui U, Akiva H, Deitch D, Edilbi D, Croese T, Salame TM, Ramos JM, Cahalon L, Krizhanovsky V, Schwartz M. Identification of senescent, TREM2-expressing microglia in aging and Alzheimer's disease model mouse brain. Nat Neurosci. 2024; 27:1116–24. https://doi.org/10.1038/s41593-024-01620-8 [PubMed]
- 18. Hu Y, Fryatt GL, Ghorbani M, Obst J, Menassa DA, Martin-Estebane M, Muntslag TA, Olmos-Alonso A, Guerrero-Carrasco M, Thomas D, Cragg MS, Gomez-Nicola D. Replicative senescence dictates the emergence of disease-associated microglia and contributes to Aβ pathology. Cell Rep. 2021; 35:109228. https://doi.org/10.1016/j.celrep.2021.109228 [PubMed]
- 19. James EL, Michalek RD, Pitiyage GN, de Castro AM, Vignola KS, Jones J, Mohney RP, Karoly ED, Prime SS, Parkinson EK. Senescent human fibroblasts show increased glycolysis and redox homeostasis with extracellular metabolomes that overlap with those of irreparable DNA damage, aging, and disease. J Proteome Res. 2015; 14:1854–71. https://doi.org/10.1021/pr501221g [PubMed]
- 20. Miwa S, Kashyap S, Chini E, von Zglinicki T. Mitochondrial dysfunction in cell senescence and aging. J Clin Invest. 2022; 132:e158447. https://doi.org/10.1172/JCI158447 [PubMed]
- 21. Zheng L, Cardaci S, Jerby L, MacKenzie ED, Sciacovelli M, Johnson TI, Gaude E, King A, Leach JD, Edrada-Ebel R, Hedley A, Morrice NA, Kalna G, et al. Fumarate induces redox-dependent senescence by modifying glutathione metabolism. Nat Commun. 2015; 6:6001. https://doi.org/10.1038/ncomms7001 [PubMed]
- 22. Takebayashi S, Tanaka H, Hino S, Nakatsu Y, Igata T, Sakamoto A, Narita M, Nakao M. Retinoblastoma protein promotes oxidative phosphorylation through upregulation of glycolytic genes in oncogene-induced senescent cells. Aging Cell. 2015; 14:689–97. https://doi.org/10.1111/acel.12351 [PubMed]
- 23. Moiseeva O, Bourdeau V, Roux A, Deschênes-Simard X, Ferbeyre G. Mitochondrial dysfunction contributes to oncogene-induced senescence. Mol Cell Biol. 2009; 29:4495–507. https://doi.org/10.1128/MCB.01868-08 [PubMed]
- 24. Dörr JR, Yu Y, Milanovic M, Beuster G, Zasada C, Däbritz JH, Lisec J, Lenze D, Gerhardt A, Schleicher K, Kratzat S, Purfürst B, Walenta S, et al. Synthetic lethal metabolic targeting of cellular senescence in cancer therapy. Nature. 2013; 501:421–5. https://doi.org/10.1038/nature12437 [PubMed]
- 25. Flor AC, Wolfgeher D, Wu D, Kron SJ. A signature of enhanced lipid metabolism, lipid peroxidation and aldehyde stress in therapy-induced senescence. Cell Death Discov. 2017; 3:17075. https://doi.org/10.1038/cddiscovery.2017.75 [PubMed]
- 26. Zeng Q, Gong Y, Zhu N, Shi Y, Zhang C, Qin L. Lipids and lipid metabolism in cellular senescence: Emerging targets for age-related diseases. Ageing Res Rev. 2024; 97:102294. https://doi.org/10.1016/j.arr.2024.102294 [PubMed]
- 27. Olzmann JA, Carvalho P. Dynamics and functions of lipid droplets. Nat Rev Mol Cell Biol. 2019; 20:137–55. https://doi.org/10.1038/s41580-018-0085-z [PubMed]
- 28. Zadoorian A, Du X, Yang H. Lipid droplet biogenesis and functions in health and disease. Nat Rev Endocrinol. 2023; 19:443–59. https://doi.org/10.1038/s41574-023-00845-0 [PubMed]
- 29. Geltinger F, Schartel L, Wiederstein M, Tevini J, Aigner E, Felder TK, Rinnerthaler M. Friend or Foe: Lipid Droplets as Organelles for Protein and Lipid Storage in Cellular Stress Response, Aging and Disease. Molecules. 2020; 25:5053. https://doi.org/10.3390/molecules25215053 [PubMed]
- 30. Cruz AL, Barreto EA, Fazolini NP, Viola JP, Bozza PT. Lipid droplets: platforms with multiple functions in cancer hallmarks. Cell Death Dis. 2020; 11:105. https://doi.org/10.1038/s41419-020-2297-3 [PubMed]
- 31. Zhang J, Peng J, Wang S, Wang L, Sun Y, Xia J, Cheng B, Hu Q. Perilipin2-dependent lipid droplets accumulation promotes metastasis of oral squamous cell carcinoma via epithelial-mesenchymal transition. Cell Death Discov. 2025; 11:30. https://doi.org/10.1038/s41420-025-02314-1 [PubMed]
- 32. Liu HJ, Miao H, Yang JZ, Liu F, Cao G, Zhao YY. Deciphering the role of lipoproteins and lipid metabolic alterations in ageing and ageing-associated renal fibrosis. Ageing Res Rev. 2023; 85:101861. https://doi.org/10.1016/j.arr.2023.101861 [PubMed]
- 33. Talari NK, Mattam U, Meher NK, Paripati AK, Mahadev K, Krishnamoorthy T, Sepuri NB. Lipid-droplet associated mitochondria promote fatty-acid oxidation through a distinct bioenergetic pattern in male Wistar rats. Nat Commun. 2023; 14:766. https://doi.org/10.1038/s41467-023-36432-0 [PubMed]
- 34. Rachmian N, Krizhanovsky V. Senescent cells in the brain and where to find them. FEBS J. 2023; 290:1256–66. https://doi.org/10.1111/febs.16649 [PubMed]
- 35. Ogrodnik M, Evans SA, Fielder E, Victorelli S, Kruger P, Salmonowicz H, Weigand BM, Patel AD, Pirtskhalava T, Inman CL, Johnson KO, Dickinson SL, Rocha A, et al. Whole-body senescent cell clearance alleviates age-related brain inflammation and cognitive impairment in mice. Aging Cell. 2021; 20:e13296. https://doi.org/10.1111/acel.13296 [PubMed]
- 36. Marschallinger J, Iram T, Zardeneta M, Lee SE, Lehallier B, Haney MS, Pluvinage JV, Mathur V, Hahn O, Morgens DW, Kim J, Tevini J, Felder TK, et al. Lipid-droplet-accumulating microglia represent a dysfunctional and proinflammatory state in the aging brain. Nat Neurosci. 2020; 23:194–208. https://doi.org/10.1038/s41593-019-0566-1 [PubMed]
- 37. Haney MS, Pálovics R, Munson CN, Long C, Johansson PK, Yip O, Dong W, Rawat E, West E, Schlachetzki JC, Tsai A, Guldner IH, Lamichhane BS, et al. APOE4/4 is linked to damaging lipid droplets in Alzheimer's disease microglia. Nature. 2024; 628:154–61. https://doi.org/10.1038/s41586-024-07185-7 [PubMed]
- 38. Arbaizar-Rovirosa M, Pedragosa J, Lozano JJ, Casal C, Pol A, Gallizioli M, Planas AM. Aged lipid-laden microglia display impaired responses to stroke. EMBO Mol Med. 2023; 15:e17175. https://doi.org/10.15252/emmm.202217175 [PubMed]
- 39. Farmer BC, Walsh AE, Kluemper JC, Johnson LA. Lipid Droplets in Neurodegenerative Disorders. Front Neurosci. 2020; 14:742. https://doi.org/10.3389/fnins.2020.00742 [PubMed]
- 40. Prakash P, Manchanda P, Paouri E, Bisht K, Sharma K, Rajpoot J, Wendt V, Hossain A, Wijewardhane PR, Randolph CE, Chen Y, Stanko S, Gasmi N, et al. Amyloid-β induces lipid droplet-mediated microglial dysfunction via the enzyme DGAT2 in Alzheimer's disease. Immunity. 2025; 58:1536–52.e8. https://doi.org/10.1016/j.immuni.2025.04.029 [PubMed]
- 41. Alzheimer A, Stelzmann RA, Schnitzlein HN, Murtagh FR. An English translation of Alzheimer's 1907 paper, “Uber eine eigenartige Erkankung der Hirnrinde”. Clin Anat. 1995; 8:429–31. https://doi.org/10.1002/ca.980080612 [PubMed]
- 42. Alzheimer A. Uber Eine Eigenartige Erkrankung Der Hirnrinde. All Z Psychiatr. 1907; 64:146–8. https://www.scirp.org/reference/referencespapers?referenceid=2586331.
- 43. Yosef R, Pilpel N, Papismadov N, Gal H, Ovadya Y, Vadai E, Miller S, Porat Z, Ben-Dor S, Krizhanovsky V. p21 maintains senescent cell viability under persistent DNA damage response by restraining JNK and caspase signaling. EMBO J. 2017; 36:2280–95. https://doi.org/10.15252/embj.201695553 [PubMed]
- 44. Cosentino C, Grieco D, Costanzo V. ATM activates the pentose phosphate pathway promoting anti-oxidant defence and DNA repair. EMBO J. 2011; 30:546–55. https://doi.org/10.1038/emboj.2010.330 [PubMed]
- 45. Yang X, Sheng W, Sun GY, Lee JC. Effects of fatty acid unsaturation numbers on membrane fluidity and α-secretase-dependent amyloid precursor protein processing. Neurochem Int. 2011; 58:321–9. https://doi.org/10.1016/j.neuint.2010.12.004 [PubMed]
- 46. Burton DG, Krizhanovsky V. Physiological and pathological consequences of cellular senescence. Cell Mol Life Sci. 2014; 71:4373–86. https://doi.org/10.1007/s00018-014-1691-3 [PubMed]
- 47. Hardie DG. AMP-activated protein kinase: maintaining energy homeostasis at the cellular and whole-body levels. Annu Rev Nutr. 2014; 34:31–55. https://doi.org/10.1146/annurev-nutr-071812-161148 [PubMed]
- 48. Li Y, Munoz-Mayorga D, Nie Y, Kang N, Tao Y, Lagerwall J, Pernaci C, Curtin G, Coufal NG, Mertens J, Shi L, Chen X. Microglial lipid droplet accumulation in tauopathy brain is regulated by neuronal AMPK. Cell Metab. 2024; 36:1351–70.e8. https://doi.org/10.1016/j.cmet.2024.03.014 [PubMed]
- 49. Zhou Y, Song WM, Andhey PS, Swain A, Levy T, Miller KR, Poliani PL, Cominelli M, Grover S, Gilfillan S, Cella M, Ulland TK, Zaitsev K, et al. Human and mouse single-nucleus transcriptomics reveal TREM2-dependent and TREM2-independent cellular responses in Alzheimer's disease. Nat Med. 2020; 26:131–42. https://doi.org/10.1038/s41591-019-0695-9 [PubMed]
- 50. Jin C, Yuan P. Implications of lipid droplets in lung cancer: Associations with drug resistance. Oncol Lett. 2020; 20:2091–104. https://doi.org/10.3892/ol.2020.11769 [PubMed]
- 51. Engin A. Lipid Storage, Lipolysis, and Lipotoxicity in Obesity. Adv Exp Med Biol. 2024; 1460:97–129. https://doi.org/10.1007/978-3-031-63657-8_4 [PubMed]
- 52. Zhao X, Zhang S, Sanders AR, Duan J. Brain Lipids and Lipid Droplet Dysregulation in Alzheimer's Disease and Neuropsychiatric Disorders. Complex Psychiatry. 2023; 9:154–71. https://doi.org/10.1159/000535131 [PubMed]
- 53. Depp C, Sun T, Sasmita AO, Spieth L, Berghoff SA, Nazarenko T, Overhoff K, Steixner-Kumar AA, Subramanian S, Arinrad S, Ruhwedel T, Möbius W, Göbbels S, et al. Myelin dysfunction drives amyloid-β deposition in models of Alzheimer's disease. Nature. 2023; 618:349–57. https://doi.org/10.1038/s41586-023-06120-6 [PubMed]
- 54. Bartzokis G. Age-related myelin breakdown: a developmental model of cognitive decline and Alzheimer's disease. Neurobiol Aging. 2004; 25:5–18. https://doi.org/10.1016/j.neurobiolaging.2003.03.001 [PubMed]
- 55. Loix M, Wouters E, Vanherle S, Dehairs J, McManaman JL, Kemps H, Swinnen JV, Haidar M, Bogie JF, Hendriks JJ. Perilipin-2 limits remyelination by preventing lipid droplet degradation. Cell Mol Life Sci. 2022; 79:515. https://doi.org/10.1007/s00018-022-04547-0 [PubMed]
- 56. McNamara NB, Munro DAD, Bestard-Cuche N, Uyeda A, Bogie JFJ, Hoffmann A, Holloway RK, Molina-Gonzalez I, Askew KE, Mitchell S, Mungall W, Dodds M, Dittmayer C, et al. Microglia regulate central nervous system myelin growth and integrity. Nature. 2023;613:120–9. https://doi.org/10.1038/s41586-022-05534-y [PubMed] Erratum in: Nature. 2024; 631:E11. DOI: 10.1038/s41586-024-07696-3 PMID:38961305.
- 57. Malitsky S, Ziv C, Rosenwasser S, Zheng S, Schatz D, Porat Z, Ben-Dor S, Aharoni A, Vardi A. Viral infection of the marine alga Emiliania huxleyi triggers lipidome remodeling and induces the production of highly saturated triacylglycerol. New Phytol. 2016; 210:88–96. https://doi.org/10.1111/nph.13852 [PubMed]
- 58. Pang Z, Lu Y, Zhou G, Hui F, Xu L, Viau C, Spigelman AF, MacDonald PE, Wishart DS, Li S, Xia J. MetaboAnalyst 6.0: towards a unified platform for metabolomics data processing, analysis and interpretation. Nucleic Acids Res. 2024; 52:W398–406. https://doi.org/10.1093/nar/gkae253 [PubMed]
- 59. Alabed HB, Mancini DF, Buratta S, Calzoni E, Giacomo DD, Emiliani C, Martino S, Urbanelli L, Pellegrino RM. LipidOne 2.0: A Web Tool for Discovering Biological Meanings Hidden in Lipidomic Data. Curr Protoc. 2024; 4:e70009. https://doi.org/10.1002/cpz1.70009 [PubMed]
- 60. Oakley H, Cole SL, Logan S, Maus E, Shao P, Craft J, Guillozet-Bongaarts A, Ohno M, Disterhoft J, Van Eldik L, Berry R, Vassar R. Intraneuronal beta-amyloid aggregates, neurodegeneration, and neuron loss in transgenic mice with five familial Alzheimer's disease mutations: potential factors in amyloid plaque formation. J Neurosci. 2006; 26:10129–40. https://doi.org/10.1523/JNEUROSCI.1202-06.2006 [PubMed]
- 61. Han G, Spitzer MH, Bendall SC, Fantl WJ, Nolan GP. Metal-isotope-tagged monoclonal antibodies for high-dimensional mass cytometry. Nat Protoc. 2018; 13:2121–48. https://doi.org/10.1038/s41596-018-0016-7 [PubMed]
- 62. Saul D, Kosinsky RL, Atkinson EJ, Doolittle ML, Zhang X, LeBrasseur NK, Pignolo RJ, Robbins PD, Niedernhofer LJ, Ikeno Y, Jurk D, Passos JF, Hickson LJ, et al. A new gene set identifies senescent cells and predicts senescence-associated pathways across tissues. Nat Commun. 2022; 13:4827. https://doi.org/10.1038/s41467-022-32552-1 [PubMed]