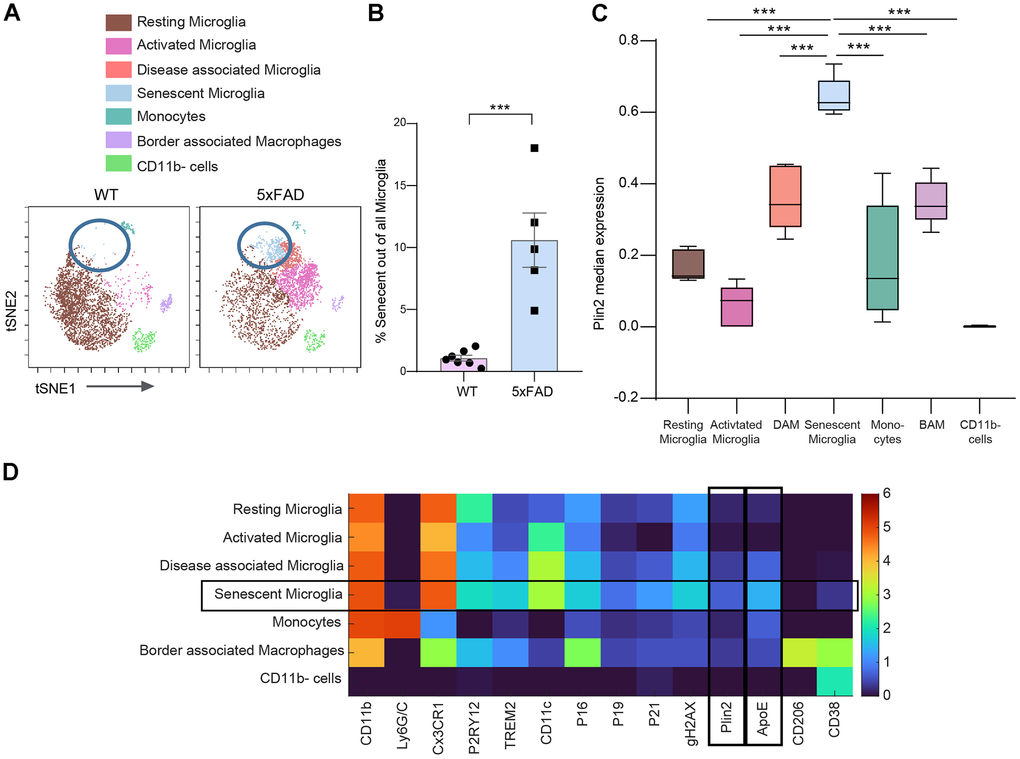
Figure 3.Senescent microglia accumulate LDs. Mass cytometry analysis was performed on brain tissue from wild-type (WT) mice (female (n = 4), male (n = 3), 10.9-13.3-month-old), and 5xFAD mice (females (n = 2), males (n = 3), 10.9-11.6-month-old). (A) Representative t-distributed Stochastic Neighbor Embedding (t-SNE) plots visualizing CD45+ cells (n = 39,504; 3,292 cells per sample) from each experimental group, with colors indicating FlowSOM-guided cell clusters. (B) Quantification of the percentage of senescent microglia within the total microglia population (Two-tailed Student’s t-test, P = 0.0112). (C) Feature plot showing the expression levels of Plin2 across the t-SNE clusters within the 5xFAD mouse group. (D) Heatmap displaying median marker expression values across the identified cell populations (average profile of n = 5; 5xFAD mice). *P<0.05, **P<0.005, ***P<0.0005; data represent mean ± SEM).