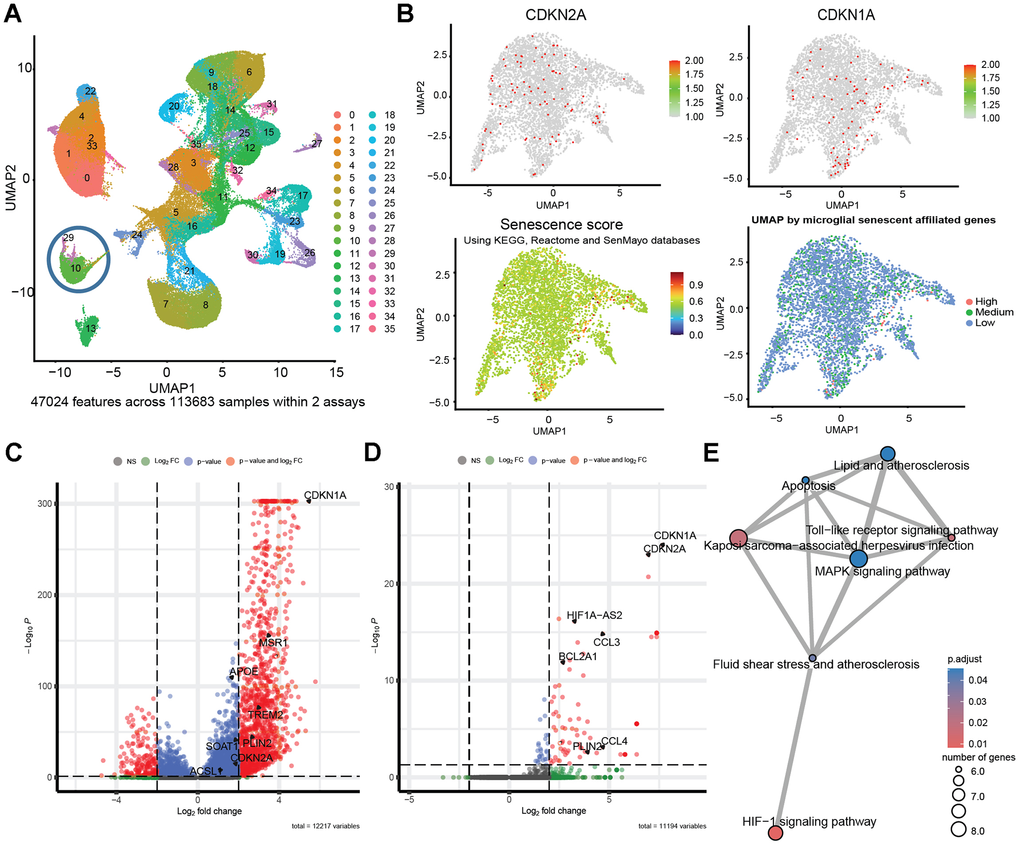
Figure 4.Human senescent brain cells accumulate LDs. Analysis of published single-nucleus RNA sequencing (snRNA-seq) data from post-mortem human Alzheimer’s patients and controls showing 35 clusters from 11 people with AD carrying TREM2-CV, 10 carrying TREM2-R62H and 11 non-AD controls [49]. (A) UMAP clusters generated by SCTransform. (B) Microglia cluster feature plots of CDKN2A, CDKN1A, module score of senescence related genes; components leading to the assembly of senescence score, and factorial distribution of senescence score (“High” ≥ 99%, “Low” ≤ 0). Senescence score (snRNA-seq) was calculated per nucleus. Per nucleus we combined (i) a Seurat AddModuleScore based on KEGG and Reactome “cellular senescence” plus SenMayo genes (excluding CDKN1A/CDKN2A) and (ii) CDKN1A + CDKN2A expression (zeros set to 1). The final score is the product of (i) and (ii). (C) Volcano plot of Differentially Expressed Genes (DEG) between all brain cells with “High” and “Low” senescent scores. (D) Detailed analysis of DEG in “High” versus “Low” senescence score cells within the microglia cluster, emphasizing the upregulation of Plin2 in senescent microglial cells. (E) Enrichment plot displaying relationship between enriched pathways in a network.