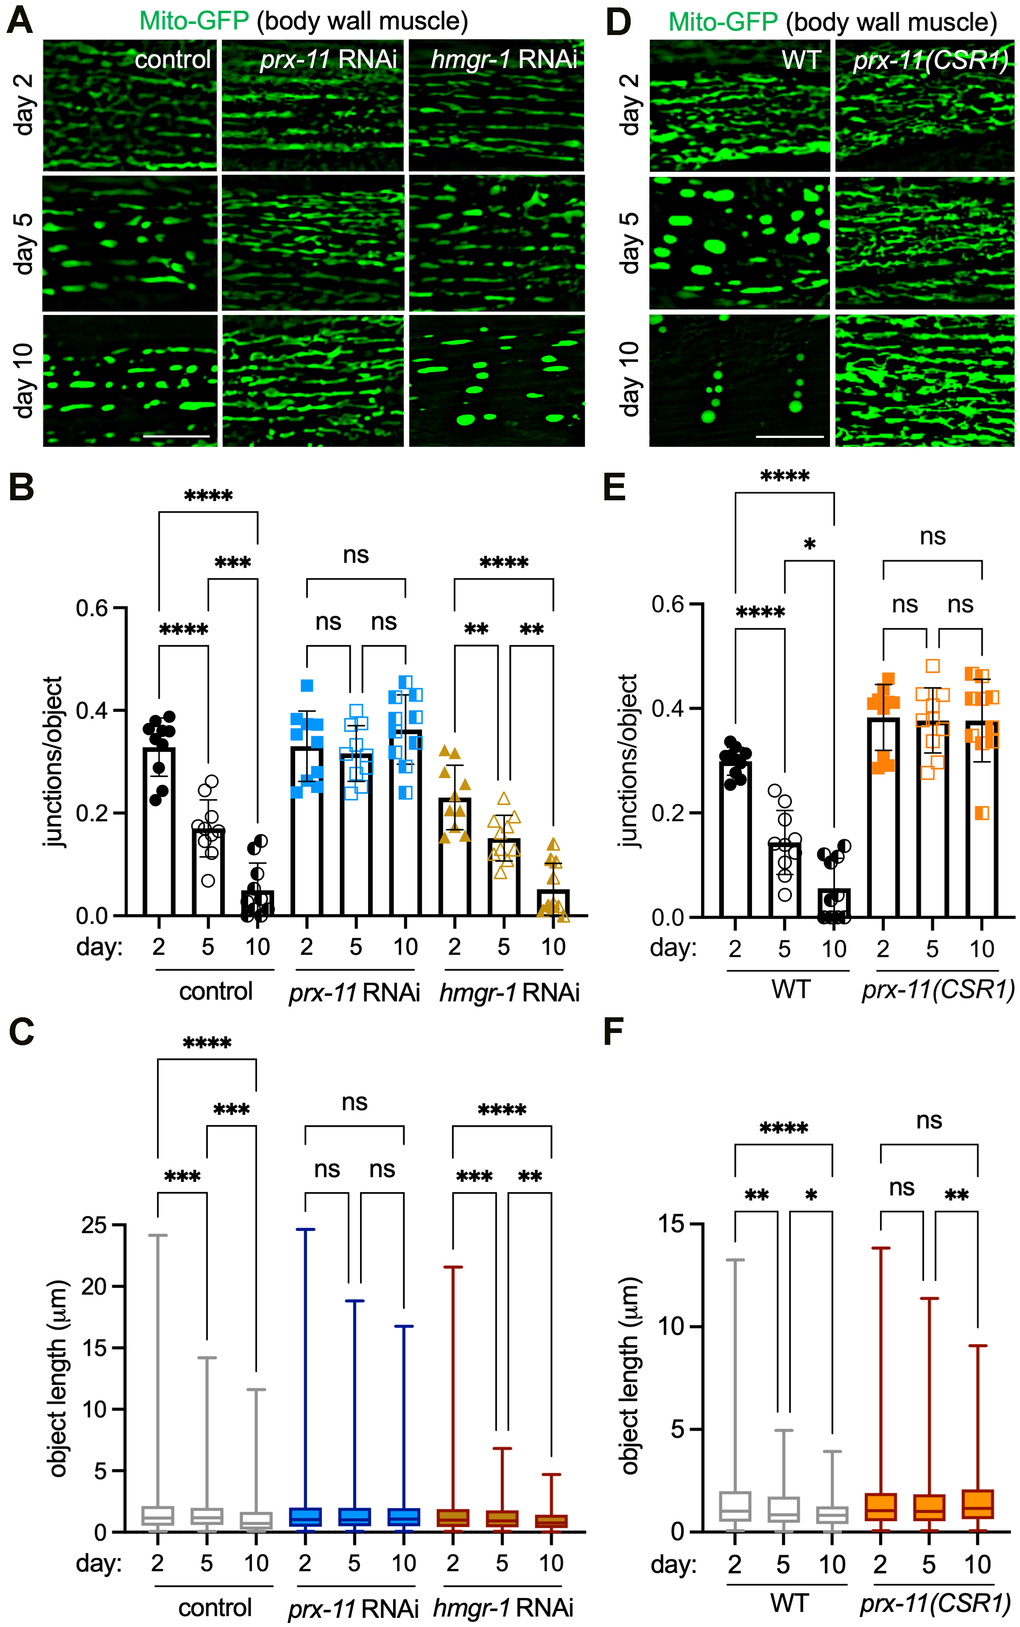
Figure 1.prx-11 depletion maintains mitochondrial junctions and network morphology in aging C. elegans. (A) Representative images of Mito-GFP in body wall muscle of day 2, day 5, and day 10 adult hermaphrodite animals fed either control, prx-11, or hmgr-1 RNAi. (B) Quantification of mitochondrial junctions per object in day 2, day 5, and day 10 adult hermaphrodite animals fed either control, prx-11, or hmgr-1 RNAi (n = 10 worms per condition). Data are presented as mean ± SD. ****, p ≤ 0.0001; ***, p ≤ 0.001; **, p ≤ 0.01; ns, not significant. One-way ANOVA with Tukey’s multiple comparisons. (C) Mito-GFP object lengths in day 2, day 5, and day 10 adult hermaphrodite animals fed either control, prx-11, or hmgr-1 RNAi (n = 10 worms per condition). Data are presented as box-and-whisker plots (minimum, 25th percentile, median, 75th percentile, maximum). ****, p ≤ 0.0001; ***, p ≤ 0.001; **, p ≤ 0.01; ns, not significant. One-way ANOVA with Tukey’s multiple comparisons. (D) Representative images of Mito-GFP in body wall muscle of day 2, day 5, and day 10 adult wild-type and prx-11(CSR1) hermaphrodite animals. (E) Quantification of mitochondrial junctions per object in day 2, day 5, and day 10 adult wild-type and prx-11(CSR1) hermaphrodite animals (n = 10 worms per condition). Data are presented as mean ± SD. ****, p ≤ 0.0001; *, p ≤ 0.05; ns, not significant. One-way ANOVA with Tukey’s multiple comparisons. (F) Mito-GFP object lengths in day 2, day 5, and day 10 adult wild-type and prx-11(CSR1) hermaphrodite animals (n = 10 worms per condition). Data are presented as box-and-whisker plots (minimum, 25th percentile, median, 75th percentile, maximum). ****, p ≤ 0.0001; **, p ≤ 0.01; *, p ≤ 0.05; ns, not significant. One-way ANOVA with Tukey’s multiple comparisons. Bars: 10 μm.