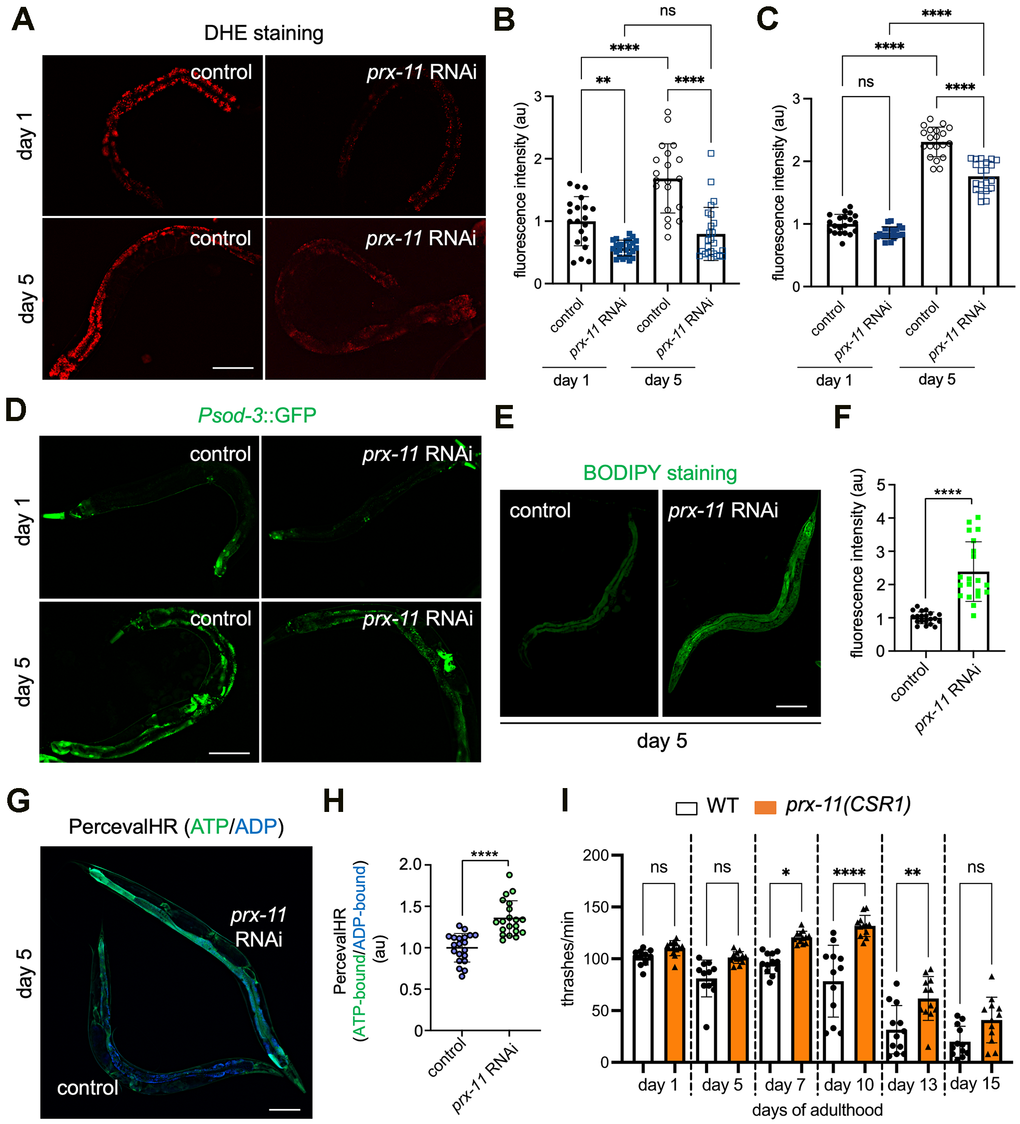
Figure 3.Animals having prx-11 loss of function display attenuated oxidative stress along with enhancements to fat stores, ATP/ADP ratios, and motor function during aging. (A) Representative images of DHE-stained day 1 and day 5 adult hermaphrodite animals fed either control or prx-11 RNAi. (B) Quantification of DHE staining fluorescence intensities in day 1 and day 5 adult hermaphrodite animals fed either control or prx-11 RNAi (n = 20 worms per condition). Data are presented as mean ± SD. ****, p ≤ 0.0001; **, p ≤ 0.01; ns, not significant. One-way ANOVA with Tukey’s multiple comparisons. (C) Quantification of Psod-3::GFP fluorescence intensities in day 1 and day 5 adult hermaphrodite animals fed either control or prx-11 RNAi (n = 20 worms per condition). Data are presented as mean ± SD. ****, p ≤ 0.0001; ns, not significant. One-way ANOVA with Tukey’s multiple comparisons. (D) Representative images of Psod-3::GFP in day 1 and day 5 adult hermaphrodite animals fed either control or prx-11 RNAi. (E) Representative images of BODIPY-stained day 5 adult hermaphrodite animals fed either control or prx-11 RNAi. (F) Quantification of BODIPY staining fluorescence intensities in day 5 adult hermaphrodite animals fed either control or prx-11 RNAi (n = 20 worms per condition). Data are presented as mean ± SD. ****, p ≤ 0.0001. Unpaired t-test. (G) Representative merged image of ATP-bound (colored green) and ADP-bound (colored blue) PercevalHR in day 5 adult hermaphrodite animals fed either control or prx-11 RNAi. (H) Quantification of ATP-bound:ADP-bound PercevalHR in day 5 adult hermaphrodite animals fed either control or prx-11 RNAi (n = 20 worms per condition). Data are presented as mean ± SD. ****, p ≤ 0.0001. Unpaired t-test. (I) Quantification of thrashing rates in adult wild-type and prx-11(CSR1) hermaphrodite animals from day 1 through day 15 of adulthood (n = 12 worms per condition). Data are presented as mean ± SD. ****, p ≤ 0.0001; **, p ≤ 0.01; *, p ≤ 0.05; ns, not significant. One-way ANOVA with Tukey’s multiple comparisons. Bars: 100 μm.