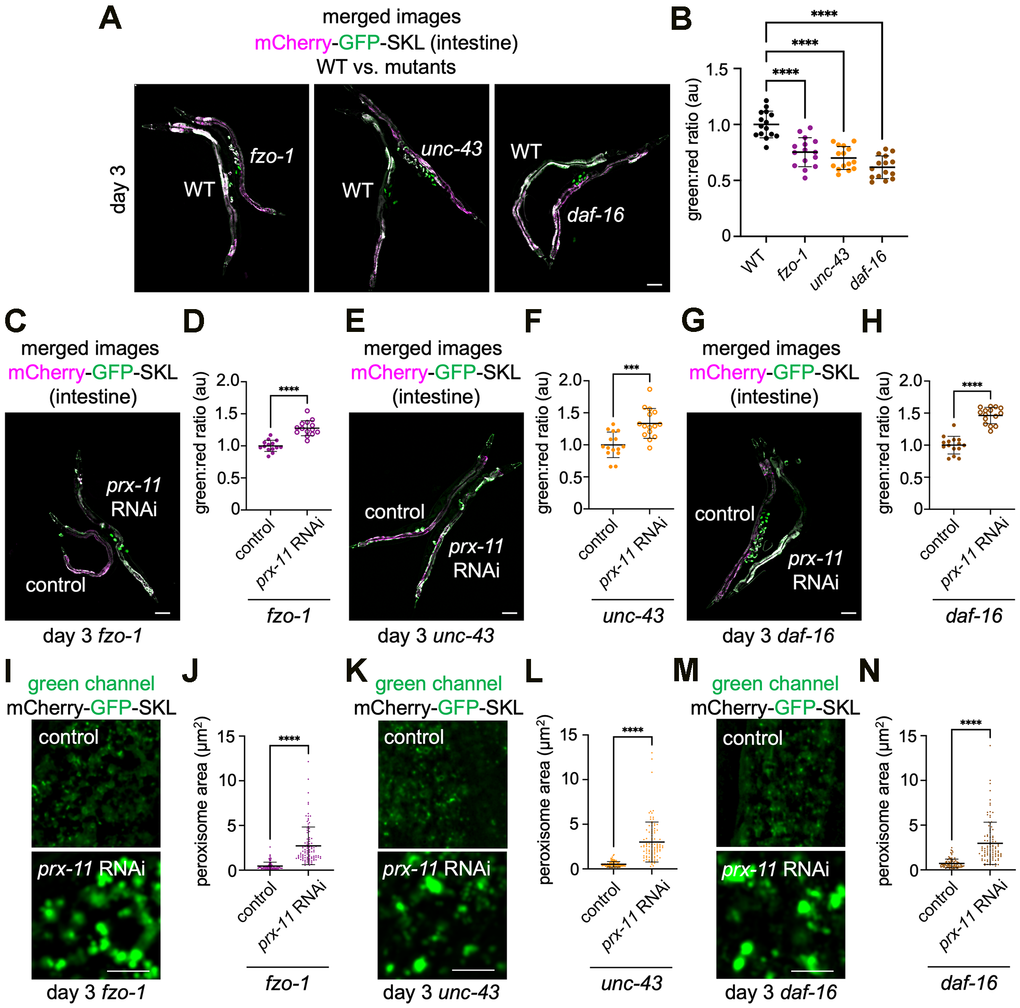
Figure 5.Accelerated pexophagy occurs in fzo-1, unc-43, and daf-16 mutant backgrounds but is suppressed by prx-11 knockdown. (A) Representative merged green and red fluorescence images of the mCherry-GFP-SKL pexophagy reporter in day 3 adult hermaphrodite animals of the indicated genotypes. For comparison, wild-type animals are paired with either fzo-1, unc-43, or daf-16 mutant animals. (B) Quantification of green:red fluorescence ratios for mCherry-GFP-SKL in day 3 adult wild-type, fzo-1, unc-43, and daf-16 hermaphrodite animals (n = 15 worms per condition). Data are presented as mean ± SD. ****, p ≤ 0.0001. One-way ANOVA with Tukey’s multiple comparisons. (C) Representative merged green and red fluorescence image of mCherry-GFP-SKL in day 3 adult hermaphrodite fzo-1 mutant animals fed either control or prx-11 RNAi. (D) Quantification of green:red fluorescence ratios for mCherry-GFP-SKL in day 3 adult hermaphrodite fzo-1 mutant animals fed either control or prx-11 RNAi (n = 15 worms per condition). Data are presented as mean ± SD. ****, p ≤ 0.0001. Unpaired t-test. (E) Representative merged green and red fluorescence image of mCherry-GFP-SKL in day 3 adult hermaphrodite unc-43 mutant animals fed either control or prx-11 RNAi. (F) Quantification of green:red fluorescence ratios for mCherry-GFP-SKL in day 3 adult hermaphrodite unc-43 mutant animals fed either control or prx-11 RNAi (n = 15 worms per condition). Data are presented as mean ± SD. ***, p ≤ 0.001. Unpaired t-test. (G) Representative merged green and red fluorescence image of mCherry-GFP-SKL in day 3 adult hermaphrodite daf-16 mutant animals fed either control or prx-11 RNAi. (H) Quantification of green:red fluorescence ratios for mCherry-GFP-SKL in day 3 adult hermaphrodite daf-16 mutant animals fed either control or prx-11 RNAi (n = 15 worms per condition). Data are presented as mean ± SD. ****, p ≤ 0.0001. Unpaired t-test. (I) Representative green channel images of mCherry-GFP-SKL in day 3 adult hermaphrodite fzo-1 mutant animals fed either control or prx-11 RNAi. (J) Quantification of individual peroxisome areas in day 3 adult hermaphrodite fzo-1 mutant animals fed either control or prx-11 RNAi. Data are presented as mean ± SD. ****, p ≤ 0.0001. Unpaired t-test. (K) Representative green channel images of mCherry-GFP-SKL in day 3 adult hermaphrodite unc-43 mutant animals fed either control or prx-11 RNAi. (L) Quantification of individual peroxisome areas in day 3 adult hermaphrodite unc-43 mutant animals fed either control or prx-11 RNAi. Data are presented as mean ± SD. ****, p ≤ 0.0001. Unpaired t-test. (M) Representative green channel images of mCherry-GFP-SKL in day 3 adult hermaphrodite daf-16 mutant animals fed either control or prx-11 RNAi. (N) Quantification of individual peroxisome areas in day 3 adult hermaphrodite daf-16 mutant animals fed either control or prx-11 RNAi. Data are presented as mean ± SD. ****, p ≤ 0.0001. Unpaired t-test. Bars: 10 μm (I, K, M) or 100 μm (A, C, E, G).