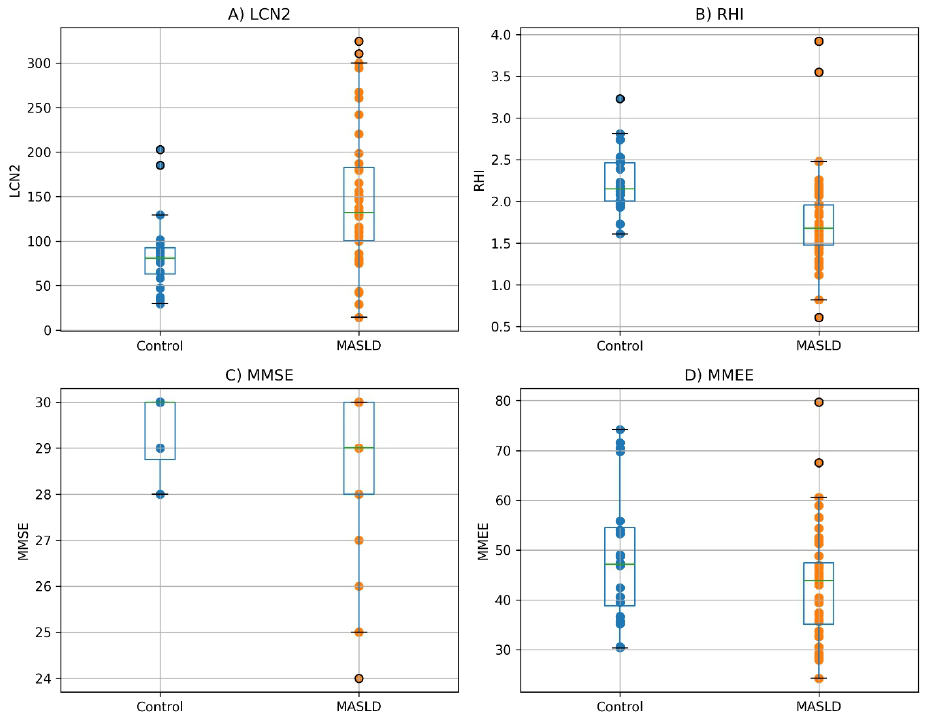
Figure 1.Distribution of LCN2, RHI, MMSE, and MMEE values in MASLD patients and controls. Box plots represent median and interquartile range, with individual data points overlaid (LCN2: lipocalin-2; RHI: reactive hyperemia index; MMSE: mini mental state examination; MMEE: myocardial mechano-energetic efficiency).