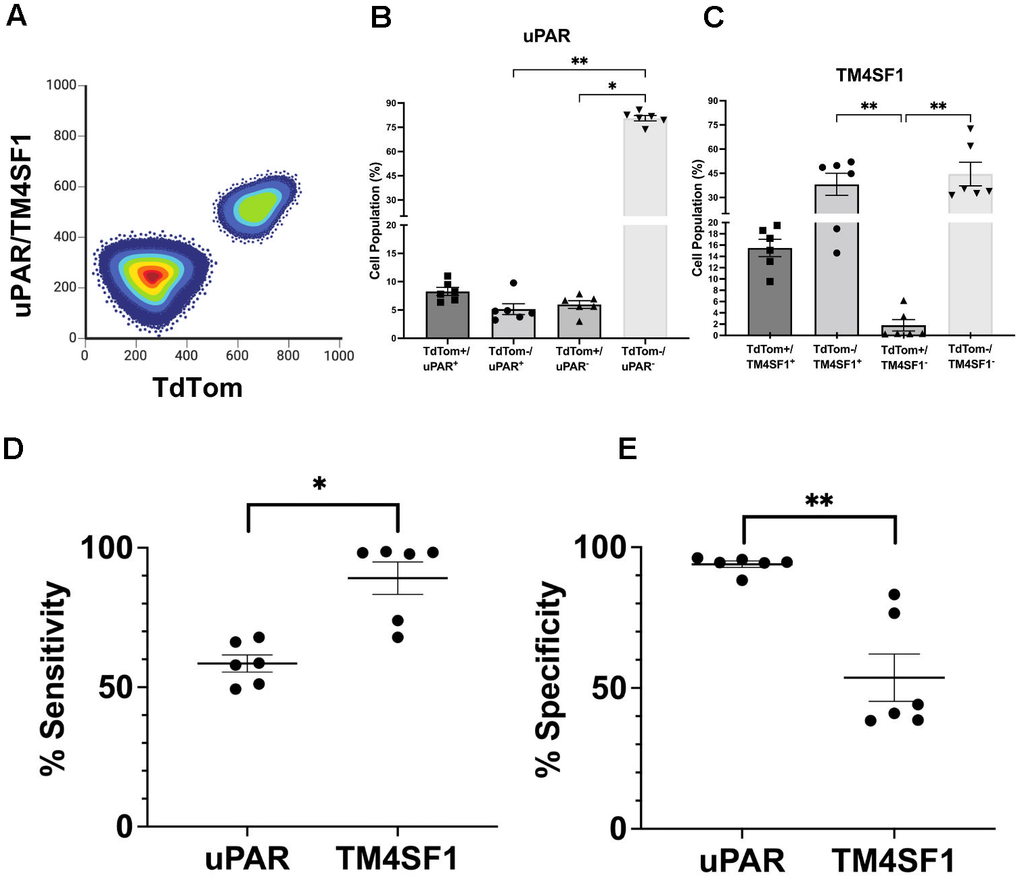
Figure 5.TM4SF1 demonstrates high sensitivity as a surface marker for senescent β-cells. (A) Graphical representation of subpopulation identity from FACS to determine the sensitivity and specificity of uPAR and TM4SF1 as surface markers of P21-tdTom mice islet cells (8-18 months of age, n = 6). (B) Percentage of cells expressing uPAR and tdTom across the indicated conditions. (C) Percentage of cells expressing TM4SF1. (D) Sensitivity = (True Positives) / (True Positives + False Negatives). (E) Specificity = True Negatives / (True Negatives + False Positives) where TdTomato+ signal is considered as “True”. A false positive is a positive signal for either TM4SF1 or uPAR in P21 negative cells. A false negative was defined as no signal for either TM4SF1 or uPAR in P21 positive cells. Each dot represents an individual sample. Results are mean ± SEM; *p ≤ 0.05; **p ≤ 0.01.