





Introduction
Type 2 diabetes mellitus is considered a defining disease of the 21st century due to its prevalence, reduced life expectancy, and potentially fatal complications. In 2021, it was estimated that there were 529 million people living with type 2 diabetes across the world. By 2050, that number is projected to increase to 1.31 billion people worldwide [1].
T2DM is characterized by elevated blood glucose levels resulting from insulin resistance and/or impaired insulin secretion by pancreatic β-cells [2, 3]. Frequently occurring in the context of metabolic dysfunction, this heterogeneous and progressive non-autoimmune disease is partly driven by pancreatic β-cell senescence [4, 5].
Cellular senescence is a response triggered by acute or chronic stress [6], leading to cell cycle arrest through the upregulation of cyclin-dependent kinase inhibitors p21 (encoded by Cdkn1a) and/or p16 (encoded by Cdkn2a), the increased activity of senescence-associated β-galactosidase (SA-βgal), the development of Senescence-Associated Secretory Phenotype (SASP), as well as through activation of anti-apoptotic pathways such as the BCL-2 protein family [4]. Activation of anti-apoptotic proteins, such as BCL-2, functions as a cellular defense mechanism by inhibiting ribonucleotide reductase, the enzyme responsible for synthesizing DNA precursors [7]. This inhibition prevents replication of cells with damaged DNA, however, because BCL-2 also suppresses apoptosis [8], these cells persist in a non-proliferative state, contributing to the gradual accumulation of senescent cells with aging [9].
Senescent β-cells are dysfunctional [10, 11] and therefore progressively worsen T2DM outcomes over time, highlighting the need to investigate the mechanisms and signaling pathways driving β-cell senescence to develop therapies that eliminate these cells and slow the progression of β-cell dysfunction [11]. A potential strategy to target senescent β-cells is through Chimeric Antigen Receptor (CAR) T-cell therapy. CAR T cells are genetically engineered T lymphocytes that are modified to express synthetic chimeric antigen receptors on their surface. These receptors are designed to recognize and eliminate antigen-expressing cells via cytotoxic effects [12]. This technology was originally developed for cancer immunotherapy, but recent trials have shown CAR T cells are also effective at clearing senescent cells [13].
Trials have shown that CAR T cells specific for urokinase-type plasminogen activator receptor (uPAR encoded by PLAUR), a cell-surface protein involved in inflammation and matrix remodeling, have effectively eliminated senescent cells in vitro and in vivo [14]. Despite uPAR’s well-established role as a senescence surface marker, which is useful as a reference for identifying other senescent cell surface markers, its lack of tissue specificity for pancreatic β-cells is a limitation in the setting of T2DM. The identification of a surface marker with higher tissue-specificity for senescent pancreatic β-cells could improve studies on this cell population and could eventually be used for immunological targeting.
Herein, transmembrane-4-L-six-family member-1 (TM4SF1), normally an extracellular signal transducer involved in regulating vital cellular activities such as adhesion and migration [15], was identified as a cell surface marker tissue-specific for pancreatic β-cells in rodents and humans.
Results
TM4SF1 is highly expressed in pancreatic β-cells
Using RNA-seq data from β-Gal+ vs. β-gal- β cells (GSE72753 [16, 11]), we identified Cluster of Differentiation (CD) and other known plasma membrane genes that were expressed at low levels in β-Gal- cells and were significantly upregulated in β-Gal+ cells. G-protein coupled receptors were excluded since they face the cytoplasm (Figure 1A).
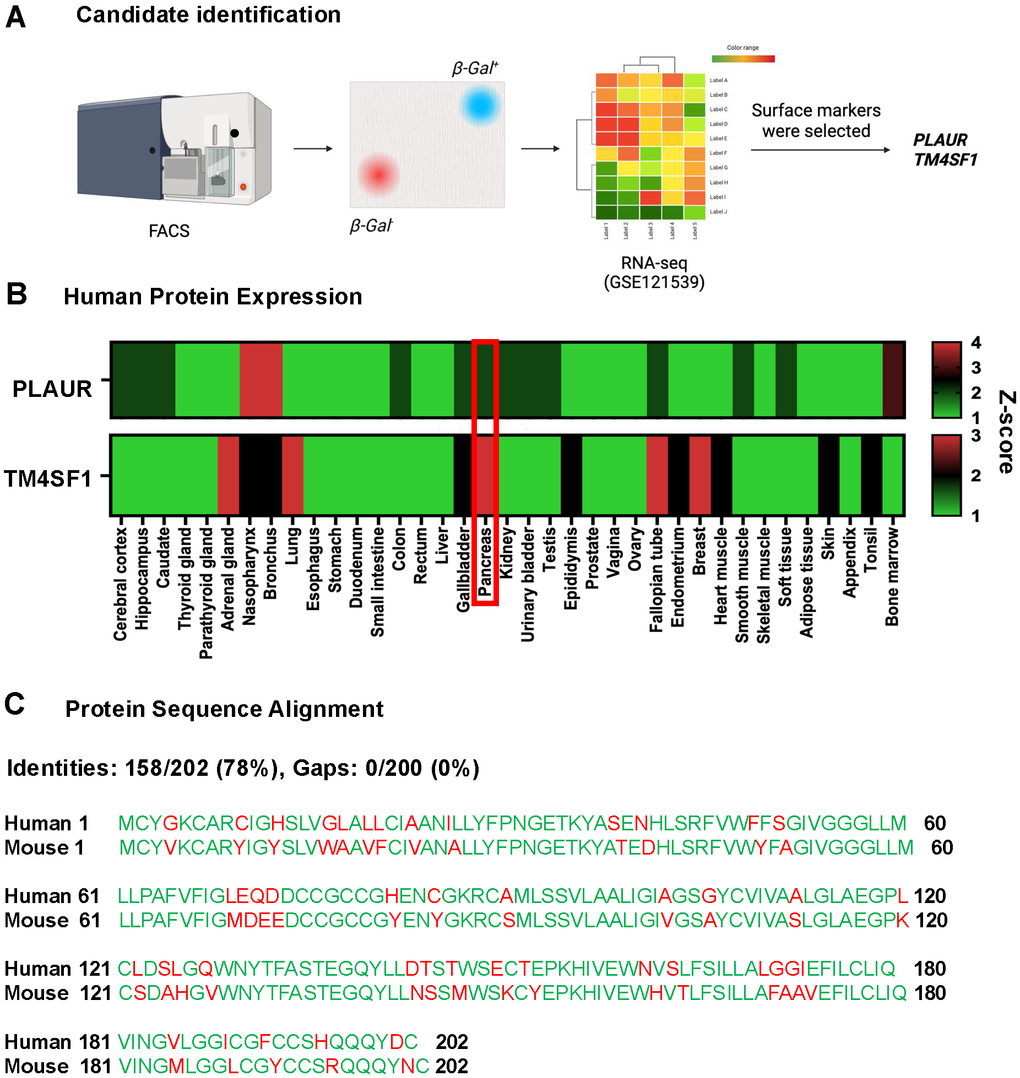
Figure 1. Identification of TM4SF1 as a candidate surface marker of senescent pancreatic β-cells. (A) Fluorescence-activated cell sorting (FACS) was used to isolate potential candidates for a tissue-specific pancreatic β-cell senescence cell-surface marker. TM4SF1 highest expression in pancreas. (B) Heatmap of TM4SF1 and PLAUR across tissues in humans. Data obtained from the Human Protein Atlas. (C) Graphical display for genome sequence alignment between Human and Mouse for the TM4SF1 gene.
PLAUR and TM4SF1 emerged as candidates of surface markers of senescent β-cells based on their known expression in the cytoplasmic membrane. TM4SF1 is a member of the tetraspanin family characterized by the presence of four hydrophobic domains, predicting plasma membrane localization as a primary site. Its extracellular loop accessibility makes it amenable to antibody based targeting while its recycling behaviour could influence payload delivery. Expression of these cell surface markers at the protein level was compared across different human tissues using data from the Human Protein Atlas. TM4SF1 was confirmed as a viable tissue-specific candidate due to its high expression in human pancreas and low expression in other tissues (Figure 1B).
To identify suitable experimental models, the multiple comparative genome viewer (MCGV) at the NCBI data was used to compare the genetic sequence of TM4SF1 in human and mice. Out of 202 amino acids, 158 are identical between human and mouse TM4SF1 suggesting high evolutionary conservation (Figure 1C). This 78% identity supports that mouse models are suitable for studying TM4SF1 function and targeting.
To confirm the relationship between senescence and expression of TM4SF1, C57Bl6 mouse pancreas were stained for TM4SF1 and nuclear exclusion of HMGB1, which is a marker of senescence as described by Campisi J et al. [17, 18] (Figure 2A). Image analysis revealed a statistically significant expression of TM4SF1 in β-cells with nuclear exclusion of HMGB1 (Figure 2B).
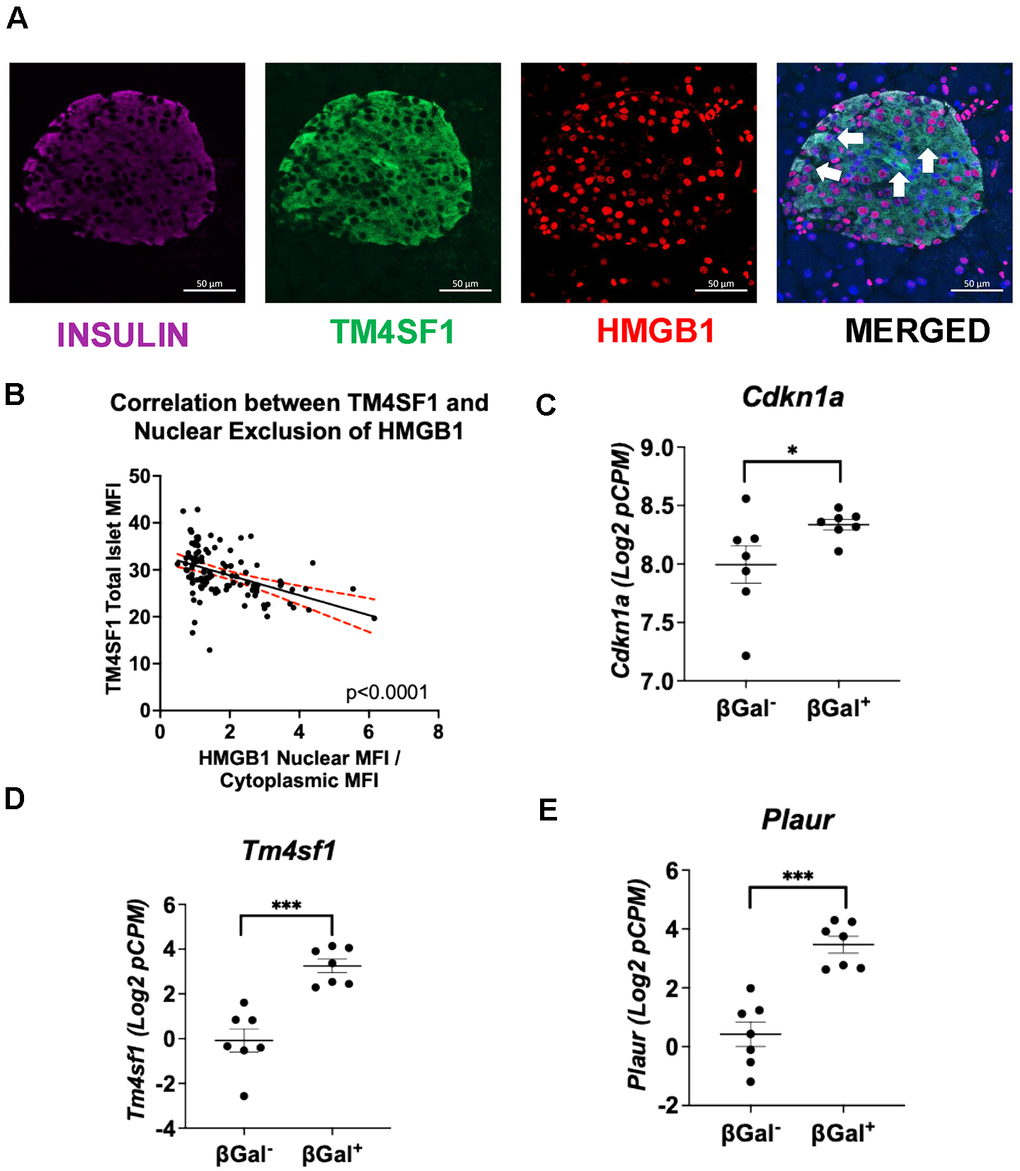
Figure 2. TM4SF1 marks senescent β-cells in mice. (A) Immunostaining for TM4SF1 and nuclear exclusion of HMGB1 in mouse β-cells. (B) Scatter plot showing a negative relationship between TM4SF1 protein levels and nuclear HMGB1 in mouse islets. TM4SF1 levels negatively correlated with nuclear-to-cytoplasmic HMGB1 ratio (p < 0.0001), correlating higher TM4SF1 expression with HMGB1 nuclear exclusion. Protein levels were quantified as mean fluorescence intensity (MFI). n=3 Control, n=3 HFD, n=3HFD + Bcl2i. 10-13 images per animal were analyzed. (C–E) Islets isolated from 7-8-month-old C57Bl/6J male retired breeders were FACS sorted into non-senescent (β-Gal negative) and senescent (β-Gal positive) subpopulations for RNA-seq after gating for enrichment of β-cells (GSE121539). Individual matched subpopulations from β-Gal negative and positive from 7 biological replicates. Specific gene expression was compared between senescent and non-senescent populations: Cdkn1a, Plaur and Tm4sf1.
Senescence Associated β-Galactosidase activity (SA-bGAL) is another well-known marker of senescence also identified by Campisi J et al. [19] in the context of p21-mediated cell cycle arrest [20]. We compared the expression of Plaur and Tm4sf1 in RNA-seq data from β-Gal+ (senescent) and β-Gal– (non-senescent) mouse islet cells. Cdkn1a/P21 (Figure 2C), Plaur (Figure 2D) and Tm4sf1 (Figure 2E) were expressed at significantly higher levels of expression in β-Gal+ cells, indicating an association of these cell markers with the senescent state and supporting Tm4sf1 as a biologically valid candidate with potential therapeutic and diagnostic use.
To evaluate whether expression of Tm4sf1 followed the known dynamics of senescent β-cells, metabolic stress was induced with high-fat-diet (HFD) for 4 weeks in C57Bl6J mice, an intervention reported to increase senescence in β-cells [11, 21] and a subset of mice received simultaneous senolytic treatment with ABT263, a Bcl2 inhibitor (Bcl2i) [11, 22]. Expression of Plaur and Tm4sf1 followed the same expression kinetics as Cdkn1a (p21) a known marker and effector of β-cell senescence (Figure 3A). Tm4sf1 expression increased with high-fat diet and was decreased with BCL2i, consistent with its value as a senescent marker at the mRNA level. At the protein levels, pancreas from control, HFD and HFD+Bcl2i treated mice, were stained for INSULIN, TM4SF1 and P21 (Figure 3B). Image analysis revealed an increase of TM4SF1 expression in β-cells from mice on a HFD and while Bcl2i restored expression to control levels (Figure 3C). These dynamics were mirrored by P21 (Figure 3D), supporting the validity of TM4SF1 as a marker of β-cell senescence.
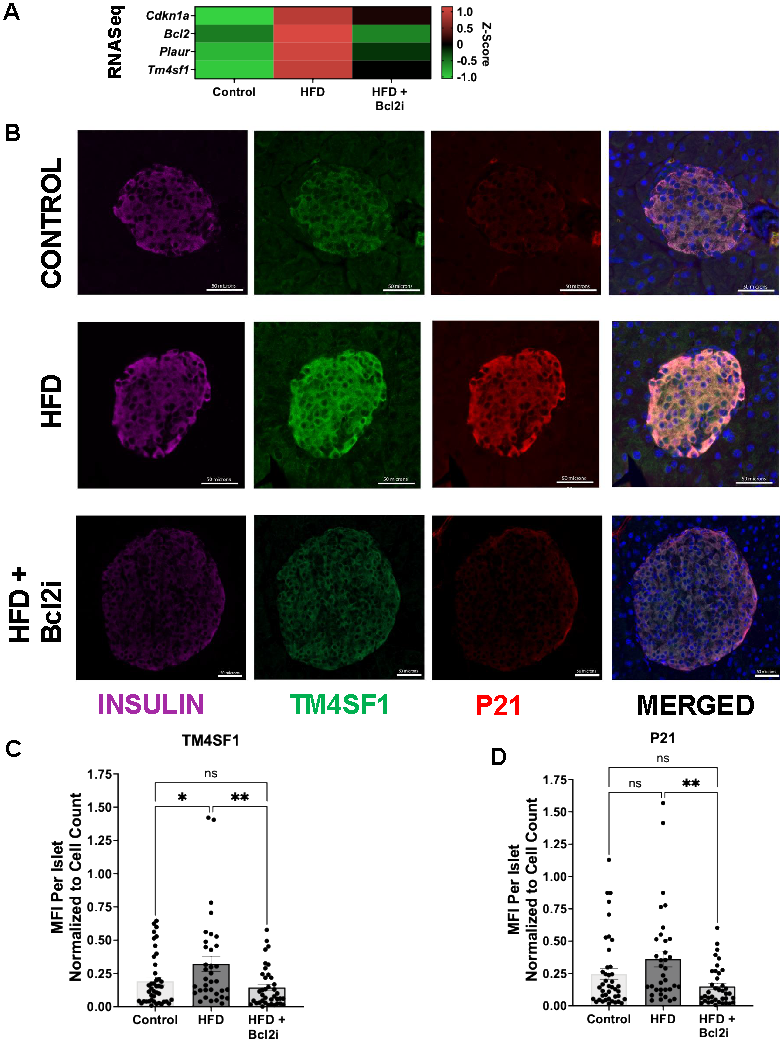
Figure 3. TM4SF1 transcription and protein expression increase with HFD and are decreased following senolytic treatment. (A) RNA-seq heat map showing elevated Tm4sf1 expression in high fat diet (HFD) and decreased with a BCL2i (ABT263) which acts as a senolytic. Plaur and Tm4sf1 followed a similar pattern to Cdkn1a and Bcl2, senescence markers. n=4 Control, n=4 HFD, n=4 HFD + Bcl2i. (B) Representative immunostaining of mouse pancreas for TM4SF1, P21, and insulin, consistent with increased expression in HFD and reduction with BCL2i treatment. (C) TM4SF1 and (D) MFI over the total islet area, normalized to cell count per islet, showing increased expression in HFD and reduction with BCL2i treatment. n=3 Control, n=3 HFD, n=3HFD + Bcl2i. 10-13 images per animal were analyzed.
Reporter mouse model supports expression of TM4SF1 in P21-tdTom+ cells
To assess the expression of TM4SF1 and uPAR in P21-tdTom+ cells, we utilized a whole-body fluorescent reporter mouse for p21 (P21-tdTomato). In this model, CRISPR/Cas9-mediated insertion of a P2A-tdTomato cassette into the endogenous Cdkn1a locus enables the expression of p21 and tdTomato in the same transcript, allowing fluorescent identification of P21-tdTom+ cells (Figure 4A).
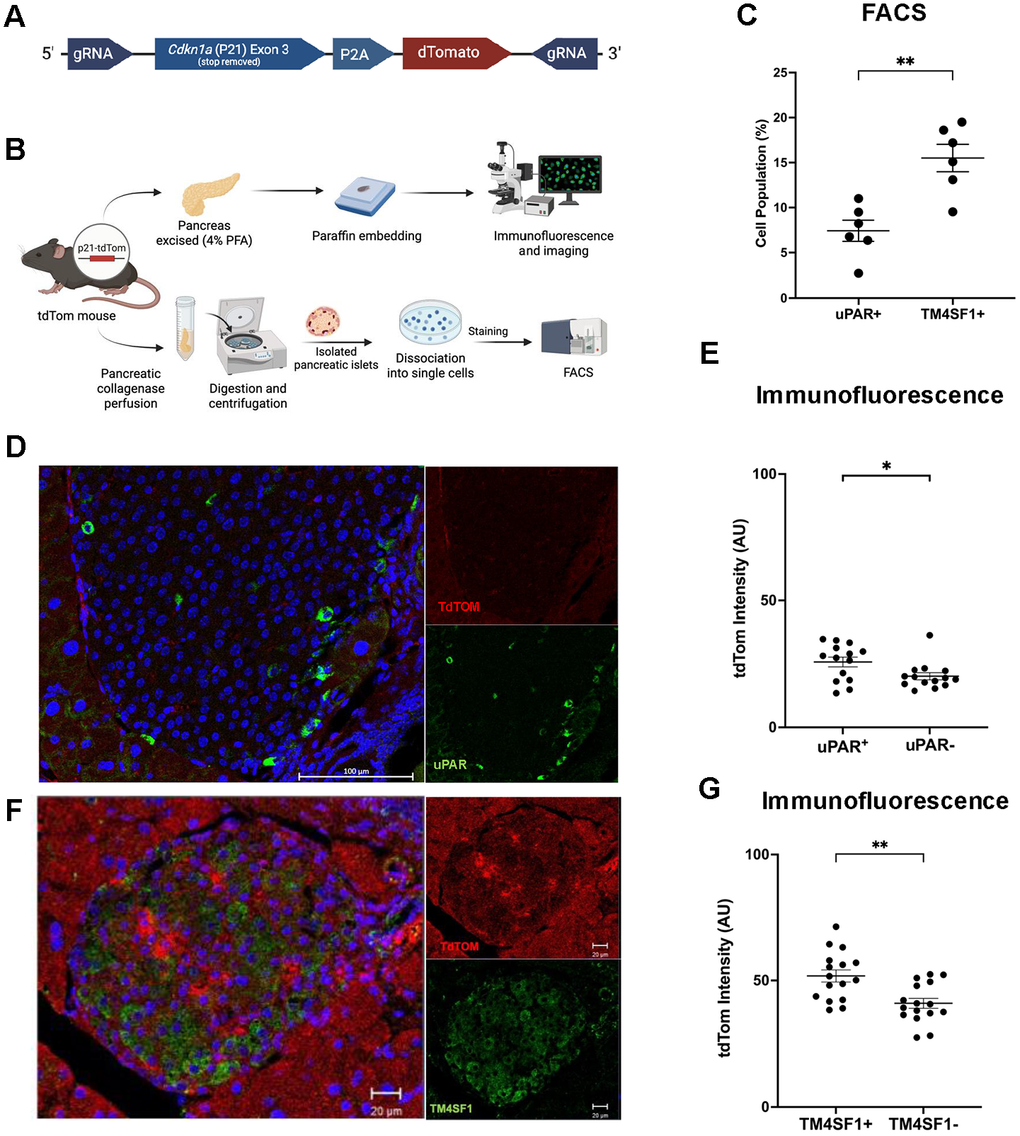
Figure 4. P21-tdTom reporter mouse supports TM4SF1 as a senescent β-cell surface marker. (A) CRISPR/Cas9-mediated knock-in strategy for the p21Cip1-tdTomato reporter mice. (B) Experimental design using P21-tdTom reporter mouse to validate surface markers by flow cytometry (8-18 months of age, n = 6) and immunofluorescence (4-12 months of age, n = 5). (C) Flow cytometry subpopulations of p21-tdTom and uPAR or TM4SF1. Each dot represents islets from a single mouse. (D) Representative confocal image of mouse pancreatic islet from a 53- week-old male uPAR+ mouse stained for tdTom (red) and uPAR (green). Mag bar 100 μm. (E) Immunofluorescence quantification of tdTom expression in uPAR+ vs. uPAR- cells; pancreas from 5 separate mice were evaluated; each dot represents a single cell from the top and bottom 20% of TdTomato intensity. More than 80 cells were measured. (F) Representative confocal image of mouse pancreatic islet from a 23-week-old female tdTom+, stained for tdTom (red) and TM4SF1 (green), indicating senescent β-cell localization. Mag bar 20 μm. (G) Immunofluorescence quantification of tdTom expression in TM4SF1+ vs. TM4SF1- cells pancreas from 5 separate mice were evaluated. Statistically significant higher expression of TdTomato in TM4SF1+ cells; each dot represents a single cell from the top and bottom 20% of TdTom intensity. More than 80 cells were measured. Results are mean ± SEM; *p ≤ 0.05; **p ≤ 0.01.
Pancreatic islets from P21-tdTom mice were assessed for co-expression of tdTomato with uPAR or TM4SF1 with flow cytometry and immunostaining (Figure 4B). By flow cytometry, a significantly (p < 0.01) larger proportion of tdTom+ β-cells expressed TM4SF1 (15%) compared to uPAR (PLAUR) (7%) supporting the former as a more consistent surface marker of senescent P21+ β-cells (Figure 4C).
Immunostaining of pancreatic slices allowed the measurement uPAR and TM4SF1 coexpression with tdTom+ β-cells, as a surrogate marker of P21 (Figure 4D, 4F). Fluorescence quantification showed higher p21-tdTom intensity in uPAR+ compared to uPAR- cells (Figure 4E), consistent with its role as a surface marker of senescent cells [14].
Comparison of td-Tom intensity in TM4SF1+ and TM4SF1- cells (Figure 4G) revealed a better positive predictive value of senescence than uPAR, as indicated by higher statistical significance. This strengthens the argument that TM4SF1 is a reliable cell surface marker of mouse senescent β-cells.
TM4SF1 is a specific surface marker of P21+ cells in mice
To evaluate the sensitivity and specificity of both uPAR and TM4SF1, islets from P21-tdTom mice were isolated, dispersed into single cells and stained for either uPAR or TM4SF1 followed by flow cytometry analysis. Subpopulation analysis (Figure 5A and Supplementary Figure 1) was performed and P21-tdTom positive signal was considered the true senescent signal against which the two surface markers were evaluated.
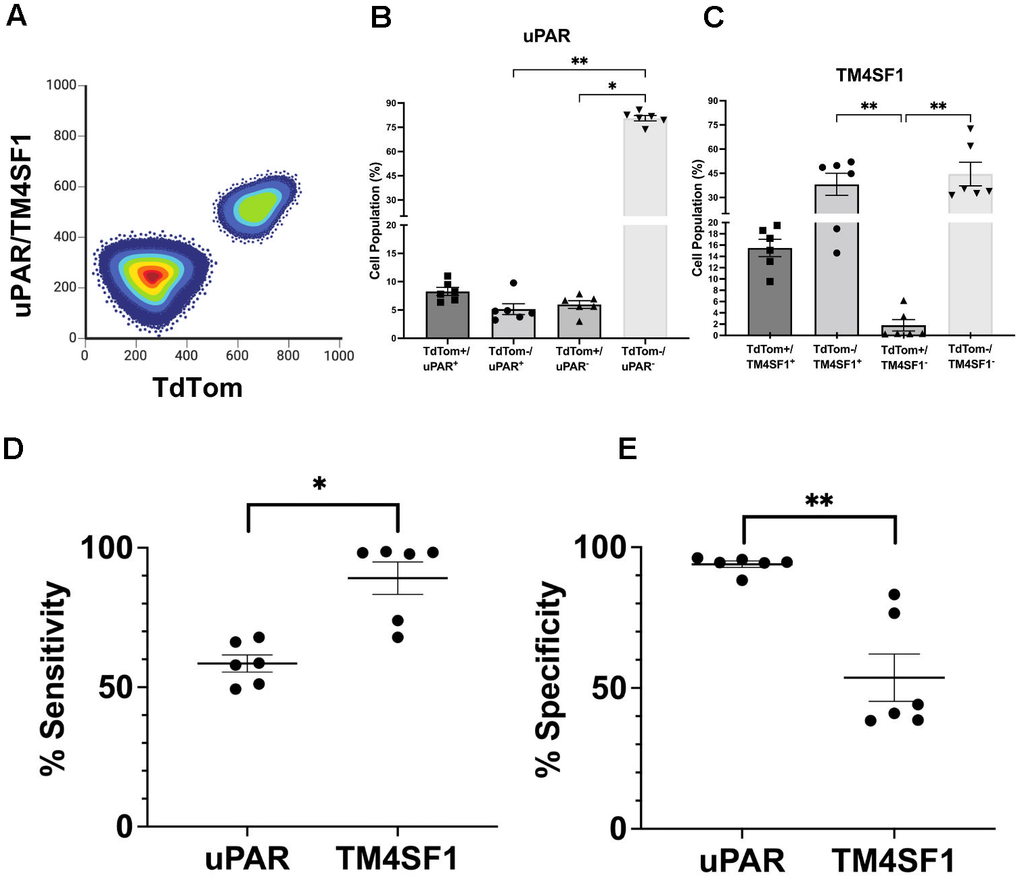
Figure 5. TM4SF1 demonstrates high sensitivity as a surface marker for senescent β-cells. (A) Graphical representation of subpopulation identity from FACS to determine the sensitivity and specificity of uPAR and TM4SF1 as surface markers of P21-tdTom mice islet cells (8-18 months of age, n = 6). (B) Percentage of cells expressing uPAR and tdTom across the indicated conditions. (C) Percentage of cells expressing TM4SF1. (D) Sensitivity = (True Positives) / (True Positives + False Negatives). (E) Specificity = True Negatives / (True Negatives + False Positives) where TdTomato+ signal is considered as “True”. A false positive is a positive signal for either TM4SF1 or uPAR in P21 negative cells. A false negative was defined as no signal for either TM4SF1 or uPAR in P21 positive cells. Each dot represents an individual sample. Results are mean ± SEM; *p ≤ 0.05; **p ≤ 0.01.
In this analysis, cells with uPAR+/TdTom+ or TM4SF1+/TdTom+ signals were classified as “double positive” while cells with uPAR–/ TdTom– or TM4SF1–/ TdTom– signals were classified as “double negative”. A false positive was defined as positive signal for either TM4SF1 or uPAR in P21 negative cells (uPAR+/TdTom– or TM4SF1+/TdTom–). A false negative was defined as no signal for either TM4SF1 or uPAR in P21 positive cells (uPAR–/TdTom+ or TM4SF1–/TdTom+ cells).
Islet cells evaluated for uPAR and TdTom staining revealed 80% double negative cells, 8% double positive cells, 5% of false positives and 6% false negatives (Figure 5B). These proportions resulted in a 58% sensitivity (Figure 5D) and 95% specificity (Figure 5E) for uPAR as a marker of P21+ mouse islet cells. Flow cytometry analysis of TM4SF1 and tdTom signals revealed 45% of double negative cells, 15% double positive cells, 38% of false positive and 2% of false negatives (Figure 5C). These proportions resulted in an 89% sensitivity (Figure 5D) and 54% specificity (Figure 5E) for TM4SF1 as a marker of P21+ mouse islet cells. These results point to TM4SF1 as a sensitive surface marker to identify P21+ senescent cells in mouse pancreatic islets and uPAR as a specific surface marker for the same subpopulation.
In conjunction, these surface markers represent a specific and sensitive platform to isolate P21+ senescent β-cells.
TM4SF1 correlates with age and P21 expression in human islets
Senescence is a progressive, age-dependent cellular stress response. In type 2 diabetes, the accumulation of senescent pancreatic β-cells contributes to impaired insulin secretion and metabolic dysfunction [11, 23]. We found an age-related upregulation of TM4SF1 in human pancreatic islets (Figure 6A), supporting its potential involvement in β-cell senescence and diabetic pathophysiology. Immunofluorescence staining of human pancreas for TM4SF1 and INSULIN (donor information in Supplementary Table 1), revealed coexpression in a proportion of cells, consistent with its expression at the protein level (Figure 6B) in humans. Expression analysis of scRNASeq in β-cells from human islets, revealed higher expression levels of TM4SF1 in CDKN1A+ (P21) senescent cells and lower levels in the non-senescent CDKN1A- population (Figure 6C). Additionally, senescent β-cells had the highest levels of expression when compared with other islet cell types. Analysis of P21 expression in islets from different human donors revealed a direct and significant correlation between CDKN1A and TM4SF1 transcripts (Figure 6D).
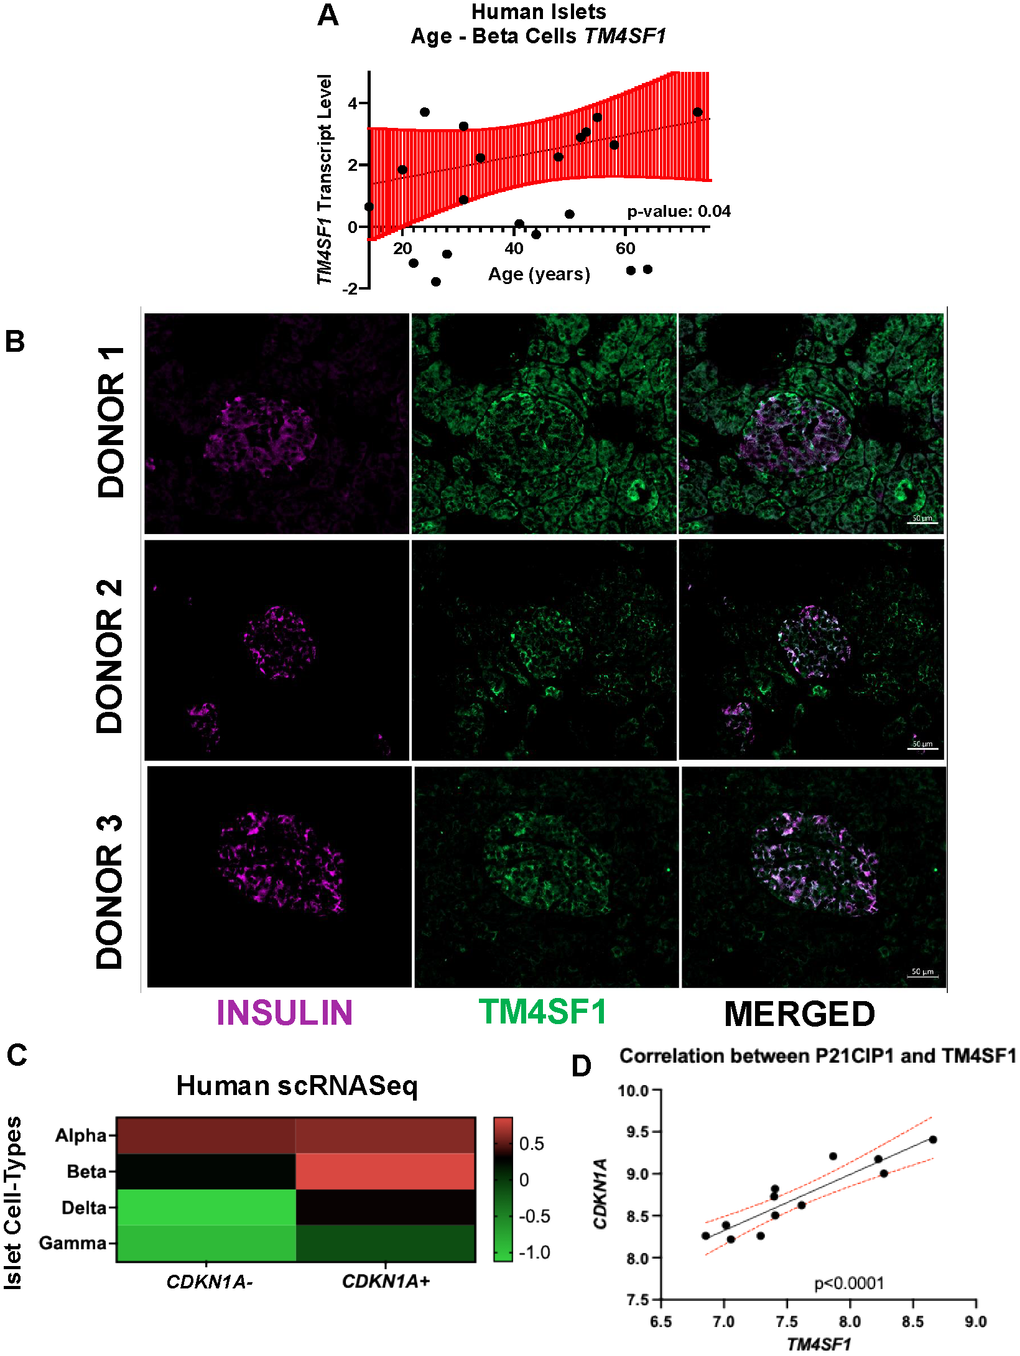
Figure 6. Association of TM4SF1 with β-cell senescence and aging in human islets. (A) Scatter plots showing the relationship between donor age and β-cell transcript levels of TM4SF1 in human islets. Statistically significant positive correlation with age (p = 0.04), suggesting age-related upregulation. Data downloaded from HumanIslet.com. (B) Confocal image of human pancreatic islet from 3 donors (Supplementary Table 1), stained for INSULIN (green) and TM4SF1, confirming β-cell localization. Mag bar 50 μm. (C) scRNAseq human heat map comparing TM4SF1 expression human CDKN1A+ and – subpopulations in different islet cell types (α, β, δ, and γ) (D) RNA-seq analysis showing a direct positive correlation between CDKN1A transcript and TM4SF1 in human islets. Experimental replicates from 3 independent donors.
TM4SF1 negatively correlated with β-cell function in humans
To evaluate the relationship of uPAR and TM4SF1 with pancreatic β-cell function, the HumanIslets database was queried. The β-cell stimulation index from 1mM to 10 mM glucose negatively correlated with PLAUR and TM4SF1 gene transcript levels (Figure 7A, 7B). These data support that higher levels of expression of TM4SF1 mark progressively impaired β-cell function which is consistent with loss of function in P21+ cells [24]. Insulin content (Insulin: DNA ratio) did not correlate with PLAUR (Figure 7C) but negatively correlated with TM4SF1 transcript levels (Figure 7D). Further functional assessment of cells expressing uPAR and TM4SF1 included human islets which were sorted based on cell surface expression in live cells (Figure 7E). Glucose stimulated insulin secretion (GSIS) revealed that TM4SF1+ cells secreted significantly less insulin than TM4SF1– cells in response to a stimulatory concentration of 16.8 mM glucose (Figure 7F). This result supports the dysfunctionality of TM4SF1+ cells. No significant functional differences were found between uPAR positive and negative cells.
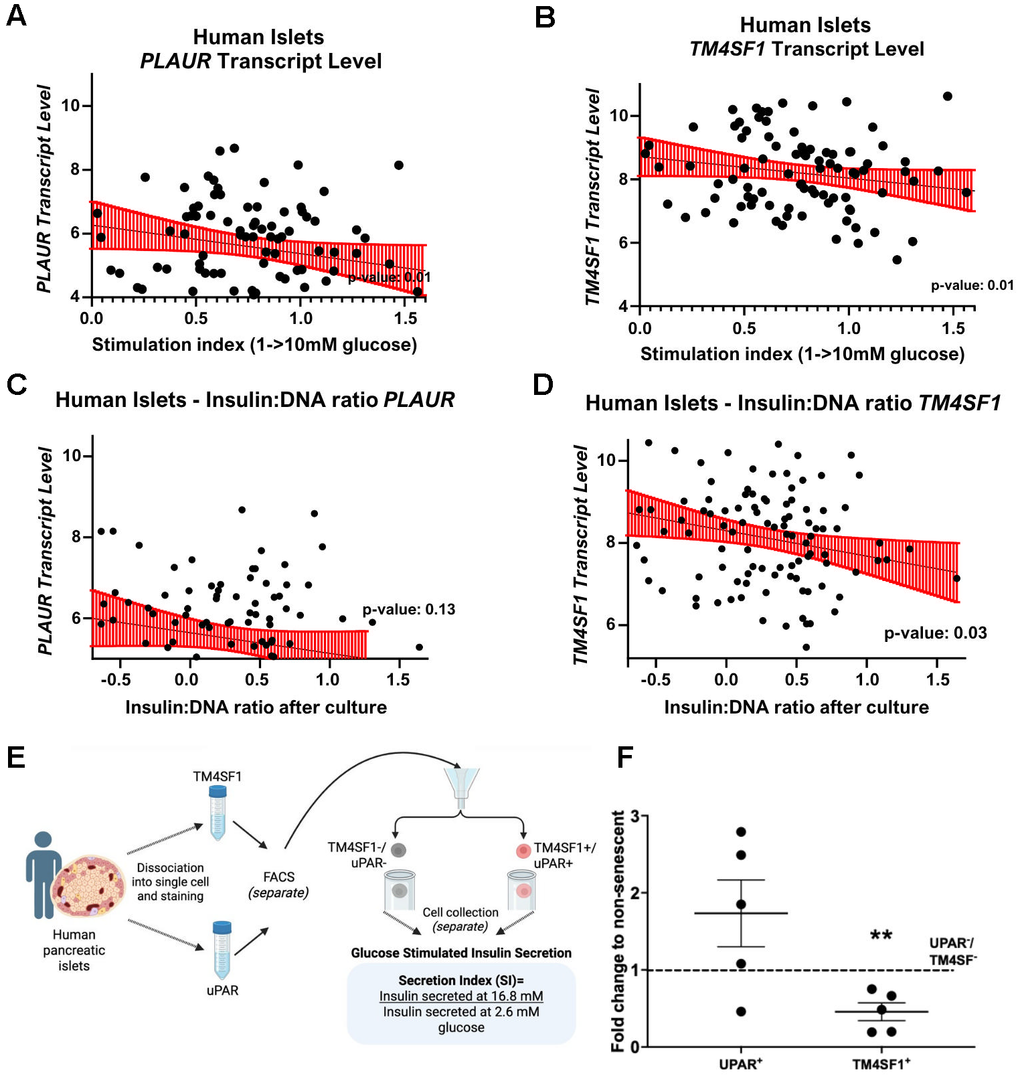
Figure 7. TM4SF1 levels negatively correlate with β-cell function and insulin content in human islets. Negative linear regression between stimulation index (1→10 mM) and PLAUR transcript (A) and TM4SF1 transcript (B). Scatter plots showing the relationship between insulin content after culture and transcript levels of PLAUR (C) and TM4SF1 (D) in human islets. Data downloaded from HumanIslets.com. (E) Experimental design to evaluate function from uPAR and TM4SF1 subpopulations. (F) Glucose-stimulated insulin secretion (16.8 mM glucose) in UPAR+ and TM4SF1+ β-cells normalized to their negative counterparts, showing significantly reduced insulin secretion in TM4SF1+ cells; n= 5 technical replicates from Donor 4.
Identification of TM4SF1 as a surface marker of senescent β-cells in humans will further our understanding of human β-cell senescence and guide therapeutic strategies to target them.
Discussion
Established senescent markers such as uPAR+ and β-Gal+ are widely expressed across different tissue types [25]. The identification of a tissue-specific cell marker is crucial for developing targeted diabetes therapies and advancing senolytic therapies that minimize off-target effects and preserve healthy tissue during immunological targeting with CAR T cells.
Herein, TM4SF1 was identified as a tissue-specific cell marker for senescent pancreatic β-cells in mouse and humans.
TM4SF1 exhibited high levels of expression in TdTom+ β-cells, a reporter for p21+ cells. Flow cytometry also found a higher proportion of TM4SF1 coexpression with TdTom+ β-cells compared with uPAR. Additionally, higher levels of expression of TM4SF1 correlated with impaired β-cell function and lower insulin content per cell in humans.
The mechanism by which senescence leads to TM4SF1 expression in mouse and human β-cells is unknown. TMF4SF1 has been shown to enhance the interaction between AKT and PDPK1, promoting AKT phosphorylation and subsequently decreasing p21 in hepatocellular carcinoma cells [26], In pancreatic β-cells, AKT phosphorylation is a critical signaling mechanism stimulated by insulin, IGF1 and glucose, all of which have been shown to induce senescence in different tissues [27–29]. Further investigation is necessary to corroborate the implications of the AKT pathway in the regulation of TM4SF1 in senescent cells. It is possible that TM4SF1 works in a tissue and disease specific manner.
Further studies are required to understand the potential mechanistic involvement of TM4SF1 in β-cell senescence and dysfunction.
In conclusion, our research found that TM4SF1 was upregulated in p21-senescent pancreatic β-cells and can be used as a surface marker in mice and humans. These findings deepen our understanding of the biological processes involved in β-cell aging and may lead to targeted senotherapies such as the development of TM4SF1-specific CAR T cells with the potential to target senescent pancreatic β-cells, improve β-cell function, and alter the course of T2DM.
Materials and Methods
Human Protein Atlas
The data for TM4SF1 gene expression across various tissue types was obtained from the Human Protein Atlas. Protein expression across different human organs was quantified utilizing antibody-based immunohistochemistry. Levels of protein expression were standardized using Z-scores.
Multiple Comparative Genome Viewer
The data for the genetic sequence alignment of TM4SF1 in human and mice was obtained from the Multiple Comparative Genome Viewer (MCGV) tool from the National Center for Biotechnology Information (NCBI) database. The NCBI is a division of the National Library of Medicine (NLM) at the National Institutes of Health (NIH).
Human Islets
RNA-seq and clinical data were obtained from the public database HumanIslets.com (Alberta Diabetes Institute IsletCore).
Animals
All experiments were conducted at the Joslin Diabetes Center with the approval of its Animal Care and Use Committee. Male and female retired breeder C57BL6J mice aged 4-13 months were obtained from Jackson Laboratories and housed under a 12-hour light/12-hour dark cycle with ad libitum access to water and food at a controlled temperature of 22.2-22.7° C.
p21 tdTom mice
The P2A-tdTomato transgene was inserted in place of a stop codon at the 3’ end of the coding region using easi-CRISPR [30, 31] to generate a mouse with tdTomato expression driven by the p21Cip1 gene. The bioinformatics analysis of the gene for gRNA identification was performed by crispor.tefor.net. Microinjection was performed into embryos from 4-week C57Bl6 female donors (Jackson) and implanted into 6-week-old Swiss Webster females (Charles River). Junction sequencing was performed to corroborate the construct.
Isolation of pancreatic islets and tissue preparation
Under anesthesia, the pancreas from P21-tdTomato mice was excised for fixation in 4% paraformaldehyde (PFA) for 2 hours, followed by embedding in paraffin for histological analysis. Additionally, islets were isolated from both C57BL/6J and P21-tdTomato mice via collagenase digestion [32] followed by a stationary in vitro digestion in a 37° C water bath. After stopping the digestion, islets were isolated using a gradient separation with Lymphocyte Separation Medium (Corning, 25-072-CV) and centrifugation. The tissue at this interface were collected, washed, allowed to sediment, and handpicked for RNA extraction and FACS sorting.
Human tissue
Pancreatic islets from suitable adult brain-dead donors were acquired through the Integrated Islet Distribution Program (IIDP). Immediately upon arrival, islets were cultured overnight in CMRL 1066 medium, enriched with 10% FBS, 1% Glutamax, and 1% penicillin-streptomycin at 37° C with 5% CO2. Islets were carefully handpicked under a stereomicroscope and plated in Petri dishes containing islet media (RPMI 1640 with 10% FBS and 1% penicillin-streptomycin). Additionally, paraformaldehyde-fixed paraffin sections of the upper head, lower head, body, and tail of five human pancreas were sourced from SenNet and the Joslin Clinical Islet Isolation Core for immunostaining (Supplementary Table 1). All tissues were reviewed and approved for research under IRB-exempt status.
Human scRNAseq raw datasets are made available via the SenNet Consortium portal (https://data.sennetconsortium.org/).
Fluorescence-Activated Cell Sorting (FACS)
Following overnight culture, islets were dispersed into single cells using TrypLE Express Enzyme (1X, [-] Phenol red) for 10 minutes at 37° C, then resuspended in M199 media with 10% calf serum for mouse tissue, or in CMRL media (with 10% FBS, 1% Glutamax, 1% Pen/Strep) for human tissue. Cells were analyzed using a DakoCytomation MoFlo Cytometer (Dako, Ft. Collins, CO, USA), where they were gated based on forward scatter and sorted as β cells according to higher endogenous fluorescence. Propidium iodide was used to exclude dead cells. For sorting based on surface markers, cells were incubated for 1 hour at 4° C, first in a blocking solution (normal goat serum in FACS buffer- PBS + 2% FBS), followed by incubation with a primary antibody and then with a secondary antibody for 30 minutes at 4° C. Sorted positive and negative cells were collected, for each marker, in FACS buffer and suspended in culture media (RPMI with 10% FBS and 1% Pen/Strep) for attachment and secretion studies.
Functional assays in human β-cells
To evaluate GSIS in vitro, positive and negative uPAR and TM4SF1 human β-cells populations were utilized, collected post-FACS and cultured overnight in RPMI. After conditioning the cells in low glucose (2.6 mM) concentration, they were exposed to this low concentration for 1 hour, followed by serum collection. Subsequently, the cells were exposed to high glucose (16.8 mM) concentration for an additional hour, with a second serum collection performed thereafter. Insulin levels were measured from the collected serum, with concentrations determined using the Mercodia Insulin ELISA kit (10-1113-01). After serum collection, the cells were preserved in PBS for DNA extraction using the DNeasy Blood and Tissue Kits for DNA Isolation kit (QIAGEN), so that the results obtained from the GSIS measurements could be normalized.
Immunofluorescence
Immunostaining was utilized to visualize the co-localization and expression of surface markers, uPAR and TM4SF1 with the senescence marker P21 and HMGB1, as well as with insulin. Sections were deparaffinized with xylene and rehydrated with ethanol gradients, washed with PBS + 1% NDS and incubated overnight with primary antibody at 4° C (Table 1). On the subsequent staining day, sections were washed and incubated for one hour with secondary antibodies, followed by another overnight incubation at 4° C with a second primary antibody. Sections were washed and incubated 1-hour with secondary antibodies, followed by DAPI or Hoechst 33342 (1:10,000) for nuclear staining. Sections were stained and imaged in parallel such that the staining intensity reflected protein expression. For quantification, images were captured systematically, covering the whole section in confocal mode on a Zeiss LSM 710 microscope or a Zeiss Axio Observer inverted microscope. Clusters of 4-10 cells from each pancreatic islet, positive for uPAR and TM4SF1, were evaluated, and for each positive cell, a corresponding negative cell was analyzed at a 1:1 ratio. The co-localization of these markers with tdTom was analyzed and quantified in each single cell.
Table 1. Antibodies used for immunostaining and FACS.
| Antigen | Species | Manufacturer and item no. | Immunostaining | Dilution for FACS | |
| Image | Dilution | ||||
| uPAR | Rabbit | Invitrogen Cat# PIPA581629 | 4D | 1:500 | 1:20 |
| TM4SF1/L6 | Rabbit | Novusbio Cat# NBP1-76549 | 2A, 3B, 4F, 6B | 1:600 | 1:20 |
| TdTomato | Goat | Origene Cat # AB8181-200 | 4D, 4F | 1:250 | 1:20 |
| Insulin | Guinea Pig | Agilent Cat# A0564 | 2A, 3B, 6B | 1:50 | |
| Waf1/Cip1/CDKN1A P21 | Mouse | Santa Cruz Biotechnology Cat # sc-6246 | 3B | 1:50 | |
| HMGB1 | Mouse | Invitrogen Cat # GT383 | 2A | 1:200 | |
| Cy3 | Anti-Mouse | Jacksonimmuno code: 715-165-151 | 2A, 3B | 1:150 | |
| AlexaFluor™ 594 | anti-Goat | Jacksonimmuno Code: 805-585-180 | 4D, 4F | 1:200 | |
| AlexaFluor™ 594 | anti-Rabbit | Jacksonimmuno Code: 111-585-003 | 1:100 | ||
| AlexaFluor™ 488 | anti-Rabbit | Jacksonimmuno code: 111-545-003 | 2A, 3B, 6B | 1:150 | 1:100 |
| 4D, 4F | 1:200 | ||||
| AlexaFluor™ 647 | Anti-Guinea Pig | Jacksonimmuno code: 706-605-148 | 2A, 3B, 6B | 1:150 | |
Five mice were evaluated for each staining. For human samples, sections from a single donor were stained and analyzed.
Immunofluorescent image analysis
Image analysis was performed using a custom macro in Fiji (ImageJ) to enable automated quantification across all images using the following workflow.
All channels were converted to 8-bit grayscale prior to analysis. Islet regions of interest (ROIs) were defined using the insulin channel. A single empirically determined threshold was applied uniformly across all images, followed by binary processing to generate continuous islet masks. ROIs corresponding to total islet area were identified using particle analysis (size ≥500 pixels, circularity 0.00–1.00) and combined into a single ROI representing the total islet area.
Nuclear ROIs were generated from the DAPI channel using thresholding, watershed segmentation, and particle analysis (size ≥20 pixels, circularity 0.30–1.00). Nuclear ROIs were then filtered to retain only those overlapping with the islet ROI, and the number of nuclear ROIs was used as a proxy for cell count per islet. All nuclear ROIs were combined into a single ROI representing the total nuclear area.
The cytoplasmic ROI was defined as the exclusive area of the total islet ROI minus the total nucleus ROI.
Mean fluorescence intensity (MFI) was measured for TM4SF1, P21, or HMGB1 within the total islet, nuclear, and cytoplasmic ROIs.
Experiment vignettes
Clinical vignettes illustrating experiments (Figures 1A, 4A, 4B, 5A, 7E) were created on BioRender Inc.
Quantification and statistical analysis
Data analysis and figure plotting were completed on Prism – GraphPad (version 10.4.2 GraphPad Software Inc.). Unpaired Student’s t tests were used to compare two groups, and one-way ANOVA followed by post hoc tests were applied for more than two groups. A p-value < 0.05 was considered consistent with a statistically significant level. Flow cytometry analysis was performed using FlowJo version (10.10), and images were processed using ImageJ.
Data availability
RNA-seq data reported can be obtained with the accession number GSE121539.
Abbreviations
CAR: Chimeric Antigen Receptor; CT: Threshold cycle; GSIS: Glucose-stimulated insulin secretion; HFD: High fat diet; HMGB1: High-mobility group 1; HPA: Human Protein Atlas; HUVEC: Human umbilical vein endothelial cells; IHC: Immunohistochemistry; MCGV: Multiple comparative genome viewer; p21Cip1/CDKN1A: Cyclin dependent kinase inhibitor 1A; p16/ CDKN2A: Cyclin dependent kinase inhibitor 2A; PLAUR: Plasminogen activator, urokinase receptor; SA-βgal: Senescence-associated β-galactosidase; SASP: Senescence-Associated Secretory Phenotype; T2DM: Type 2 diabetes mellitus; TM4SF1: Transmembrane 4 L six family member 1; uPAR: Urokinase-type plasminogen activator receptor.
Author Contributions
ABLL, KI, BAS, AA and CC conducted the experiments. ABLL, CAM, AA, MJ, SR, KI, and SV acquired, analyzed, and interpreted the data. ABLL, SV, KI and CAM wrote the manuscript. CAM and SBW designed the study. All authors revised and approved the paper.
Acknowledgments
In memoriam of Dr. Judith Campisi. Beyond your scientific legacy as a senescence pioneer and expert, we thank you for your support, generosity and kindness. The authors thank Angela Wood from the Flow Cytometry Core for her technical support. This work includes data and/or analyses from HumanIslets.com funded by the Canadian Institutes of Health Research, JDRF Canada, and Diabetes Canada (5-SRA-2021-1149-S-B/TG 179092) with data from islets isolated by the Alberta Diabetes Institute IsletCore with the support of the Human Organ Procurement and Exchange program, Trillium Gift of Life Network, BC Transplant, Quebec Transplant, and other Canadian organ procurement organizations with written informed donor consent as approved by the Human Research Ethics Board at the University of Alberta (Pro00013094).
Conflicts of Interest
The authors declare that they have no conflicts of interest.
Ethical Statement and Consent
All experiments were conducted at Joslin Diabetes Center with approval of its Animal Care and Use Committee under protocol number 063-2024. Studies involving human pancreas were determined “Not Human Research” (SUDY 00000152) by Joslin’s Committee on Human Studies based on lack of access to any identifying information and specimen collection at other institutions.
Funding
This study was supported by National Institutes of Health (NIH) grants 1R01DK132535 to CAM, P30 DK036836 to Joslin Diabetes Center (Cores), by the Thomas J. Beatson, Jr. Foundation Grant 2025-020 (CAM) and the Diabetes Research and Wellness Foundation (SBW). This work received support from the NIH/NIA U54AG075941 to the SenNet Initiative, KAPPSen Tissue Mapping Center. This study was financed, in part, by the São Paulo Research Foundation (FAPESP), Brasil. Process Numbers #2023/06412-0 and #2024/00451-7; Coordenação de Aperfeiçoamento de Pessoal de Nível Superior - Brasil (CAPES), Brasil - Finance Code (001). SV was supported by the 2025 Visiting Research Internship Program (VRIP) at Harvard Medical School. Human islets were provided by the NIDDK-funded Integrated Islet Distribution Program (IIDP) at the City of Hope (NIH grant no. 2UC4DK098085). This work received in-kind support from the NIH/NIA U54AG075941 to the SenNet Initiative, KAPPSen Tissue Mapping Center.
References
- 1. Watkins DA, Ali MK. Measuring the global burden of diabetes: implications for health policy, practice, and research. Lancet. 2023; 402:163–5. https://doi.org/10.1016/S0140-6736(23)01287-4 [PubMed]
- 2. Weir GC, Bonner-Weir S. Five stages of evolving beta-cell dysfunction during progression to diabetes. Diabetes. 2004; 53:S16–21. https://doi.org/10.2337/diabetes.53.suppl_3.s16 [PubMed]
- 3. DeFronzo RA, Ferrannini E, Groop L, Henry RR, Herman WH, Holst JJ, Hu FB, Kahn CR, Raz I, Shulman GI, Simonson DC, Testa MA, Weiss R. Type 2 diabetes mellitus. Nat Rev Dis Primers. 2015; 1:15019. https://doi.org/10.1038/nrdp.2015.19 [PubMed]
- 4. Cha J, Aguayo-Mazzucato C, Thompson PJ. Pancreatic β-cell senescence in diabetes: mechanisms, markers and therapies. Front Endocrinol (Lausanne). 2023; 14:1212716. https://doi.org/10.3389/fendo.2023.1212716 [PubMed]
- 5. Lu X, Xie Q, Pan X, Zhang R, Zhang X, Peng G, Zhang Y, Shen S, Tong N. Type 2 diabetes mellitus in adults: pathogenesis, prevention and therapy. Signal Transduct Target Ther. 2024; 9:262. https://doi.org/10.1038/s41392-024-01951-9 [PubMed]
- 6. López-Otín C, Blasco MA, Partridge L, Serrano M, Kroemer G. Hallmarks of aging: An expanding universe. Cell. 2023; 186:243–78. https://doi.org/10.1016/j.cell.2022.11.001 [PubMed]
- 7. Xie M, Yen Y, Owonikoko TK, Ramalingam SS, Khuri FR, Curran WJ, Doetsch PW, Deng X. Bcl2 induces DNA replication stress by inhibiting ribonucleotide reductase. Cancer Res. 2014; 74:212–23. https://doi.org/10.1158/0008-5472.CAN-13-1536-T [PubMed]
- 8. Yang J, Liu X, Bhalla K, Kim CN, Ibrado AM, Cai J, Peng TI, Jones DP, Wang X. Prevention of apoptosis by Bcl-2: release of cytochrome c from mitochondria blocked. Science. 1997; 275:1129–32. https://doi.org/10.1126/science.275.5303.1129 [PubMed]
- 9. Varghese SS, Dhawan S. Senescence: a double-edged sword in beta-cell health and failure? Front Endocrinol (Lausanne). 2023; 14:1196460. https://doi.org/10.3389/fendo.2023.1196460 [PubMed]
- 10. Aguayo-Mazzucato C. Functional changes in beta cells during ageing and senescence. Diabetologia. 2020; 63:2022–9. https://doi.org/10.1007/s00125-020-05185-6 [PubMed]
- 11. Aguayo-Mazzucato C, Andle J, Lee TB
Jr , Midha A, Talemal L, Chipashvili V, Hollister-Lock J, van Deursen J, Weir G, Bonner-Weir S. Acceleration of β Cell Aging Determines Diabetes and Senolysis Improves Disease Outcomes. Cell Metab. 2019; 30:129–42.e4. https://doi.org/10.1016/j.cmet.2019.05.006 [PubMed] - 12. June CH, Sadelain M. Chimeric Antigen Receptor Therapy. N Engl J Med. 2018; 379:64–73. https://doi.org/10.1056/NEJMra1706169 [PubMed]
- 13. Li JH, Chen YY. A Fresh Approach to Targeting Aging Cells: CAR-T Cells Enhance Senolytic Specificity. Cell Stem Cell. 2020; 27:192–4. https://doi.org/10.1016/j.stem.2020.07.010 [PubMed]
- 14. Amor C, Feucht J, Leibold J, Ho YJ, Zhu C, Alonso-Curbelo D, Mansilla-Soto J, Boyer JA, Li X, Giavridis T, Kulick A, Houlihan S, Peerschke E, et al. Senolytic CAR T cells reverse senescence-associated pathologies. Nature. 2020; 583:127–32. https://doi.org/10.1038/s41586-020-2403-9 [PubMed]
- 15. Hou S, Hao X, Li J, Weng S, Wang J, Zhao T, Li W, Hu X, Deng B, Gu J, Hang Q. TM4SF1 promotes esophageal squamous cell carcinoma metastasis by interacting with integrin α6. Cell Death Dis. 2022; 13:609. https://doi.org/10.1038/s41419-022-05067-2 [PubMed]
- 16. Aguayo-Mazzucato C, van Haaren M, Mruk M, Lee TB
Jr , Crawford C, Hollister-Lock J, Sullivan BA, Johnson JW, Ebrahimi A, Dreyfuss JM, Van Deursen J, Weir GC, Bonner-Weir S. β Cell Aging Markers Have Heterogeneous Distribution and Are Induced by Insulin Resistance. Cell Metab. 2017; 25:898–910.e5. https://doi.org/10.1016/j.cmet.2017.03.015 [PubMed] - 17. Davalos AR, Kawahara M, Malhotra GK, Schaum N, Huang J, Ved U, Beausejour CM, Coppe JP, Rodier F, Campisi J. p53-dependent release of Alarmin HMGB1 is a central mediator of senescent phenotypes. J Cell Biol. 2013; 201:613–29. https://doi.org/10.1083/jcb.201206006 [PubMed]
- 18. Menon R, Behnia F, Polettini J, Saade GR, Campisi J, Velarde M. Placental membrane aging and HMGB1 signaling associated with human parturition. Aging (Albany NY). 2016; 8:216–30. https://doi.org/10.18632/aging.100891 [PubMed]
- 19. Dimri GP, Lee X, Basile G, Acosta M, Scott G, Roskelley C, Medrano EE, Linskens M, Rubelj I, Pereira-Smith O. A biomarker that identifies senescent human cells in culture and in aging skin in vivo. Proc Natl Acad Sci USA. 1995; 92:9363–7. https://doi.org/10.1073/pnas.92.20.9363 [PubMed]
- 20. Childs BG, Bussian TJ, Baker DJ. Cellular Identification and Quantification of Senescence-Associated β-Galactosidase Activity In Vivo. Methods Mol Biol. 2019; 1896:31–8. https://doi.org/10.1007/978-1-4939-8931-7_4 [PubMed]
- 21. Hu H, Zhao R, He Q, Cui C, Song J, Guo X, Zang N, Yang M, Zou Y, Yang J, Li J, Wang L, Xia L, et al. cGAS-STING mediates cytoplasmic mitochondrial-DNA-induced inflammatory signal transduction during accelerated senescence of pancreatic β-cells induced by metabolic stress. FASEB J. 2022; 36:e22266. https://doi.org/10.1096/fj.202101988R [PubMed]
- 22. Chang J, Wang Y, Shao L, Laberge RM, Demaria M, Campisi J, Janakiraman K, Sharpless NE, Ding S, Feng W, Luo Y, Wang X, Aykin-Burns N, et al. Clearance of senescent cells by ABT263 rejuvenates aged hematopoietic stem cells in mice. Nat Med. 2016; 22:78–83. https://doi.org/10.1038/nm.4010 [PubMed]
- 23. Lee JH, Lee J. Endoplasmic Reticulum (ER) Stress and Its Role in Pancreatic β-Cell Dysfunction and Senescence in Type 2 Diabetes. Int J Mol Sci. 2022; 23:4843. https://doi.org/10.3390/ijms23094843 [PubMed]
- 24. Iwasaki K, Carapeto P, Abarca C, Hela F, Sanjines S, Pena S, Le S, Pan H, Jackson M, Cahill C, Midha A, Diniz JA, Baker D, et al. p21-senescent cells drive pancreatic islet dysfunction through targetable paracrine signaling in type 2 diabetes. JCI Insight. 2026; e197310. [Epub ahead of print]. https://doi.org/10.1172/jci.insight.197310 [PubMed]
- 25. Huang W, Hickson LJ, Eirin A, Kirkland JL, Lerman LO. Cellular senescence: the good, the bad and the unknown. Nat Rev Nephrol. 2022; 18:611–27. https://doi.org/10.1038/s41581-022-00601-z [PubMed]
- 26. Zeng W, Liu F, Liu Y, Zhang Z, Hu H, Ning S, Zhang H, Chen X, Liao Z, Zhang Z. Targeting TM4SF1 promotes tumor senescence enhancing CD8+ T cell cytotoxic function in hepatocellular carcinoma. Clin Mol Hepatol. 2025; 31:489–508. https://doi.org/10.3350/cmh.2024.0934 [PubMed]
- 27. Baboota RK, Spinelli R, Erlandsson MC, Brandao BB, Lino M, Yang H, Mardinoglu A, Bokarewa MI, Boucher J, Kahn CR, Smith U. Chronic hyperinsulinemia promotes human hepatocyte senescence. Mol Metab. 2022; 64:101558. https://doi.org/10.1016/j.molmet.2022.101558 [PubMed]
- 28. Li Q, Hagberg CE, Silva Cascales H, Lang S, Hyvönen MT, Salehzadeh F, Chen P, Alexandersson I, Terezaki E, Harms MJ, Kutschke M, Arifen N, Krämer N, et al. Obesity and hyperinsulinemia drive adipocytes to activate a cell cycle program and senesce. Nat Med. 2021; 27:1941–53. https://doi.org/10.1038/s41591-021-01501-8 [PubMed]
- 29. Chow HM, Shi M, Cheng A, Gao Y, Chen G, Song X, So RW, Zhang J, Herrup K. Age-related hyperinsulinemia leads to insulin resistance in neurons and cell-cycle-induced senescence. Nat Neurosci. 2019; 22:1806–19. https://doi.org/10.1038/s41593-019-0505-1 [PubMed]
- 30. Quadros RM, Miura H, Harms DW, Akatsuka H, Sato T, Aida T, Redder R, Richardson GP, Inagaki Y, Sakai D, Buckley SM, Seshacharyulu P, Batra SK, et al. Easi-CRISPR: a robust method for one-step generation of mice carrying conditional and insertion alleles using long ssDNA donors and CRISPR ribonucleoproteins. Genome Biol. 2017; 18:92. https://doi.org/10.1186/s13059-017-1220-4 [PubMed]
- 31. Miura H, Quadros RM, Gurumurthy CB, Ohtsuka M. Easi-CRISPR for creating knock-in and conditional knockout mouse models using long ssDNA donors. Nat Protoc. 2018; 13:195–215. https://doi.org/10.1038/nprot.2017.153 [PubMed]
- 32. Gotoh M, Maki T, Satomi S, Porter J, Bonner-Weir S, O'Hara CJ, Monaco AP. Reproducible high yield of rat islets by stationary in vitro digestion following pancreatic ductal or portal venous collagenase injection. Transplantation. 1987; 43:725–30. https://doi.org/10.1097/00007890-198705000-00024 [PubMed]