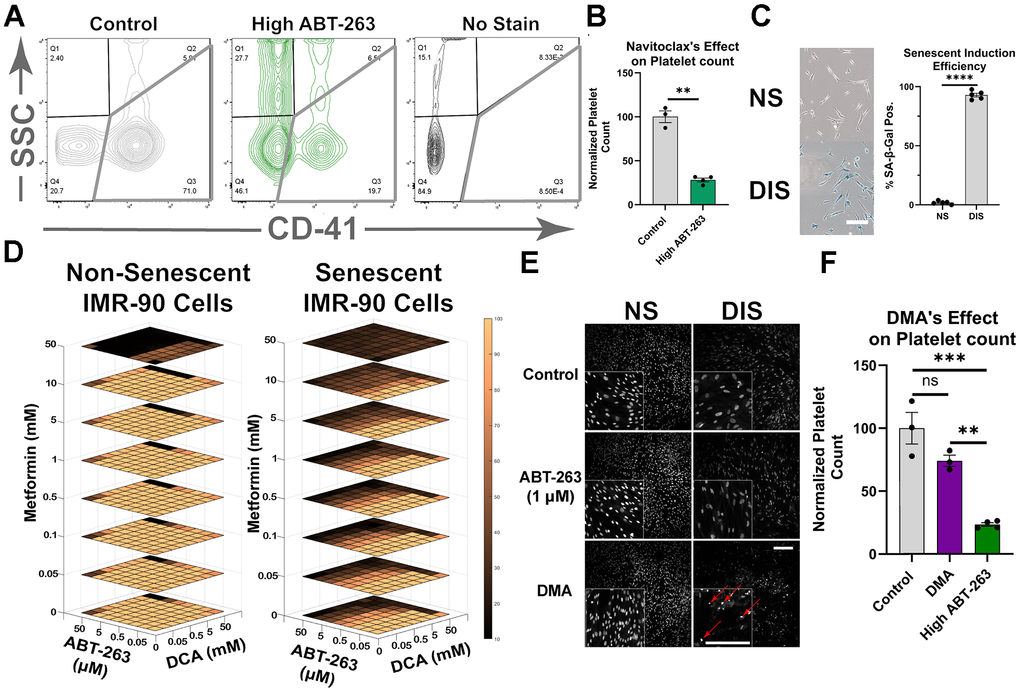
Figure 1.Development of DMA. (A) Representative flow cytometry plot of platelet populations from mice treated with 50 mg/kg ABT-263 and stained with CD41. (B) Normalized platelet counts showing that ABT-263 caused a significant reduction in platelet number (mean ± SEM, unpaired t-test). (C) Representative image of Sa-β-gal of non-senescent (NS) and damage-induced senescent (DIS) IMR-90 cells (Scale bar 200μm), and quantification of Sa-β-gal+ (mean ± SD, unpaired t-test). (D) Normalized cell ablation from remaining nuclei with increasing concentrations of metformin (Met), DCA, and ABT-263 (see methods). (E) Nuclear stain of the remaining fibroblasts after 24-hour treatment of DMA, 1μM ABT-263, and vehicle control. Apoptotic nuclei are highlighted with red arrows (Scale bars 500μm). (F) Normalized platelet counts after administration of 50 mg/kg ABT-263, DMA, or solvent control, showing that DMA did not cause a significant reduction in platelet numbers (mean ± SEM, one-way ANOVA, Bonferroni’s multiple comparisons test). (Statistical significance is denoted as: *p < 0.05, **p < 0.01, ***p < 0.001, ****p < 0.0001).