





Introduction
Cancer cells arise from an accumulation of genetic mutations that result in abnormal, uncontrolled cell division and progressive drug resistance. Age is a significant risk factor for cancer, and the prevalence of cancer has continued to rise with the growing aging population [1, 2]. However, despite the heightened need, developing novel cancer treatments remains a significant challenge. Traditional treatments [3], like radiation and chemotherapy, lack specificity, can cause toxicity, and have a limited ability to adapt to cancer heterogeneity [4].
The progression of a neoplastic cell into metastatic cancer stems in part from differences in the surrounding cellular environment, including the presence of senescent cells (SnCs) [5]. SnCs are cells characterized by halted cell division, the release of senescence-associated secretory phenotype (SASP) factors, and resistance to apoptosis [6, 7]. Senescence is triggered by stress from various sources, including ionizing radiation, replicative exhaustion, viral infections, and factors found in the blood. It often functions as a protective mechanism that allows damaged cells to avoid or indefinitely delay a failed replication cycle. In cancer, senescence can act within the cell as a roadblock to malignancy but, ironically, can also extracellularly facilitate cancer progression through released SASP factors. For example, the SASP factor MMP-13 can remodel the extracellular matrix to support cancer metastasis [8], and the SASP factor IL-6 promotes tumorigenesis through multiple molecular pathways and is upregulated in almost all tumor types [9]. Ideally, both cancer and SnCs should be eliminated.
Many common chemotherapies, such as alkylating agents and anthracyclines, target actively proliferating cells, counterproductively neglect senescent cells, and increase tissue senescence. This enhanced senescence promotes metastasis, immune evasion, and drug resistance among the remaining cancer cells [10]. Moreover, excess senescence is correlated with numerous other age-related diseases [7, 11–21], so senescent cell removal is hypothesized to enhance overall health.
One particularly powerful group of senolytic and chemotherapeutic drugs are the selective BCL-2 family inhibitors, such as ABT-737 and ABT-263 [22, 23]. Navitoclax, also known as ABT-263, and its analogs can target cancer cells and SnCs, but only at doses that cause thrombocytopenia, as both platelets and SnCs depend on BCL-XL for survival. These drugs also fail to work on a broad class of cancers that upregulate alternative anti-apoptotic pathways [24, 25]. The limited efficacy at safe dosages and dose-limiting toxicities have hindered clinical translation, so despite their potential, no anti-apoptotic inhibitor has received FDA approval. To achieve clinical feasibility of navitoclax as a senolytic and/or chemotherapy drug, a novel combination that targets alternative pathways is needed.
Aside from upregulating anti-apoptotic proteins to survive stress, SnCs and cancer cells have impaired energy generation [26]. Both cell types exhibit increased proton leakage from the inner mitochondrial membrane [27], lower mitochondrial ATP production rates [28], and an increase in glycolysis (a phenomenon often referred to in cancer cells as the Warburg effect) [29]. As a result, there has been rising interest in targeting these uniquely compromised mitochondria in cancer and senescent cells for therapeutic purposes, which thus far, have not yielded a safe and efficacious approach [30, 31].
To address this gap, we focused on metformin (Met) and dichloroacetate (DCA), both of which have demonstrated anti-cancer and anti-senescence potential in some experimental systems. Met is a biguanide used as the first-line treatment for hyperglycemia in diabetic patients and has moderate anticancer, senomorphic, and anti-aging effects [32–34]. Met inhibits mitochondrial complex I and gluconeogenesis, attenuating oxidative phosphorylation (OxPhos) and glycolysis [35, 36]. DCA has been studied as a potential therapeutic for cancer, albeit at the high doses that also damage healthy cells [37–40], and its effects on senescence are less known. DCA inhibits pyruvate dehydrogenase kinase (PDK), resulting in an increase in pyruvate in mitochondria and a shift toward oxidative phosphorylation from glycolysis. The combination of DCA and Met have been proposed as a cancer therapy, but have not been explored for reducing senescence [41–43]. Here, we developed a combination of DCA, Met, and a low dose of ABT-263 (DMA), and show that in vitro it robustly eliminates several cancer cell lines and senescent cells produced by different stressors, through a decrease in cellular ATP, but is safe for healthy cells. Moreover, the combination of the three drugs improved physical performance and extended the lifespan of old mice.
Results
DMA is a new, effective, and safe senolytic, while DCA, metformin, their mix, or ABT-263 alone are not
To validate the reported dose-limiting toxicity of ABT-263, namely, thrombocytopenia [23, 44, 45], mice were administered conventional doses of the drug, and platelet numbers were quantified 18 hours later by flow cytometry. Mice treated with the conventional published dose of 50mg/kg of ABT-263 showed a significant reduction in platelet count as compared to controls (Figure 1A, 1B) [6].
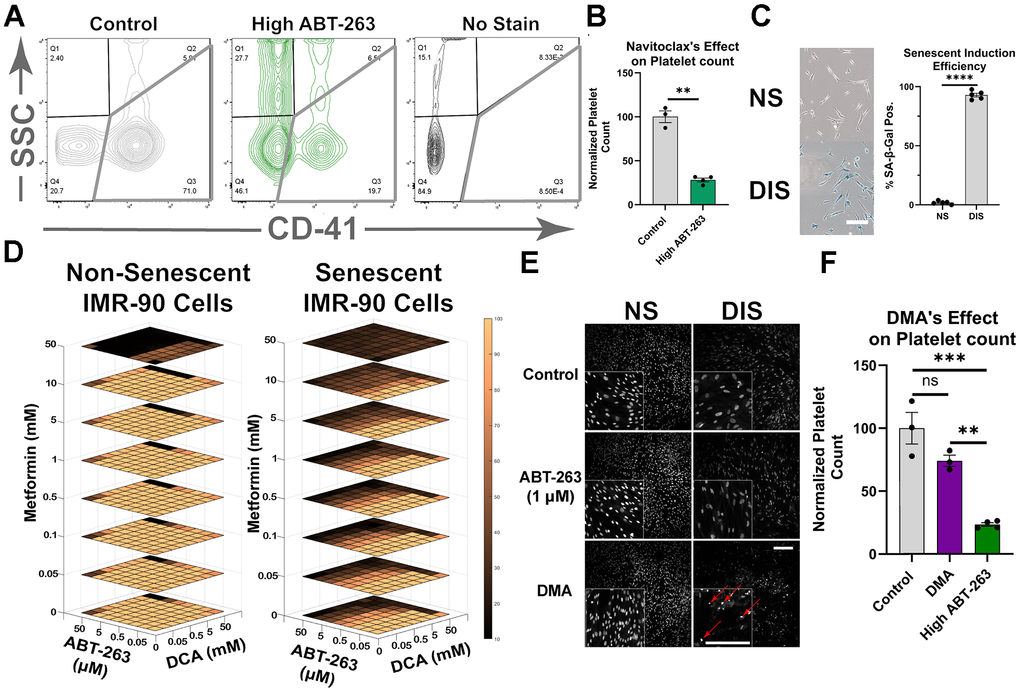
Figure 1. Development of DMA. (A) Representative flow cytometry plot of platelet populations from mice treated with 50 mg/kg ABT-263 and stained with CD41. (B) Normalized platelet counts showing that ABT-263 caused a significant reduction in platelet number (mean ± SEM, unpaired t-test). (C) Representative image of Sa-β-gal of non-senescent (NS) and damage-induced senescent (DIS) IMR-90 cells (Scale bar 200μm), and quantification of Sa-β-gal+ (mean ± SD, unpaired t-test). (D) Normalized cell ablation from remaining nuclei with increasing concentrations of metformin (Met), DCA, and ABT-263 (see methods). (E) Nuclear stain of the remaining fibroblasts after 24-hour treatment of DMA, 1μM ABT-263, and vehicle control. Apoptotic nuclei are highlighted with red arrows (Scale bars 500μm). (F) Normalized platelet counts after administration of 50 mg/kg ABT-263, DMA, or solvent control, showing that DMA did not cause a significant reduction in platelet numbers (mean ± SEM, one-way ANOVA, Bonferroni’s multiple comparisons test). (Statistical significance is denoted as: *p < 0.05, **p < 0.01, ***p < 0.001, ****p < 0.0001).
We hypothesized that the addition of Met and DCA could allow lowering ABT-263 doses and thereby mitigate thrombocytopenia, while still achieving senolytic capacity. Accordingly, senolytic effectiveness of individual drugs, ABT-263, Met, and DCA, as well as their different combinations and concentrations was examined. Damage-induced senescent cells (DIS) were established by UV irradiating IMR-90 human lung fibroblasts, and senescence was confirmed via Sa-β-gal staining (Figure 1C). The DIS and non-senescent IMR-90 Cells were exposed for 24 hours to the three drugs, combined at eight different concentrations: 0 to 50 mM for DCA and Met, and 0 to 50 μM for ABT-263.
First, these studies demonstrated that neither the individual drugs alone nor DCA + Met were effective senolytics at the doses examined (Supplementary Figure 1A). Secondly, individually DCA, Met, and ABT-263 were non-toxic to dividing cells at those doses (Figure 1D). Lastly, the three-drug combination containing a low, non-cytotoxic dose of ABT-263 had robust senolytic capacity: DMA: 5 mM DCA, 5 mM Met, and 1μM ABT-263 (Supplementary Figure 1B). DMA ablated about 60% of DIS cells, without compromising the viability of healthy control cells (Supplementary Figure 1C). Moreover, DMA treatment resulted in higher numbers of apoptotic senescent nuclei, suggesting a direct effect on senescent cells (Figure 1E). Importantly, mice that were administered with DMA in vivo had significantly lower thrombocytopenia, compared to the animals receiving the conventional dose of ABT-263, (Figure 1F). At roughly one-tenth dose of ABT-263, i.e., its concentration in DMA, this drug does not induce thrombocytopenia [46] but when used alone at this dose, it has poor senolytic efficacy [47].
To confirm the robustness of combining DCA + Met with a BCL-2 family inhibitor, the combination was tested with an ABT-263 analog, ABT-737, on two types of senescent cells: replicative and damage-induced IMR-90, (Supplementary Figure 2A–2D). Replicative senescence was confirmed via SA-β-gal (Supplemental Figure 2A), and cell viability was assessed using the CellTiter-Blue assay. As published, ABT-737 (10 μM) markedly reduced the viability of both DIS and RS cells (Supplementary Figure 2B) [22]; DCA alone, Met alone, and their combination did not diminish the viability of DIS, RS, or healthy cells as compared to untreated control, except in the case where 4 days of DCA led to a small statistically significant decrease in numbers of DIS cells only (Supplementary Figure 2C). However, the combination of DCA, Met, and ABT-737 had a much greater effect on decreasing senescent cell viability compared to ABT-737 alone; this effect was seen for both types of senescent cells, DIS and RS, but not healthy cells (Supplementary Figure 2D).
To confirm and extrapolate these data, we tested the primary combination of DMA: DCA, Met, ABT-263, for its senolytic effects on IMR-90 cells induced into senescence by etoposide, a genotoxic carcinogen (Supplementary Figure 3A, 3B). Furthermore, we explored senolytic properties of DMA under different oxygen environments. Laboratory cell culture is typically performed in atmospheric oxygen (~21%), a much higher concentration of oxygen compared to in vivo conditions. Thus, to test the effects of DMA under more physiologic conditions, we added it to “physoxic” cell cultures at 3% oxygen. Under these conditions, there was a slight decrease in healthy control cell viability with DMA, but a much more substantial drop, ~90%, in viability of senescent cells (Supplementary Figure 3C).
To rigorously test whether DMA selectively targets senescent cells while sparing healthy cells, in addition to the non-senescent IMR-90 cell line, the cocktail was tested on primary human neural precursor cells (NPCs), primary human myoblasts, and primary human hepatocytes (Supplementary Figure 3D–3F). DMA caused no reduction in NPC viability and a slight reduction in the viability of human myoblasts (~20%) and human hepatocytes (5%). In myoblasts, a similar effect was observed with DCA alone, in agreement with the effects of this drug on reducing myoblast proliferation [48].
The senescent phenotype often propagates to more cells through the release of SASPs, a phenomenon known as paracrine senescence [49, 50]. To test whether DMA could reduce factors driving paracrine senescence, SnCs were treated with DMA, ABT-263 at varying concentrations, or vehicle control, and then the conditioned medium from these cultures was applied to healthy, proliferating IMR-90 cells. Treatment of SnCs with DMA or ABT-263 alone failed to suppress senescence transmission to healthy recipient cells. However, interestingly, even at a 10-100-fold lower concentration than in the DMA mix this paracrine senescence was significantly reduced (Supplementary Figure 3G). These results suggest that at doses too low for SnCs ablation, DMA can still limit the deleterious bystander effect of senescent cells onto healthy cells.
In summary, DMA exhibited higher senolytic effectiveness than its individual components, or DCA + metformin, moreover, with a better drug safety profile in vitro and in vivo as compared to conventional doses of ABT-263.
DMA eliminates a variety of cancer cell lines by inducing their apoptosis and inhibiting proliferation
Next, we investigated whether DMA would also be effective against cancer cells, as some cancers are resistant to ABT-263 alone and share some of metabolic defects with senescent cells. First, to better understand cancer cell responses to ABT-263, we treated three different cancer cell lines with ABT-263 for two days. Published doses of ABT-263 (10μM) had vastly different effects on cervical (HeLa), breast (MCF-7), and colorectal (SW480) cancer cells (Figure 2A) [22]. SW480 cell viability dropped by 60%, whereas MCF-7 cancer cultures continued to thrive. HeLa cells showed a moderate response, with about a ~25% reduction in viability. Based on literature [24, 25], we hypothesized that resistance to ABT-263 in certain cancers might be due to higher levels of MCL-1, a member of the BCL-2 family that ABT-263 does not target. Western blotting for BCL-2, BCL-W, BCL-XL, and MCL-1 confirmed that levels of MCL-1 protein indeed correlated positively with the resistance to ABT-263 (Supplementary Figure 4A, 4B). Expression levels of these BCL-2 family genes were studied by qRT-PCR, which confirmed the MCL-1 correlation, albeit not always at the same level as the protein, as expected from transcriptional and translational regulation (Supplementary Figure 4C).
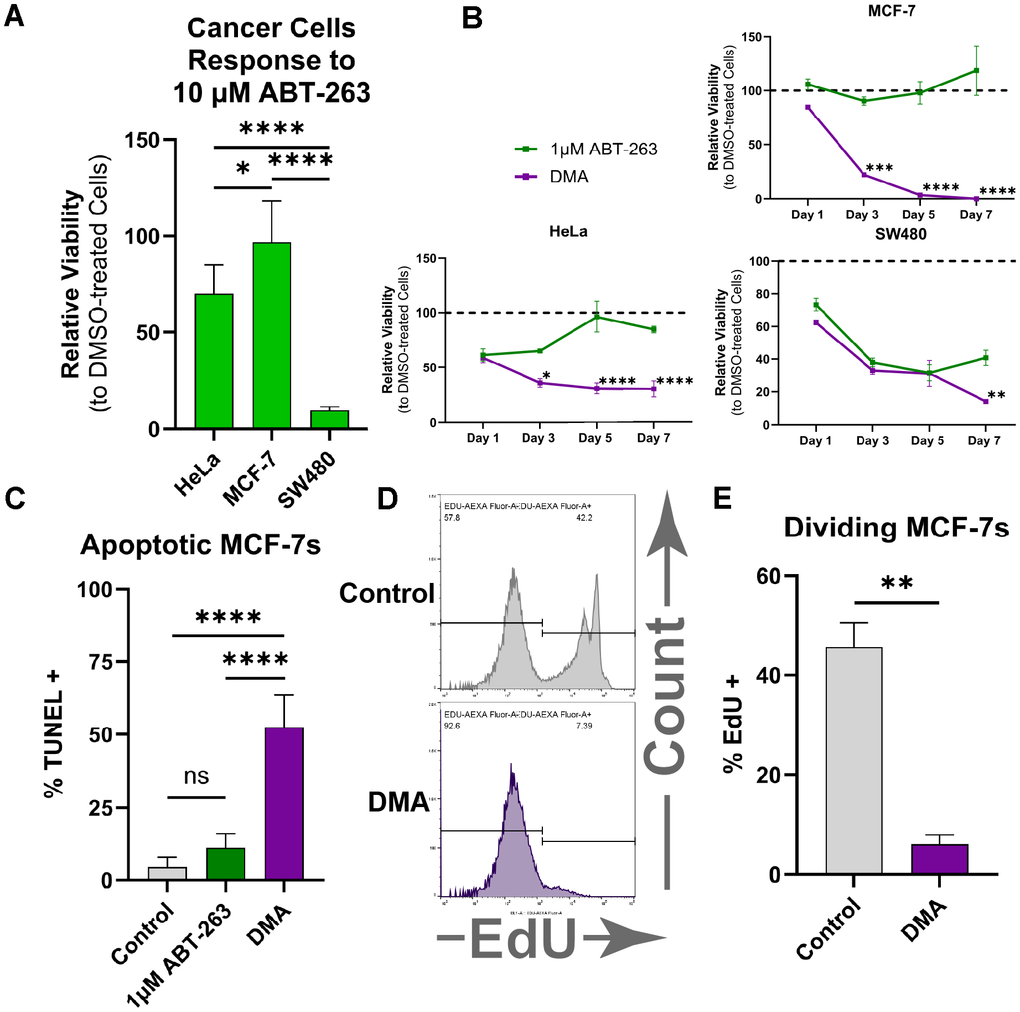
Figure 2. DMA eliminates various types of cancer cells. (A) Relative cell viability of HeLa, MCF-7, and SW480 cancer cell lines measured by the CellTiter-Blue assay, showing variable responses to treatment with 10 μM ABT-263 for two days. (mean ± SD, one-way ANOVA, Bonferroni’s multiple comparisons test). (B) Relative cell viability over 7 days showing that the combination of DCA, metformin, and 1 μM ABT-263 produced a significantly greater reduction in viability than 1 μM ABT-263 alone (mean ± SD, two-way ANOVA, Holm-Šídák test,). (C) Percentage of TUNEL-positive MCF-7 cells, showing significantly greater apoptosis in DMA-treated samples compared with ABT-263 or solvent control (mean ± SD, one-way ANOVA, Bonferroni’s multiple comparisons test). (D) Representative flow cytometry plots of MCF-7 cells treated with DMA or solvent control after EdU staining. (E) Percent EdU-positive MCF-7 cells by flow cytometry, showing significantly less proliferating cells when treated with DMA vs. solvent control (mean ± SD, unpaired t-test). (Statistical significance is denoted as: *p < 0.05, **p < 0.01, ***p < 0.001, ****p < 0.0001).
Next, we examined whether DMA would overcome the resistance associated with elevated MCL-1 and diminish cancer cell viability. Following seven days of DMA in culture, cancer cell viability was significantly reduced in all studied cells, with the most significant impact on the ABT-263-resistant MCF-7 breast cancer cell line (Figure 2B). DMA was necessary and sufficient for ablating the different types of cultured human cancer cells, while DCA + Met, ABT-263 + DCA, or each individual drug failed (Supplementary Figure 4D).
Several studies have reported that a combination of Met with DCA reduces MCL-1 expression [51]. However, when MCF-7 cells were treated with Met and DCA at the concentrations used in DMA and at the published doses (4-fold higher than those used in DMA), no significant change in MCL-1 protein levels were detectable by ELISA (Supplementary Figure 4E). These results demonstrate that DMA acts independently of reduction in MCL-1 levels, albeit they do not address potential effects on MCL-1 function.
The drop in cancer cell numbers could have resulted from an increase in cell death, a decrease in proliferation, or both. To investigate this, TUNEL and EdU assays were performed to assess cell death and proliferation, respectively. From the TUNEL assay, we confirmed that DMA treatment resulted in far more apoptotic cells than 1 μM ABT-263 alone or the vehicle control (Figure 2C). To explore proliferation rates, DMA and EdU were added to MCF-7 cells for 12 hours, after which the cells were analyzed by flow cytometry. The results demonstrated that DMA significantly reduced the proliferation rate of MCF-7 cells (Figure 2D, 2E). Thus, DMA lowers MCF-7 viability by simultaneously promoting apoptosis and inhibiting proliferation.
Summarily, these data suggest that DMA can eliminate cancers of different tissues, including those resistant to BCL-inhibitors, and the observed drop in cancer cell numbers following DMA treatment was due to both increased cell death and reduced cell proliferation.
Mechanisms of DMA selectivity for ablating cancer and senescent cells but not healthy cells
The effects of DMA on decreasing viability of select cancer and senescent cell lines, but not healthy cells, combined with the known activities of DCA and metformin and the metabolic differences between healthy, cancer, and SnCs, suggested the mechanisms behind DMA selectivity. We hypothesized that unhealthy mitochondria and impaired ATP production in both SnCs and cancer cells make them similarly susceptible to DMA. Namely, since SnCs and cancer cells already have compromised mitochondria, the effects of DCA and metformin are expected to be severe. Further, we hypothesized that DCA and Met would fatally deplete ATP in SnCs and cancer cells, making them more susceptible to the low dose of ABT-263. At the same time, the same doses of these drugs in healthy cells would not be deleterious due to their more efficient and resilient mitochondrial function [26–28].
To examine this mechanism, first we treated SnCs, cancer cells, and healthy cells with either DMA, DCA, or 1 μM ABT-263 for 12 hours, and compared the ATP levels using an ATP bioluminescence assay. DMA significantly decreased ATP in both SnCs and MCF-7 cells, bringing levels close to background, while healthy cells were able to maintain their ATP levels (Figure 3A, 3B). ABT-263 alone promoted a trend for reduced ATP in all tested cells including healthy cells, and significantly reduced ATP in the replicative senescent and MCF-7 cells, consistent with capacity of a BCL-2 inhibitor to decrease mitochondrial numbers [52]. As expected from its mechanisms of action, DCA increased ATP in senescent and non-senescent cell lines, but, interestingly, not in cells driven into senescence by replicative exhaustion. Of note, despite the increase of oxidative phosphorylation, DCA is considered to be relatively non-toxic to normal cells in vitro and in vivo [53] and (Supplementary Figure 1B). To test if SnCs ablation was dependent on low ATP levels, exogenous ATP was added to the media as previously published [54, 55], which partially restored SnC viability, making it similar to that with ABT-263 alone (Supplementary Figure 5A).
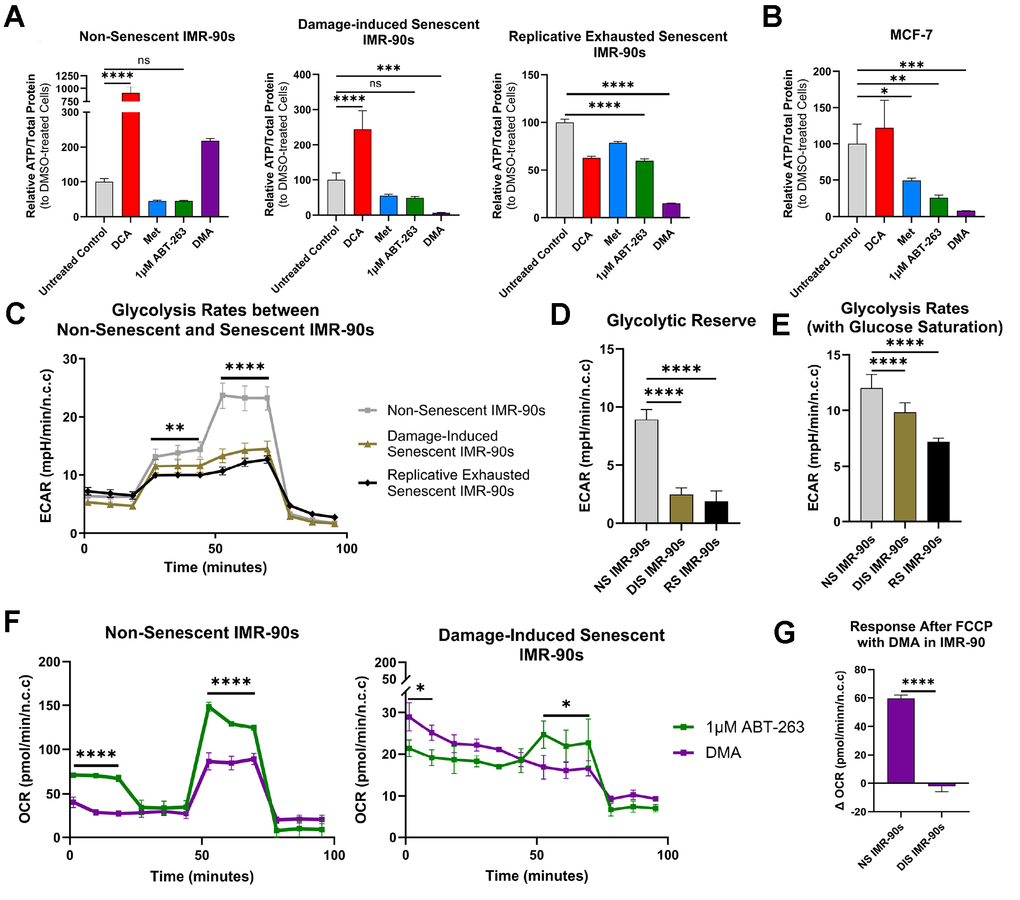
Figure 3. Mechanism of DMA effects on pathogenic versus healthy cells. (A) Bioluminescent ATP assay following the addition of DMA for 12 hours in NS, DIS, and RS cells showing that only DIS and RS exhibited significantly reduced ATP levels as compared to solvent control (mean ± SD, one-way ANOVA, Bonferroni’s multiple comparisons test). (B) Bioluminescent ATP assay following the addition of DMA on MCF-7 cells, showing significantly reduced ATP levels as compared to solvent control (mean ± SD, one-way ANOVA, Bonferroni’s multiple comparisons test). (C) Glycolysis stress test results from NS, DIS, and RS cells, where NS cells were better able to respond to inhibition of oxidative phosphorylation (mean ± SD, two-way ANOVA, Holm-Šídák test). (D) Glycolytic reserve and (E) glycolysis rates from the glycolysis stress tests show that DIS and RS cells cannot increase glycolysis as effectively as NS cells (mean ± SD, one-way ANOVA, Bonferroni’s multiple comparisons test). (F) Results from mitochondrial stress tests on NS and DIS cells treated with 1 μM ABT-263 or DMA, showing that DIS cells were unable to increase respiration in the presence of DMA. (mean ± SD, two-way ANOVA, Holm-Šídák test). (G) Response after FCCP (maximal respiration) in NS and DIS cells shows that NS cells increase respiration more than DIS cells (mean ± SD, unpaired t-test). (Statistical significance is denoted as: *p < 0.05, **p < 0.01, ***p < 0.001, ****p < 0.0001).
Overall, no individual component of DMA caused a total ATP loss in SnC or cancer cells, and only complete DMA had this effect. These results suggest that the addition of DCA and Met to ABT-263 caused selective, ATP-depletion in SnCs and cancer cells, but not healthy cells.
Next, to better understand why DMA caused a decrease in ATP in SnCs but not healthy cells, we used a Seahorse XF Glycolysis Stress Test to examine glycolytic capacity. Our data showed that both DIS and RS cells had lower glycolytic reserves and glycolysis rates (with glucose saturation) than healthy cells, indicating a reduced capacity to compensate for the metformin-induced inhibition of electron transport chain Complex I and glycolysis, combined with the DCA-shift to oxidative phosphorylation (Figure 3C–3E).
Given that glycolytic capacity was diminished in SnCs, we wanted to test if respiration was also impaired. The Seahorse XF Cell Mito Stress Test demonstrated that, unlike glycolysis, there were no differences in respiration between the SnCs and healthy cells under basal conditions (Supplementary Figure 5B). However, with the addition of DMA, healthy cells but not DIS cells, were able to respond to Carbonyl cyanide p-(trifluoromethoxy) phenylhydrazone (FCCP) (Figure 3F, 3G). Since FCCP collapses the mitochondrial membrane potential, stimulating maximal respiration, these data suggest that DIS cells are unable to respond to increased energetic demand and fail to adapt to the additional stress brought on by DMA, leading to cell death.
In summary, DMA can selectively eliminate SnCs and cancer cells due to their similar vulnerabilities in energy production, by lethally diminishing their respiratory spare capacity and preventing sufficient ATP production. Crucially, SnCs could not respond to FCCP after the addition of DMA, showing a limitation in the ability to continue ATP production under stress.
Rejuvenating properties of DMA in vivo
Off-target toxicity remains a critical concern for both senolytic and cancer therapy, in general and particularly at old age, characterized by flare of cancers and tissue senescence [56, 57]. Therefore, although we had established that DMA did not cause acute thrombocytopenia, a major side effect of most BCL-2 family inhibitors, we decided to expand the evaluation of overall DMA safety in vivo, in the functional performance and lifespan of old mice.
DMA or vehicle control were administered to 18–24-month-old mice for two weeks, five days a week. The animals were randomly assigned to DMA vs. control vehicle groups and longitudinally tested in several health assays before and after the treatment (Figure 4A). The data showed that old animals treated with DMA exhibited significantly improved endurance, as measured by treadmill run time compared to vehicle controls. (Figure 4B). Further, DMA caused no adverse effect on the hang test (which measures strength and agility) nor higher overall frailty of the old animals (Figure 4C, 4D).
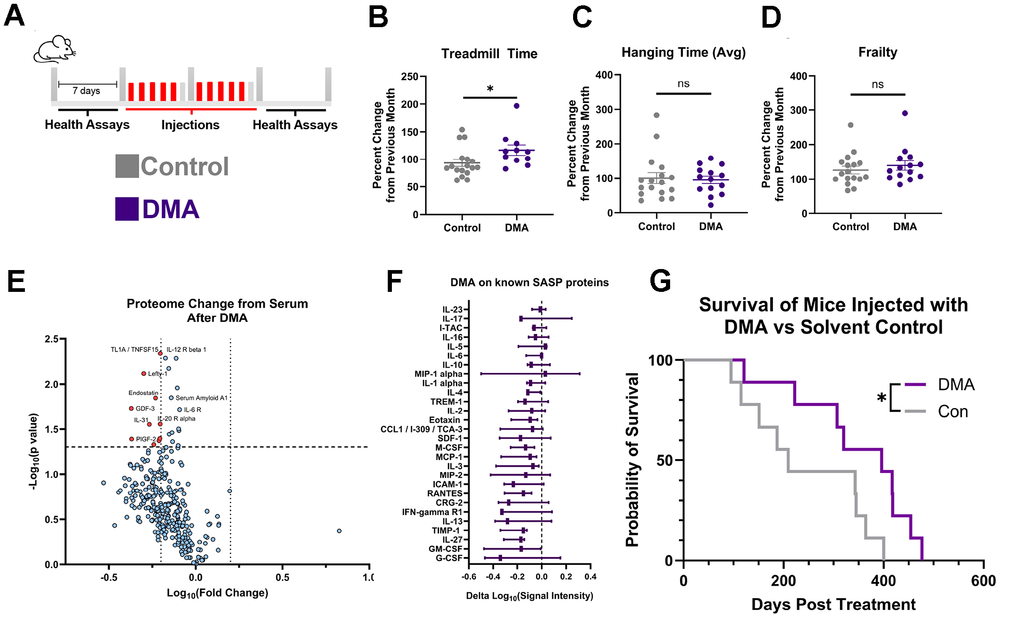
Figure 4. DMA effect in vivo. (A) Diagram of acute injection schedule. (B) Percent change in treadmill run time after injection of DMA or solvent control, compared with the previous month, showing that DMA-treated mice exhibited significantly greater improvement than solvent control-injected mice (mean ± SEM, unpaired t-test, Control: 7 males, 10 females, DMA = 4 males, 7 females (3 mice did not habituate)). (C) Percent change in hanging test time from mice treated with DMA or solvent control, showing no significant difference between groups (mean ± SEM, unpaired t-test, Control: 7 males, 10 females, DMA = 7 males, 7 females). (D) Percent change in frailty from mice treated with DMA or solvent control showing no significant difference between groups (mean ± SEM, unpaired t-test, Control: 7 males, 10 females, DMA 7 males, 7 females). (E) Volcano plot depicting differential serum protein expression in mice after vs. before DMA treatment, expression determined by antibody array, dotted lines at x=-0.2,0.2 and y=1.301(paired t-test, n=3 high throughput studies). (F) Change of known SASPs [6] after DMA injection, expression determined by antibody array (min to max shown, n=3). (G) Survival plot of DMA vs. Control, post treatment (log-rank (Mantel-Cox) test, Control: 3 males, 6 females, DMA = 5 males, 4 females. Median lifespan: Control: n=815, DMA; n=1002). (Statistical significance is denoted as: *p < 0.05, **p < 0.01, ***p < 0.001, ****p < 0.0001).
To examine potential changes in the systemic protein determinants of tissue health, we used antibody capture arrays to longitudinally assay the serum of old mice before and after DMA (Figure 4E). Based on published literature, aging is characterized by elevated levels and noise (or variation in levels) of systemic proteins [58, 59]. Thus, it was notable that some serum proteins, including pro-inflammatory and SASP factors, were reduced by the DMA treatment (Figure 4E). To provide more details to the changes in SASP proteins, quantification of their levels showed an overall downward trend (Figure 4F). Moreover, the levels of systemic proteins in DMA-treated mice were found to trend towards those found in young mice (Supplementary Figure 6A, 6B), suggesting a recalibration of the systemic proteome to a younger state.
Lastly, to better understand the sustained effect of DMA, the combination was administered to the old mice longitudinally, starting at around 18 months of age and continuing until their natural death. The mice were given DMA once daily for five consecutive days per week over two weeks, followed by an eight-week break. The lifespans were recorded. The weights of both cohorts remained stable during the injection schedule (Supplementary Figure 6C). Interestingly, despite being treated with a combination of chemotherapeutic drugs, the average lifespan was not shortened but was instead extended by an average of 102.6 days, or a 41.7% increase post-injection (Figure 4G and Supplementary Figure 6D). While similar initially, the hanging test performance of old mice dosed with DMA had a trend toward improvement as compared to vehicle-treated animals, particularly at later time points of the study (Supplementary Figure 6E). Thus, DMA not only showed potential for being safe in vivo, but it enhanced the lifespan and promoted a healthier profile of the systemic proteome in old mice.
Discussion
This study establishes a feasible therapeutic approach that eliminates both cancer and senescent cells by inducing metabolic stress, which fatally disrupts the already compromised ATP-generating systems. A novel combinational drug, DMA, was able to decrease the viability of three cancer cell types and several senescent cell types, with minor to no ill effects on multiple different healthy cell lines.
Conventional ABT-263 treatment reduced platelet count to ~ 25% of healthy counts, which can contribute to skin-related diseases and may lead to life-threatening outcomes if the counts decline further [60]. Platelets rely on BCL-XL for survival [45] and while reducing the dose of ABT-263 can minimize its toxicity, this also reduces anti-cancer efficacy. In contrast, DMA had a much milder drop in platelets, retaining 70% of normal counts (and not statistically different from control), a level where symptoms typically do not occur [60]. Importantly, the effects of DCA, Met and a 10-fold lower than conventional, less toxic dose of ABT-263 allowed DMA to be effective in eliminating cancer and senescent cells, while each individual drug (or their different two drug combinations) were ineffective. Additionally, in cultured cancer cell lines, DMA ablated the cells overexpressing MCL-1 more effectively than a high dose of ABT-263 alone, suggesting a benefit for treating cancers that resist chemotherapy through elevated MCL-1 [51]. Considering the promising in vitro effects, larger future studies are warranted to evaluate the capacity of DMA to eliminate cancers and its senolytic/senomorphic properties in vivo, including studies using strains genetically predisposed to cancers and senescence of various organ systems [61].
When tested in vivo, DMA improved the physical endurance of old mice after just two weeks of treatment. Moreover, there were no negative impacts on body weight, strength or agility, nor an increase in frailty of DMA-administered animals with prolonged delivery. The mice tolerated the drugs well and, moreover, exhibited a 12% increase in total average lifespan with prolonged administration, despite treatment beginning at the old age of 18 months. Notably, both male (993.8 vs. 809.3 days) and female (945.75 vs. 872.5 days) mice showed a trend toward increased average lifespan; however, sex-specific analyses did not reach statistical significance, likely due to the limited sample size. Further studies are needed to evaluate the safety of this pharmacological approach in different organ systems prior to clinical translation.
Our data demonstrate that DMA acts by aggravating metabolic stress, which fatally disrupts the already compromised ATP-generating systems of both cancer and senescent cells, but is tolerated by the healthy cell lines, such as IMR-90, primary human neural precursors, hepatocytes, and myoblasts. With respect to this molecular mechanism, senescent and malignant cells have similarities in restructured metabolic state marked by inefficient oxidative phosphorylation, heightened glycolytic flux, and disrupted redox balance [26–28]. This maladaptive metabolism exposes a unique vulnerability that was confirmed and exploited in our study. Our data is the first to demonstrate that when treated with DMA, senescent and cancer cells (but not healthy cells) lack the metabolic flexibility to compensate for the metabolic challenge, resulting in an irreversible collapse of energy homeostasis. This forms the basis for a therapeutic strategy through DMA, aimed at concurrently removing senescent and cancer cells without damage to healthy tissues.
Our strategy to simultaneously eliminate SnCs and cancer cells by targeting altered metabolic states and reversing their resistance to apoptosis offers a promising approach for mitigating both chemotherapy and age-driven increases in SASP, possibly preventing additional neoplasia and chronic inflammation. Senescence contributes to the development of numerous age-related diseases through the secretion of SASP factors [7, 11–21], so the selective elimination by DMA of bystander effects of senescent cells may not only treat cancer but also mitigate long-term, age-related pathologies driven by persistent SASP signaling. In support of this notion, there was a decrease in paracrine senescence at doses below those required for SnC ablation, suggesting that drug clearance in vivo may favor a shift toward suppression of SASP factors, potentially extending the therapeutic benefit. This senolytic to senomorphic shift may occur as drug concentrations decrease, leading to less SASP factors induced by apoptotic stress [62], while maintaining modulation of the metabolism, which can additionally dampen SASP [63].
In contrast to gene therapy or cell transplantation, DMA may be broadly available to diverse socioeconomic strata. DCA and Met are FDA-approved and affordable, and ABT-263 has been used in several clinical trials, underlining the additional biomedical relevance of our findings. In summary, this work provides evidence for overlapping, fundamental energy shifts in SnCs and cancer cells, allowing both subsets to avoid apoptosis. This similarity can be leveraged to selectively target these pathological cells using a broadly available, defined pharmacology, without harming healthy cells and simultaneously reducing senescence, neoplasia, and systemic aging.
Methods
In vivo studies with old mice
All animal experimental procedures were performed in accordance with the Guide for Care and Use of Laboratory Animals of the National Institutes of Health and approved by the Office of Laboratory Animal Care (OLAC), UC Berkeley. Aged C57B/6 mice (between 18-25 months old) were purchased from the National Institute of Aging. Blood was collected via chin puncture while the mice were under 2% isoflurane anesthesia, 1 week before injections and 1 week after injections ended. The serum was then isolated by spinning down the blood for 10 minutes at 2,000g and collecting the supernatant.
Drugs for in vivo delivery
Solid ABT-263 was dissolved using 60% Phosal 50 PG (HY-Y1903)/30% polyethylene glycol 400 (NC0814144)/ 10% Ethanol. The mixture was sonicated for 20 seconds. Metformin (ICN15169105) and dichloroacetate (347795) were both dissolved in HBSS.
For the platelet study, ABT-263 alone was administered via oral gavage (5081042) as previously described at a dose of 50 mg/kg [6]. For DMA, ABT-263 was administered via oral gavage as previously described at a dose of 5 mg/kg, while Metformin and dichloroacetate were delivered subcutaneously at a dose of 50 mg/kg.
For acute delivery, ABT-263 was delivered via oral gavage at a concentration of 5 mg/kg/day. DCA and Metformin were injected subcutaneously at a concentration of 50mg/kg/day. Both drugs were given for five consecutive days, followed by a two-day intermission, then the drugs were given for an additional five consecutive days. Control mice were given the solvent alone.
For sustained delivery, DMA was administered at the same dose as acute delivery for five consecutive days, followed by a two-day intermission. The drugs were given for an additional five consecutive days, followed by a 6-week intermission. Control was given the solvent.
Flow cytometry
Blood samples were collected in tubes with heparin (81952-112-09). 50μL of fresh blood was combined with 450 μL of HEPES-buffered Tyrode solution (AAJ67607AP). After, CD41a-FITC (50-955-3) was added at a concentration of 1 to 100 and placed on a rocker for 20 minutes. 2mL of High-Yield Lyse (HYL250) solution was added and incubated at room temperature for 10 minutes. The sample was collected and run with a ThermoFisher Attune NxT. Cells were first filtered based on size (FSC-A), then selected based on CD-41a (BH-1) intensity. For flow cytometry experiments involving nucleated cells, the ThermoFisher Attune NxT was used. Cells were first filtered based on size (FCS vs. SSC), then Doublets were removed (FSC-A vs. FSC-H).
Culturing
IMR-90 cells were cultured in DMEM (MT10017CM), 10% Fetal Bovine Serum (SH3007103), 1% Pen/Strep (15140163), and 1% Non-Essential Amino Acids (M7145-100ML) until about 70% confluency and then passaged. To passage, cells were washed with PBS, and then 0.05% Trypsin (MT25052CI) was added for 2-3 minutes. Cells were spun down and counted. The population doubling level increase was calculated every time using PDLIncrease=(1/Log(2))*(Log(Final Cell Count)-Log(Initial Cell Count)). After calculating the PDL increase, the PDL final was calculated by PDLFinal= PDLIncrease+PDLInitial. For all experiments, Non-senescent IMR-90 cells refer to a PDL lower than 30. Human cancer cell lines were cultured using similar media and passaged using similar methods. Human neural precursor cells and human myoblasts were cultured as previously described [64, 65]. Human hepatocytes were purchased from Lonza (HUCPG) and were cultured according to the manufacturer’s protocol.
Senescence induction
Damage-induced senescence: Samples were prepared by seeding 100,000 low PDL(>30) IMR-90 fibroblast cells in 100 mm by 20 mm sterile petri plates in culture media. Cells are cultured until all petri dishes have reached 80% confluency. Damage-induced senescence was induced by exposing the cells to 16,000 μJ/cm2 of ultraviolet light with Strategene’s UV Stratalinker 2400 once every other day for a total of five times. Senescence was confirmed via Sa-β-gal two days after the final UV. Replicative Senescence: IMR-90 cells were cultured until replicative exhaustion (>PDL 48). Senescence was confirmed via Sa-β-gal. Etoposide senescence induction: Etoposide senescent IMR-90 cells were generated by adding 20μM etoposide for 48 hours. Senescence was confirmed three days after via Sa-β-Gal.
SA-β-gal staining
The Cell Signaling Senescence β-Galactosidase Staining Kit (9860s) was used to detect β-galactosidase levels, and staining was performed according to the manufacturer’s protocol. Briefly, cells were fixed with 1x fixing solution and then washed twice with PBS. The 1x SA-β-gal staining solution was prepared as described by the kit; for every 1 mL, 930 μL of 1x Staining Solution, 10 μL of 100x Solution A, 10 μL of 100x Solution B, and 50 μL of the dissolved x-gal (20mg/mL in DMF) were combined. An additional solution was prepared and used to calculate the amount of either 1 M HCl or 1 M NaOH needed to adjust the pH to a range of 5.9-6.1. After adjusting the pH of the solution, it was added and incubated overnight at 37° C. Samples were viewed with a phase contrast microscope. If a cell’s body was a dark blue color, the cell was considered senescent.
Drugs for in vitro studies
Metformin and dichloroacetate solutions were prepared by dissolving solid metformin hydrochloride (C829T51) and/or sodium dichloroacetate (347795) into cell culture media. ABT-737(C832E72), ABT-263(C832E67), were dissolved in DMSO(89139-666) at 1000x the final desired concentration.
3D-Drug curve
A Multidrop™ Combi nL Reagent Dispenser was used to seed eighty 96-well tissue culture plates with 10,000 cells per well. The cells were left to incubate O/N. Stock drug plates were prepared using a Beckman Coulter Biomek NXp Automated Liquid Handling Workstation with deep 96-well plates. The drugs were transferred from the deep-well plates to the tissue culture plates with cells using the Bravo Automated Liquid Handling Platform. After 24 hours, the cells were fixed with 70% ethanol and stained with Hoechst (Cat: H1399) at a concentration of 10μg/mL in PBS. Plates were sealed with Agilent’s PlateLoc Peelable Aluminum seals and imaged with an Opera Phenix. Harmony was used to quantify the total number of remaining nuclei. After, the number of cells was normalized to untreated cell counts and graphed using MATLAB.
Viability
To assess the levels of cell viability, Promega’s CellTiter-Blue Cell Viability Assay (G8081) was used. Cells were cultured in flat-bottomed 96-well plates at 10,000 cells per well. After the desired drug exposure, the media was replaced with 80μL of Opti-MEM and incubated for 24 hours. Afterwards, 20 μL of Cell Titer-Blue was added. The cells were incubated for two hours. Fluorescence was measured using the SpectraMax M5 plate reader (ex:560/em:590). For analysis, all values were subtracted by blanks (media + CellTiter-Blue, with no cells). Relative viability was calculated by normalizing to the control.
Hypoxia
The hypoxia chamber was set to 3% O2. Both the DIS and Non-senescent IMR-90 cells were placed in the hypoxia chamber for 24 hours before the experiment. Before any media/drugs were changed, the cells were equilibrated in the hypoxia chamber for at least 2 hours.
DMA on paracrine senescence
DIS IMR-90 cells were placed in low serum media with/without varying doses of senolytics for 9 hours. A negative control of healthy IMR-90 cells was also placed in low-serum media. The media from each dish of cells were collected and centrifuged at 300g for 5 minutes to separate any cells from the media. The supernatant was then diluted 2x with fibroblast growth media to make conditioned media. Healthy IMR-90 cells were cultured with the conditioned media for 4 days, and the conditioned media was changed every other day. The cultured cells were then fixed, stained with SA-β-gal, and imaged to determine the percentage of paracrine senescence.
Western blotting
Cells were 10x lysed with 10x Cell Signaling lysis buffer (9803) and Thermo Scientific™ Halt™ Protease Inhibitor Cocktail (1861278). Lysed cells were spun down at 13,000g for 10 minutes, and the supernatant was collected. Protein concentration was determined through the Thermo Scientific Micro BCA™ Protein Assay Kit (23235). Loading sample was prepared by combining 4x Laemmli sample buffer (1610747), 5% beta-mercaptoethanol, 20μg of protein, and PBS for a final volume of 25μL. The solution was vortexed together and heated at 97 °C for 10 minutes. The solution was loaded into SDS-Page gels and run at 120 V for 1 hr. The protein was transferred to a PVDF membrane at 15 V for 16 hrs. The PVDF Papers were placed on a rocker and blocked using 5% milk in TBST buffer for 30 mins, then exposed to primary antibodies (details listed below) in 1% TBST buffer for 2 hrs. GAPDH was detected as a loading control. The membranes were then washed three times using TBST buffer for 5 minutes and exposed to secondary antibodies in 1% milk for 2 hrs. The membranes were again washed three times with TBST buffer for 5 minutes. The chemiluminescent reaction was initiated with Advansta WesternBrightTM ECL HRP (490005-016) and the blot was visualized using UVP ChemStudio PLUS (Supplementary Figure 7).
| Antibody | Catalog Number |
| BCL-2 | ab196495 |
| BCL-W | 2724s |
| BCL-XL | 2764S |
| MCL-1 | 94296S |
| GAPDH | 10494-1-AP |
| Anti-RB, HRP | ab205718 |
qRT-PCR
RNA was extracted with the RNeasy Qiagen (74106) RNA extraction kit. The extracted RNA was then processed with Thermo Fisher’s SuperScript III (11752-050) according to the manufacturer’s protocol. Finally, the qRT-PCR reaction was done using Bio-Rad’s SYBR Green Supermix (1725270) and was run using the CFX Connect Real-Time System.
ELISA
The ELISA for MCL-1 levels was performed using the InvitrogenTM Human Mcl-1/Bcl2L3 ELISA (EH317RB) kit, following the manufacturer’s protocol. A BCA assay was used to load the same protein concentration in all conditions. Absorbance was measured at 450 nm using a SpectraMax iD3 plate reader. A 4-parameter logistic (4PL) curve was used to interpolate the standard curve in Graphpad Prism.
TUNEL
The TUNEL assay was performed on MCF-7s after exposure to DMA for 12 hours. Staining was performed using a modified version of the manufacturer’s protocol. The incubation time of the TUNEL solution was increased to O/N at RT on a rocker. The stained images were imaged on the IXM Molecular Devices ImageXpress Micro. Total nuclei were counted using the provided software, and TUNEL-positive nuclei were counted blindly and manually.
EdU assay
EdU staining was performed using Thermo Fisher’s Click-iT® EdU Imaging Kit (10338). EdU stock was diluted in warm culture media, and cells were pulsed with 10μM EdU for 2-4 hours. Then, the cells were fixed with paraformaldehyde and permeabilized for 20 minutes using Stemcell Technologies’ Intracellular Permeabilization Buffer (100-1451). On the day of the click reaction, Thermo Fisher’s EdU additive solution 10x was diluted in molecular grade water and a reaction mixture was created based on the ThermoFisher’s Click-iT® recipe. The permeabilization buffer was aspirated, and 500 μl of reaction mixture was added to each well in a standard 6-well plate. Cells were washed twice with a 3% BSA solution and once with PBS. FITC standard filter set and 495/519 Excitation/Emission (in nm) were used for imaging.
ATP studies
The total ATP amount was quantified using the ATP Bioluminescence Assay Kit HS II (11 699 709 001) and then normalized with BCA. Cells were seeded at a density of 50,000 cells per well in a 6-well plate. 5mM DCA, 5mM Met, and 1μM ABT-263 was added for 12 hours. After, cells were washed twice with PBS, lifted with trypsin, and washed twice more with PBS. After, cells were lysed with 400 μL of Cell Lysis reagent for 5 minutes at room temperature. The insoluble material in the cell lysates was sedimented by centrifugation at 10,000 g for 2 minutes, and the supernatant was used to measure ATP levels. The standard ATP curve was created using concentrations from 1μM to .00001μM ATP. The luminescent reading was performed using a SpectraMax iD3. For the reading, 50 μL of sample/standard was added to a 96-well plate (white, clear bottom). Then, 50 μL of Luciferase Reagent was added to each well, followed by a one-second delay and a 9-second integrative read. After calculating the ATP concentration, values were normalized by the BCA results.
Glycolytic stress test analysis by Seahorse extracellular flux analyzer
Cells were plated on Agilent Seahorse XF24 Cell Culture Microplates and optimized where control cells were plated at a density of 15,000 cells/well while damage-induced senescent and replicative senescent cells were plated at 80,000 cells/well. Agilent Seahorse XF Glycolysis Stress Test Kit was used per standard protocol (https://www.agilent.com/cs/library/usermanuals/public/XF_Glycolysis_Stress_Test_Kit_User_Guide.pdf). During glycolysis, the extrusion of protons indicates the extracellular acidification rate (ECAR), which was measured using Seahorse extracellular flux XFe24 analyzers, reported by Agilent Seahorse Wave Desktop software, and the data were normalized by cell count.
Mito stress test analysis
Senescent cells were optimized at 80,000 cells per well on Agilent Seahorse XF24 Cell Culture Microplates. Cells were incubated for 24 hours, and in the last hour, media was aspirated, and the cells were incubated in Seahorse media with the drugs. Otherwise, the Agilent Seahorse XF Mito Stress Test Kit was used per standard protocol (https://www.agilent.com/cs/library/usermanuals/public/XF_Cell_Mito_Stress_Test_Kit_User_Guide.pdf). Oxidative phosphorylation, indicated by oxygen consumption rate (OCR), was measured with Seahorse extracellular flux XFe24 analyzers and reported by Agilent Seahorse Wave Desktop software. Cells were analyzed for viability using the CellTiter-Blue Cell Viability Assay, and data were normalized by cell count.
Mouse health studies
For the treadmill exhaustion test, mice were fasted for two hours prior to being placed on the treadmill during both the habituation and testing phases. During the habituation phase, mice were acclimated for a period of 2 days, for 10 minutes each day. On the third day, the testing phase, the treadmill started at a speed of 8 m/min and the treadmill increased at a rate of 1 m/min every 10 minutes for a total of 60 minutes, and increased at a rate of 1 m/min every 5 minutes beyond the 60-minute mark until the mice were exhausted. Exhaustion was defined by the mouse not voluntarily running for more than 10 seconds. If the mouse refused to run for more than a total of 10 seconds, it was considered an invalid run.
The hanging test was performed by placing mice on a 1 cm mesh, 1 mm wire screen positioned 25 cm over soft bedding. Each mouse was placed on the grid so that they could grasp it with all four paws. The grid was then inverted. Mice were recorded for a maximum of 10 minutes, or until the mouse fell into the bedding. The hanging test was repeated 3 times, and the average hang time was recorded. The frailty index was conducted and quantified as previously published [66].
Antibody array
Antibody arrays (Raybiotech, Mouse L308 Array) were performed on mouse serum. The reagents were prepared as per the manufacturer’s instructions. 10 μL of serum was combined with 90 μL PBS and cleared by centrifugation at 13,000g for 5 minutes. The supernatant was dialyzed overnight at 4° C. On the following day, the dialyzed serum was centrifuged at 13,000 g for 5 minutes. After, 35μL of the supernatant, 22μL of Labeling reagent Item B, and 155μL of Labeling buffer Item K were combined and vortexed. The mixture was placed on a rotator for 30 minutes at RT. After 30 minutes, 3 μL of Stop Solution Item D was added. The mixture was then centrifuged at 13,000 g for 5 minutes. Again, the samples were dialyzed O/N at 4° C. The array was dried for an hour and then blocked O/N using the provided blocking buffer. The following day, the dialyzed samples were then spun down at 13,000 g for 5 minutes. 40 μg of protein in 40 μL was combined with 360 μL of blocking buffer and incubated overnight at 4° C. The next day, the array was washed three times with Buffer I for 5 minutes each, followed by two 10-minute washes, and then two 5-minute washes with Buffer II. Then, 400 μL of diluted Cy3-conjugated streptavidin was added to each subarray, covered with a seal and aluminum foil, and incubated overnight at 4° C. The following day, the slides were washed three times with Buffer I for 10 minutes each, followed by two 5-minute washes with Buffer II, and a final wash with DI water for 5 minutes. Finally, the slides were dried and scanned using a Genepix 4400A scanner (Molecular Devices), and the antibody signal values were normalized to the positive and negative values (Supplementary Figure 8).
PCA plot
PCA was performed using the prcomp() function from the stats package in R (version 4.4.2). The resulting PCA scores were visualized using the ggplot2 package (version 4.0.2).
Graphing and statistical analysis
Graphing and statistical analysis was done with GraphPad Prism unless mentioned otherwise in the methods. Organization of the figures and textual edits were made in Illustrator.
Availability of data and materials
The datasets used and/or analyzed during the current study have been submitted with the manuscript.
Supplementary Materials
Author Contributions
ZRR participated in the planning of these studies, contributed Figures 1–4, Supplementary Figures 1–8, and co-wrote the manuscript. SF co-wrote the manuscript, contributed to Figures 1C, 2A, 2B. DYC contributed to Figures 3C–3G, and Supplementary Figure 5B and edited the manuscript. SS contributed to the mouse work. ABC contributed to Figure 1C, 3C and Supplementary Figures 2A, 2C, 2D, 3C, 3D. NM contributed to Supplementary Figure 4E. EU contributed to Supplementary Figure 3G. MNK contributed to Supplementary Figure 6B and edited the manuscript. CK organized the mouse work. MJC contributed to the planning of these studies and edited the manuscript. IMC planned and directed the work, integrated and interpreted the data, and co-wrote the manuscript.
Acknowledgments
We would like to thank Dr. Mary West and the QB3 Cell and Tissue Analysis Facility and High-Throughput Screening Facility for help and support, especially for use with the IXM XLS, MetaXpress, plate-handling robotics, and qPCR instruments. We thank Rana Alzalzalee, Giselle D. Sierra, Jessica Zhang, Hayden Young, and Karan R. Malhotra for technical assistance with these studies and Nathan Wong and Ilana Silverstein for their contributions to the early background work.
Conflicts of Interest
I.M.C. is a co-founder and Chief Scientific Officer of Generation Lab. The research presented in this publication was conceived and conducted independently of Generation Lab and received no funding or input from the company. No other authors have Conflicts of Interest to declare.
Ethical Statement
All animal experimental procedures were performed in accordance with the Guide for Care and Use of Laboratory Animals of the National Institutes of Health and approved by the Office of Laboratory Animal Care (OLAC), UC Berkeley: AUP-2016-07-8963-3.
Funding
This work was supported by National Institutes of Health (NIH) NIA grant R01AG071787 to IMC, Open Philanthropy award to IC, CDMRP/USAMRDC TX230133 grant to IMC, as well as a Chancellor’s Fellowship and NIA T32 AG000266-26 to ZRR.
References
- 1. López-Otín C, Blasco MA, Partridge L, Serrano M, Kroemer G. The hallmarks of aging. Cell. 2013; 153:1194–217. https://doi.org/10.1016/j.cell.2013.05.039 [PubMed]
- 2. Li L, Shan T, Zhang D, Ma F. Nowcasting and forecasting global aging and cancer burden: analysis of data from the GLOBOCAN and Global Burden of Disease Study. J Natl Cancer Cent. 2024; 4:223–32. https://doi.org/10.1016/j.jncc.2024.05.002 [PubMed]
- 3. Chakraborty S, Rahman T. The difficulties in cancer treatment. Ecancermedicalscience. 2012; 6:ed16. https://doi.org/10.3332/ecancer.2012.ed16 [PubMed]
- 4. Schwab ED, Pienta KJ. Cancer as a complex adaptive system. Med Hypotheses. 1996; 47:235–41. https://doi.org/10.1016/s0306-9877(96)90086-9 [PubMed]
- 5. Junaid M, Lee A, Kim J, Park TJ, Lim SB. Transcriptional Heterogeneity of Cellular Senescence in Cancer. Mol Cells. 2022; 45:610–9. https://doi.org/10.14348/molcells.2022.0036 [PubMed]
- 6. Jeon OH, Mehdipour M, Gil TH, Kang M, Aguirre NW, Robinson ZR, Kato C, Etienne J, Lee HG, Alimirah F, Walavalkar V, Desprez PY, Conboy MJ, et al. Systemic induction of senescence in young mice after single heterochronic blood exchange. Nat Metab. 2022; 4:995–1006. https://doi.org/10.1038/s42255-022-00609-6 [PubMed]
- 7. Gorgoulis V, Adams PD, Alimonti A, Bennett DC, Bischof O, Bishop C, Campisi J, Collado M, Evangelou K, Ferbeyre G, Gil J, Hara E, Krizhanovsky V, et al. Cellular Senescence: Defining a Path Forward. Cell. 2019; 179:813–27. https://doi.org/10.1016/j.cell.2019.10.005 [PubMed]
- 8. Chidambaram D, Subashini V, Nanthanalaxmi M, Saranya I, Selvamurugan N. Regulation of matrix metalloproteinase-13 in cancer: Signaling pathways and non-coding RNAs in tumor progression and therapeutic targeting. World J Clin Oncol. 2025; 16:105996. https://doi.org/10.5306/wjco.v16.i6.105996 [PubMed]
- 9. Kumari N, Dwarakanath BS, Das A, Bhatt AN. Role of interleukin-6 in cancer progression and therapeutic resistance. Tumour Biol. 2016; 37:11553–72. https://doi.org/10.1007/s13277-016-5098-7 [PubMed]
- 10. Wyld L, Bellantuono I, Tchkonia T, Morgan J, Turner O, Foss F, George J, Danson S, Kirkland JL. Senescence and Cancer: A Review of Clinical Implications of Senescence and Senotherapies. Cancers (Basel). 2020; 12:2134. https://doi.org/10.3390/cancers12082134 [PubMed]
- 11. Gorenne I, Kavurma M, Scott S, Bennett M. Vascular smooth muscle cell senescence in atherosclerosis. Cardiovasc Res. 2006; 72:9–17. https://doi.org/10.1016/j.cardiores.2006.06.004 [PubMed]
- 12. Blasiak J. Senescence in the pathogenesis of age-related macular degeneration. Cell Mol Life Sci. 2020; 77:789–805. https://doi.org/10.1007/s00018-019-03420-x [PubMed]
- 13. Jeon OH, David N, Campisi J, Elisseeff JH. Senescent cells and osteoarthritis: a painful connection. J Clin Invest. 2018; 128:1229–37. https://doi.org/10.1172/JCI95147 [PubMed]
- 14. Dorigatti AO, Riordan R, Yu Z, Ross G, Wang R, Reynolds-Lallement N, Magnusson K, Galvan V, Perez VI. Brain cellular senescence in mouse models of Alzheimer's disease. Geroscience. 2022; 44:1157–68. https://doi.org/10.1007/s11357-022-00531-5 [PubMed]
- 15. Baker DJ, Wijshake T, Tchkonia T, LeBrasseur NK, Childs BG, van de Sluis B, Kirkland JL, van Deursen JM. Clearance of p16Ink4a-positive senescent cells delays ageing-associated disorders. Nature. 2011; 479:232–6. https://doi.org/10.1038/nature10600 [PubMed]
- 16. Villaret A, Galitzky J, Decaunes P, Estève D, Marques MA, Sengenès C, Chiotasso P, Tchkonia T, Lafontan M, Kirkland JL, Bouloumié A. Adipose tissue endothelial cells from obese human subjects: differences among depots in angiogenic, metabolic, and inflammatory gene expression and cellular senescence. Diabetes. 2010; 59:2755–63. https://doi.org/10.2337/db10-0398 [PubMed]
- 17. Tchkonia T, Morbeck DE, Von Zglinicki T, Van Deursen J, Lustgarten J, Scrable H, Khosla S, Jensen MD, Kirkland JL. Fat tissue, aging, and cellular senescence. Aging Cell. 2010; 9:667–84. https://doi.org/10.1111/j.1474-9726.2010.00608.x [PubMed]
- 18. Mendez MV, Raffetto JD, Phillips T, Menzoian JO, Park HY. The proliferative capacity of neonatal skin fibroblasts is reduced after exposure to venous ulcer wound fluid: A potential mechanism for senescence in venous ulcers. J Vasc Surg. 1999; 30:734–43. https://doi.org/10.1016/s0741-5214(99)70113-8 [PubMed]
- 19. Woldhuis RR, de Vries M, Timens W, van den Berge M, Demaria M, Oliver BG, Heijink IH, Brandsma CA. Link between increased cellular senescence and extracellular matrix changes in COPD. Am J Physiol Lung Cell Mol Physiol. 2020; 319:L48–60. https://doi.org/10.1152/ajplung.00028.2020 [PubMed]
- 20. Thompson PJ, Shah A, Ntranos V, Van Gool F, Atkinson M, Bhushan A. Targeted Elimination of Senescent Beta Cells Prevents Type 1 Diabetes. Cell Metab. 2019; 29:1045–60.e10. https://doi.org/10.1016/j.cmet.2019.01.021 [PubMed]
- 21. Krtolica A, Parrinello S, Lockett S, Desprez PY, Campisi J. Senescent fibroblasts promote epithelial cell growth and tumorigenesis: a link between cancer and aging. Proc Natl Acad Sci USA. 2001; 98:12072–7. https://doi.org/10.1073/pnas.211053698 [PubMed]
- 22. Yosef R, Pilpel N, Tokarsky-Amiel R, Biran A, Ovadya Y, Cohen S, Vadai E, Dassa L, Shahar E, Condiotti R, Ben-Porath I, Krizhanovsky V. Directed elimination of senescent cells by inhibition of BCL-W and BCL-XL. Nat Commun. 2016; 7:11190. https://doi.org/10.1038/ncomms11190 [PubMed]
- 23. Vlahovic G, Karantza V, Wang D, Cosgrove D, Rudersdorf N, Yang J, Xiong H, Busman T, Mabry M. A phase I safety and pharmacokinetic study of ABT-263 in combination with carboplatin/paclitaxel in the treatment of patients with solid tumors. Invest New Drugs. 2014; 32:976–84. https://doi.org/10.1007/s10637-014-0116-3 [PubMed]
- 24. Wang B, Ni Z, Dai X, Qin L, Li X, Xu L, Lian J, He F. The Bcl-2/xL inhibitor ABT-263 increases the stability of Mcl-1 mRNA and protein in hepatocellular carcinoma cells. Mol Cancer. 2014; 13:98. https://doi.org/10.1186/1476-4598-13-98 [PubMed]
- 25. Lee YC, Wang LJ, Huang CH, Shi YJ, Chang LS. ABT-263-induced MCL1 upregulation depends on autophagy-mediated 4EBP1 downregulation in human leukemia cells. Cancer Lett. 2018; 432:191–204. https://doi.org/10.1016/j.canlet.2018.06.019 [PubMed]
- 26. Passos JF, Saretzki G, Ahmed S, Nelson G, Richter T, Peters H, Wappler I, Birket MJ, Harold G, Schaeuble K, Birch-Machin MA, Kirkwood TB, von Zglinicki T. Mitochondrial dysfunction accounts for the stochastic heterogeneity in telomere-dependent senescence. PLoS Biol. 2007; 5:e110. https://doi.org/10.1371/journal.pbio.0050110 [PubMed]
- 27. Hutter E, Renner K, Pfister G, Stöckl P, Jansen-Dürr P, Gnaiger E. Senescence-associated changes in respiration and oxidative phosphorylation in primary human fibroblasts. Biochem J. 2004; 380:919–28. https://doi.org/10.1042/BJ20040095 [PubMed]
- 28. Miwa S, Kashyap S, Chini E, von Zglinicki T. Mitochondrial dysfunction in cell senescence and aging. J Clin Invest. 2022; 132:e158447. https://doi.org/10.1172/JCI158447 [PubMed]
- 29. Korolchuk VI, Miwa S, Carroll B, von Zglinicki T. Mitochondria in Cell Senescence: Is Mitophagy the Weakest Link? EBioMedicine. 2017; 21:7–13. https://doi.org/10.1016/j.ebiom.2017.03.020 [PubMed]
- 30. Hubackova S, Davidova E, Rohlenova K, Stursa J, Werner L, Andera L, Dong L, Terp MG, Hodny Z, Ditzel HJ, Rohlena J, Neuzil J. Selective elimination of senescent cells by mitochondrial targeting is regulated by ANT2. Cell Death Differ. 2019; 26:276–90. https://doi.org/10.1038/s41418-018-0118-3 [PubMed]
- 31. Wang Q, Yuan Y, Liu J, Li C, Jiang X. The role of mitochondria in aging, cell death, and tumor immunity. Front Immunol. 2024; 15:1520072. https://doi.org/10.3389/fimmu.2024.1520072 [PubMed]
- 32. Blandino G, Valerio M, Cioce M, Mori F, Casadei L, Pulito C, Sacconi A, Biagioni F, Cortese G, Galanti S, Manetti C, Citro G, Muti P, Strano S. Metformin elicits anticancer effects through the sequential modulation of DICER and c-MYC. Nat Commun. 2012; 3:865. https://doi.org/10.1038/ncomms1859 [PubMed]
- 33. Abou Zaki R, El-Osta A. Metformin: decelerates biomarkers of aging clocks. Signal Transduct Target Ther. 2024; 9:319. https://doi.org/10.1038/s41392-024-02046-1 [PubMed]
- 34. Zhu L, Yang K, Ren Z, Yin D, Zhou Y. Metformin as anticancer agent and adjuvant in cancer combination therapy: Current progress and future prospect. Transl Oncol. 2024; 44:101945. https://doi.org/10.1016/j.tranon.2024.101945 [PubMed]
- 35. El-Mir MY, Nogueira V, Fontaine E, Avéret N, Rigoulet M, Leverve X. Dimethylbiguanide inhibits cell respiration via an indirect effect targeted on the respiratory chain complex I. J Biol Chem. 2000; 275:223–8. https://doi.org/10.1074/jbc.275.1.223 [PubMed]
- 36. Zhou G, Myers R, Li Y, Chen Y, Shen X, Fenyk-Melody J, Wu M, Ventre J, Doebber T, Fujii N, Musi N, Hirshman MF, Goodyear LJ, Moller DE. Role of AMP-activated protein kinase in mechanism of metformin action. J Clin Invest. 2001; 108:1167–74. https://doi.org/10.1172/JCI13505 [PubMed]
- 37. Mizock BA, Falk JL. Lactic acidosis in critical illness. Crit Care Med. 1992; 20:80–93. https://doi.org/10.1097/00003246-199201000-00020 [PubMed]
- 38. Michelakis ED, Webster L, Mackey JR. Dichloroacetate (DCA) as a potential metabolic-targeting therapy for cancer. Br J Cancer. 2008; 99:989–94. https://doi.org/10.1038/sj.bjc.6604554 [PubMed]
- 39. Stacpoole PW. Therapeutic Targeting of the Pyruvate Dehydrogenase Complex/Pyruvate Dehydrogenase Kinase (PDC/PDK) Axis in Cancer. J Natl Cancer Inst. 2017; 109. https://doi.org/10.1093/jnci/djx071 [PubMed]
- 40. Powell SF, Mazurczak M, Dib EG, Bleeker JS, Geeraerts LH, Tinguely M, Lohr MM, McGraw SC, Jensen AW, Ellison CA, Black LJ, Puumala SE, Reed VJ, et al. Phase II study of dichloroacetate, an inhibitor of pyruvate dehydrogenase, in combination with chemoradiotherapy for unresected, locally advanced head and neck squamous cell carcinoma. Invest New Drugs. 2022; 40:622–33. https://doi.org/10.1007/s10637-022-01235-5 [PubMed]
- 41. Voltan R, Rimondi E, Melloni E, Gilli P, Bertolasi V, Casciano F, Rigolin GM, Zauli G, Secchiero P. Metformin combined with sodium dichloroacetate promotes B leukemic cell death by suppressing anti-apoptotic protein Mcl-1. Oncotarget. 2016; 7:18965–77. https://doi.org/10.18632/oncotarget.7879 [PubMed]
- 42. Choi YW, Lim IK. Sensitization of metformin-cytotoxicity by dichloroacetate via reprogramming glucose metabolism in cancer cells. Cancer Lett. 2014; 346:300–8. https://doi.org/10.1016/j.canlet.2014.01.015 [PubMed]
- 43. Li B, Li X, Ni Z, Zhang Y, Zeng Y, Yan X, Huang Y, He J, Lyu X, Wu Y, Wang Y, Zheng Y, He F. Dichloroacetate and metformin synergistically suppress the growth of ovarian cancer cells. Oncotarget. 2016; 7:59458–70. https://doi.org/10.18632/oncotarget.10694 [PubMed]
- 44. Tse C, Shoemaker AR, Adickes J, Anderson MG, Chen J, Jin S, Johnson EF, Marsh KC, Mitten MJ, Nimmer P, Roberts L, Tahir SK, Xiao Y, et al. ABT-263: a potent and orally bioavailable Bcl-2 family inhibitor. Cancer Res. 2008; 68:3421–8. https://doi.org/10.1158/0008-5472.CAN-07-5836 [PubMed]
- 45. Zhang H, Nimmer PM, Tahir SK, Chen J, Fryer RM, Hahn KR, Iciek LA, Morgan SJ, Nasarre MC, Nelson R, Preusser LC, Reinhart GA, Smith ML, et al. Bcl-2 family proteins are essential for platelet survival. Cell Death Differ. 2007; 14:943–51. https://doi.org/10.1038/sj.cdd.4402081 [PubMed]
- 46. Fielder E, Wan T, Alimohammadiha G, Ishaq A, Low E, Weigand BM, Kelly G, Parker C, Griffin B, Jurk D, Korolchuk VI, von Zglinicki T, Miwa S. Short senolytic or senostatic interventions rescue progression of radiation-induced frailty and premature ageing in mice. Elife. 2022; 11:e75492. https://doi.org/10.7554/eLife.75492 [PubMed]
- 47. Born E, Lipskaia L, Breau M, Houssaini A, Beaulieu D, Marcos E, Pierre R, Do Cruzeiro M, Lefevre M, Derumeaux G, Bulavin DV, Delcroix M, Quarck R, et al. Eliminating Senescent Cells Can Promote Pulmonary Hypertension Development and Progression. Circulation. 2023; 147:650–66. https://doi.org/10.1161/CIRCULATIONAHA.122.058794 [PubMed]
- 48. Delaney LM, Ho N, Morrison J, Farias NR, Mosser DD, Coomber BL. Dichloroacetate affects proliferation but not survival of human colorectal cancer cells. Apoptosis. 2015; 20:63–74. https://doi.org/10.1007/s10495-014-1046-4 [PubMed]
- 49. Kang C, Elledge SJ. How autophagy both activates and inhibits cellular senescence. Autophagy. 2016; 12:898–9. https://doi.org/10.1080/15548627.2015.1121361 [PubMed]
- 50. Shimizu K, Inuzuka H, Tokunaga F. The interplay between cell death and senescence in cancer. Semin Cancer Biol. 2025; 108:1–16. https://doi.org/10.1016/j.semcancer.2024.11.001 [PubMed]
- 51. Troiani M, Colucci M, D'Ambrosio M, Guccini I, Pasquini E, Varesi A, Valdata A, Mosole S, Revandkar A, Attanasio G, Rinaldi A, Rinaldi A, Bolis M, et al. Single-cell transcriptomics identifies Mcl-1 as a target for senolytic therapy in cancer. Nat Commun. 2022; 13:2177. https://doi.org/10.1038/s41467-022-29824-1 [PubMed]
- 52. Ichim G, Lopez J, Ahmed SU, Muthalagu N, Giampazolias E, Delgado ME, Haller M, Riley JS, Mason SM, Athineos D, Parsons MJ, van de Kooij B, Bouchier-Hayes L, et al. Limited mitochondrial permeabilization causes DNA damage and genomic instability in the absence of cell death. Mol Cell. 2015; 57:860–72. https://doi.org/10.1016/j.molcel.2015.01.018 [PubMed]
- 53. Bonnet S, Archer SL, Allalunis-Turner J, Haromy A, Beaulieu C, Thompson R, Lee CT, Lopaschuk GD, Puttagunta L, Bonnet S, Harry G, Hashimoto K, Porter CJ, et al. A mitochondria-K+ channel axis is suppressed in cancer and its normalization promotes apoptosis and inhibits cancer growth. Cancer Cell. 2007; 11:37–51. https://doi.org/10.1016/j.ccr.2006.10.020 [PubMed]
- 54. Espada L, Dakhovnik A, Chaudhari P, Martirosyan A, Miek L, Poliezhaieva T, Schaub Y, Nair A, Döring N, Rahnis N, Werz O, Koeberle A, Kirkpatrick J, et al. Loss of metabolic plasticity underlies metformin toxicity in aged Caenorhabditis elegans. Nat Metab. 2020; 2:1316–31. https://doi.org/10.1038/s42255-020-00307-1 [PubMed]
- 55. Wang X, Li Y, Qian Y, Cao Y, Shriwas P, Zhang H, Chen X. Extracellular ATP, as an energy and phosphorylating molecule, induces different types of drug resistances in cancer cells through ATP internalization and intracellular ATP level increase. Oncotarget. 2017; 8:87860–77. https://doi.org/10.18632/oncotarget.21231 [PubMed]
- 56. Saliev T, Singh PB. Targeting Senescence: A Review of Senolytics and Senomorphics in Anti-Aging Interventions. Biomolecules. 2025; 15:860. https://doi.org/10.3390/biom15060860 [PubMed]
- 57. Tufail M, Huang YQ, Hu JJ, Liang J, He CY, Wan WD, Jiang CH, Wu H, Li N. Cellular Aging and Senescence in Cancer: A Holistic Review of Cellular Fate Determinants. Aging Dis. 2024; 16:1483–512. https://doi.org/10.14336/AD.2024.0421 [PubMed]
- 58. Kim D, Kiprov DD, Luellen C, Lieb M, Liu C, Watanabe E, Mei X, Cassaleto K, Kramer J, Conboy MJ, Conboy IM. Old plasma dilution reduces human biological age: a clinical study. Geroscience. 2022; 44:2701–20. https://doi.org/10.1007/s11357-022-00645-w [PubMed]
- 59. Sviercovich A, Mei X, Xie G, Conboy MJ, Conboy IM. The dominance of old blood, and age-related increase in protein production and noise. Ageing Res Rev. 2025; 104:102641. https://doi.org/10.1016/j.arr.2024.102641 [PubMed]
- 60. Gauer RL, Whitaker DJ. Thrombocytopenia: Evaluation and Management. Am Fam Physician. 2022; 106:288–98. [PubMed]
- 61. Zhou Y, Xia J, Xu S, She T, Zhang Y, Sun Y, Wen M, Jiang T, Xiong Y, Lei J. Experimental mouse models for translational human cancer research. Front Immunol. 2023; 14:1095388. https://doi.org/10.3389/fimmu.2023.1095388 [PubMed]
- 62. Victorelli S, Salmonowicz H, Chapman J, Martini H, Vizioli MG, Riley JS, Cloix C, Hall-Younger E, Machado Espindola-Netto J, Jurk D, Lagnado AB, Sales Gomez L, Farr JN, et al. Apoptotic stress causes mtDNA release during senescence and drives the SASP. Nature. 2023; 622:627–36. https://doi.org/10.1038/s41586-023-06621-4 [PubMed]
- 63. Frasca D, Saada YB, Garcia D, Friguet B. Effects of cellular senescence on metabolic pathways in non-immune and immune cells. Mech Ageing Dev. 2021; 194:111428. https://doi.org/10.1016/j.mad.2020.111428 [PubMed]
- 64. Kim D, Kim S, Sung A, Patel N, Wong N, Conboy MJ, Conboy IM. Autologous treatment for ALS with implication for broad neuroprotection. Transl Neurodegener. 2022; 11:16. https://doi.org/10.1186/s40035-022-00290-5 [PubMed]
- 65. Conboy MJ, Conboy IM. Preparation of Adult Muscle Fiber-Associated Stem/Precursor Cells. In: Conboy IM, Schaffer DV, Barcellos-Hoff MH, Li S, editors. Protocols for Adult Stem Cells [Internet]. Totowa, NJ: Humana Press; 2010; 621:149–63. https://doi.org/10.1007/978-1-60761-063-2_10 [PubMed]
- 66. Kato C, Zheng J, Quang C, Siopack S, Cruz J, Robinson ZR, Fong N, Zhang ZA, Young P, Conboy MJ, Conboy IM. Sex-specific longitudinal reversal of aging in old frail mice. Aging (Albany NY). 2025; 17:2252–77. https://doi.org/10.18632/aging.206304 [PubMed]