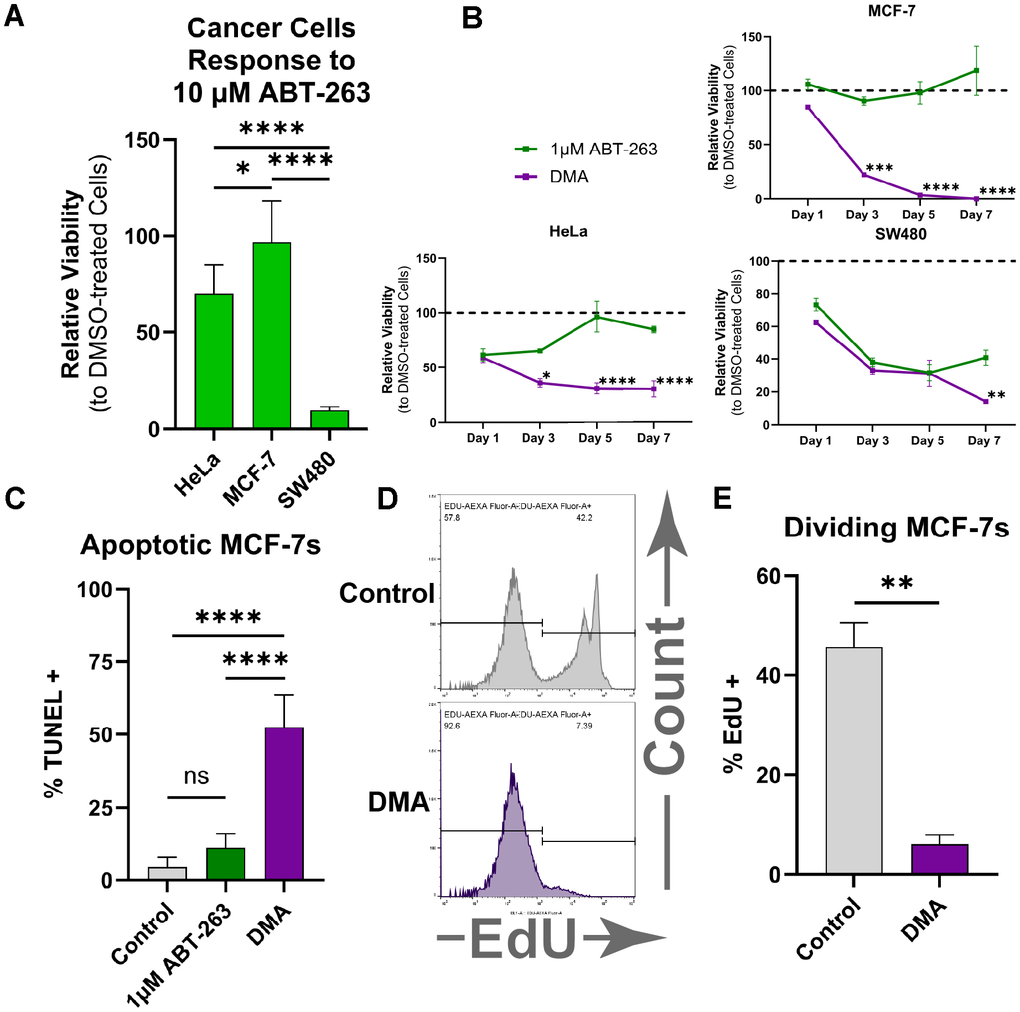
Figure 2.DMA eliminates various types of cancer cells. (A) Relative cell viability of HeLa, MCF-7, and SW480 cancer cell lines measured by the CellTiter-Blue assay, showing variable responses to treatment with 10 μM ABT-263 for two days. (mean ± SD, one-way ANOVA, Bonferroni’s multiple comparisons test). (B) Relative cell viability over 7 days showing that the combination of DCA, metformin, and 1 μM ABT-263 produced a significantly greater reduction in viability than 1 μM ABT-263 alone (mean ± SD, two-way ANOVA, Holm-Šídák test,). (C) Percentage of TUNEL-positive MCF-7 cells, showing significantly greater apoptosis in DMA-treated samples compared with ABT-263 or solvent control (mean ± SD, one-way ANOVA, Bonferroni’s multiple comparisons test). (D) Representative flow cytometry plots of MCF-7 cells treated with DMA or solvent control after EdU staining. (E) Percent EdU-positive MCF-7 cells by flow cytometry, showing significantly less proliferating cells when treated with DMA vs. solvent control (mean ± SD, unpaired t-test). (Statistical significance is denoted as: *p < 0.05, **p < 0.01, ***p < 0.001, ****p < 0.0001).