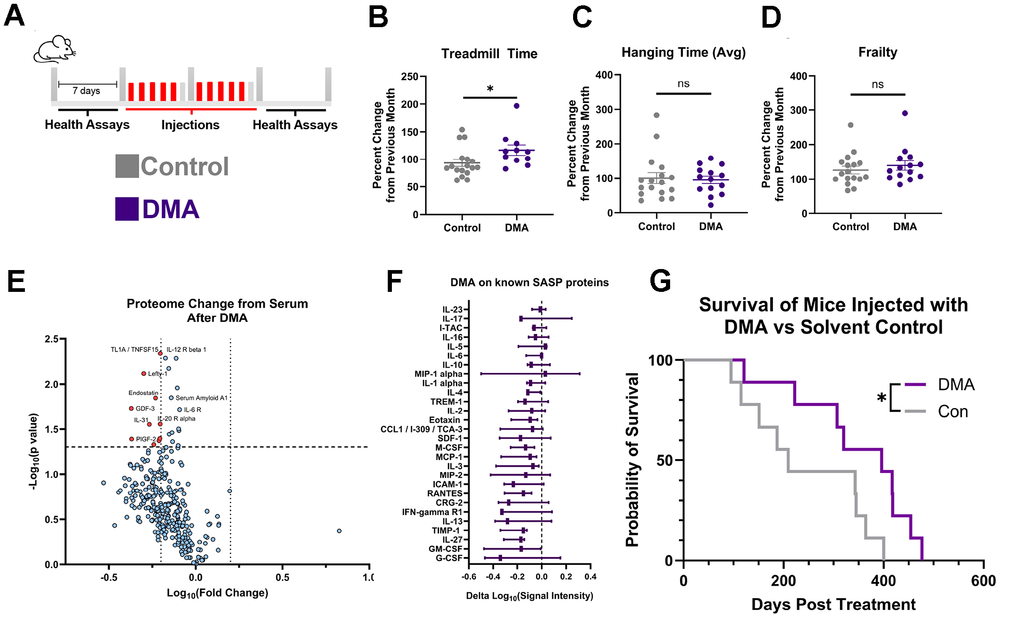
Figure 4.DMA effect in vivo. (A) Diagram of acute injection schedule. (B) Percent change in treadmill run time after injection of DMA or solvent control, compared with the previous month, showing that DMA-treated mice exhibited significantly greater improvement than solvent control-injected mice (mean ± SEM, unpaired t-test, Control: 7 males, 10 females, DMA = 4 males, 7 females (3 mice did not habituate)). (C) Percent change in hanging test time from mice treated with DMA or solvent control, showing no significant difference between groups (mean ± SEM, unpaired t-test, Control: 7 males, 10 females, DMA = 7 males, 7 females). (D) Percent change in frailty from mice treated with DMA or solvent control showing no significant difference between groups (mean ± SEM, unpaired t-test, Control: 7 males, 10 females, DMA 7 males, 7 females). (E) Volcano plot depicting differential serum protein expression in mice after vs. before DMA treatment, expression determined by antibody array, dotted lines at x=-0.2,0.2 and y=1.301(paired t-test, n=3 high throughput studies). (F) Change of known SASPs [6] after DMA injection, expression determined by antibody array (min to max shown, n=3). (G) Survival plot of DMA vs. Control, post treatment (log-rank (Mantel-Cox) test, Control: 3 males, 6 females, DMA = 5 males, 4 females. Median lifespan: Control: n=815, DMA; n=1002). (Statistical significance is denoted as: *p < 0.05, **p < 0.01, ***p < 0.001, ****p < 0.0001).