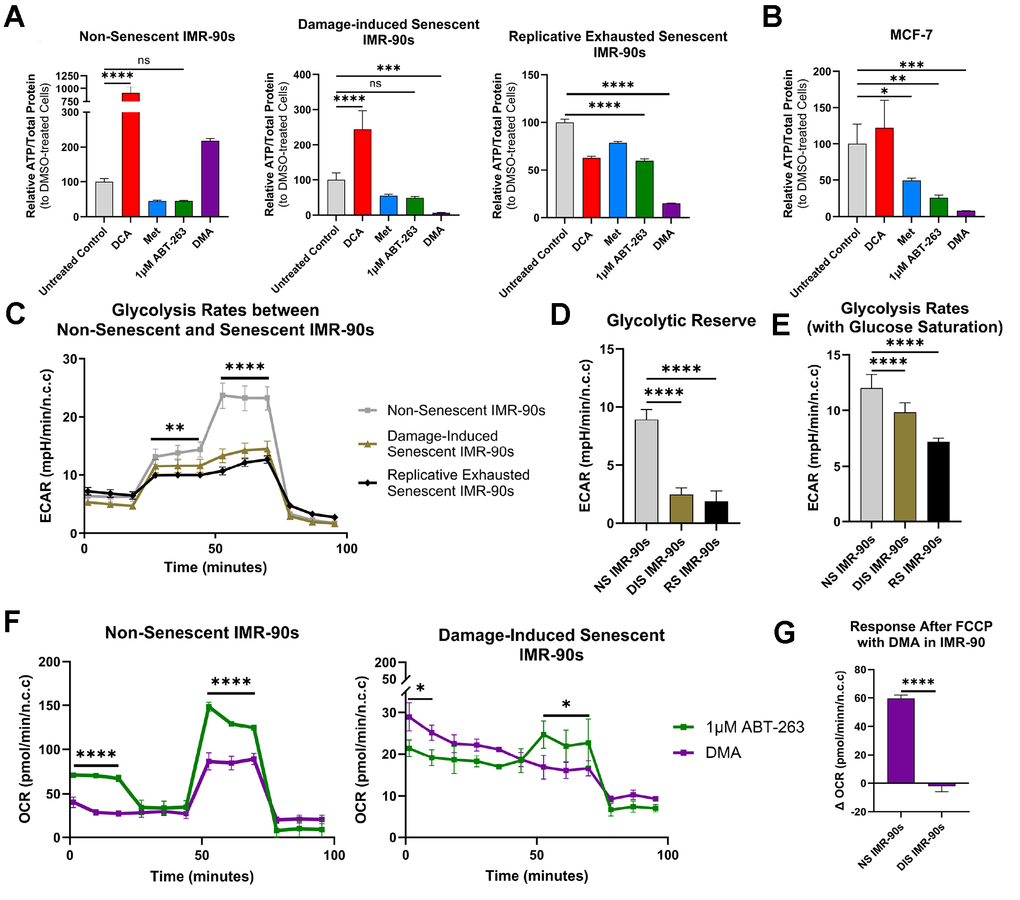
Figure 3.Mechanism of DMA effects on pathogenic versus healthy cells. (A) Bioluminescent ATP assay following the addition of DMA for 12 hours in NS, DIS, and RS cells showing that only DIS and RS exhibited significantly reduced ATP levels as compared to solvent control (mean ± SD, one-way ANOVA, Bonferroni’s multiple comparisons test). (B) Bioluminescent ATP assay following the addition of DMA on MCF-7 cells, showing significantly reduced ATP levels as compared to solvent control (mean ± SD, one-way ANOVA, Bonferroni’s multiple comparisons test). (C) Glycolysis stress test results from NS, DIS, and RS cells, where NS cells were better able to respond to inhibition of oxidative phosphorylation (mean ± SD, two-way ANOVA, Holm-Šídák test). (D) Glycolytic reserve and (E) glycolysis rates from the glycolysis stress tests show that DIS and RS cells cannot increase glycolysis as effectively as NS cells (mean ± SD, one-way ANOVA, Bonferroni’s multiple comparisons test). (F) Results from mitochondrial stress tests on NS and DIS cells treated with 1 μM ABT-263 or DMA, showing that DIS cells were unable to increase respiration in the presence of DMA. (mean ± SD, two-way ANOVA, Holm-Šídák test). (G) Response after FCCP (maximal respiration) in NS and DIS cells shows that NS cells increase respiration more than DIS cells (mean ± SD, unpaired t-test). (Statistical significance is denoted as: *p < 0.05, **p < 0.01, ***p < 0.001, ****p < 0.0001).