Construction and characterization of outcrossed strains
A series of congenic C. elegans longevity-mutant strains was created by repeated out-crossing of strains that had been reported to be long-lived, although they were initially isolated in diverse genetic backgrounds and characterized relative to different N2 control stocks [3,7,18-20]. Survivals were conducted for these strains (e.g., Figure 1); median and mean lifespans from several assays, normalized to their isogenic control (N2DRM), are summarized in Table 1. Adult survival times for these strains varied slightly between experiments, whereas relative lifespans (normalized to wild-type controls, assessed simultaneously) were highly reproducible. Several departures from the literature values were observed, which could be due to strain outcrossing into the N2DRM genetic back-ground, use of a different “wild-type” reference strain than originally employed to evaluate life extension, or inter-laboratory differences in culture conditions. Among the strains utilized herein, unc-31(e928) and eat-18(ad820) conferred less life extension than previously reported, and strain SR803 (carrying the old-1(zIs3000) transgene integrated in an N2DRM background [21]) was indistinguishable from N2DRM controls.
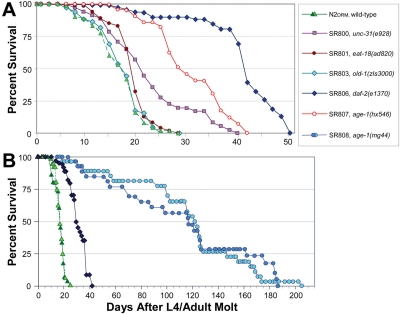
Figure 1. Survivals on agar of wild-type and near-isogenic mutant strains. Worm cohorts were syn-chronized by recovery of eggs after lysis of gravid hermaphro-dites in alkaline hypochlorite (see Materials and Methods), and then by manual selection of L4 larvae. Groups of 25 adults (50 total per group) were transferred to fresh plates daily until no further progeny were produced, and on alternate days thereafter. The x-axis indicates adult age in days, thus excluding effects of slowed development. A illustrates examples of replicate experiments, all of which produced similar sets of survival curves. B shows survival data for N2DRM, daf-2(e1370) and age-1(mg44)-F2 worms, combined with earlier data (dark green triangles and light blue circles, redrawn from [7].
Table 1. C. elegans near-isogenic mutant strains used in lipid studies.
| Strain | Genotype | Median Life span Relative to N2DRM Mean (Range) | Mean Life span Relative to N2DRM Mean (Range) | Affected Protein(s) | Phenotype |
|---|
| N2DRM | wild type | 1.00 (0.94 - 1.06) | 1.00 (0.94 - 1.06) | None | Normal control, isogenic to all mutant strains |
| SR803 | old-1(zIs3000) | 1.03 (1.03-1.03) | 1.04 (1.03-1.05) | FGF/PDGF-related receptor kinase | Integrated transgene reported to confer long-lived phenotype |
| SR801 | eat-18(ad820) | 1.14 (1.14-1.14) | 1.10 (1.07-1.12) | Novel transmembrane protein (modulator of pharyngeal pumping) | Long-lived, probably via DR |
| SR800 | unc-31(e928) | 1.21 (1.14-1.27) | 1.35 (1.34-1.36) | CAPS ortholog (Ca++-dependent activator of neurosecretion) | Long-lived, probably via DR |
| SR806 | daf-2(e1370) | 2.26 (2.26-2.26) | 2.12 (2.07-2.16) | IGF/Insulin-like receptorts hypomorph | Long-lived, via IIS disruption |
| SR818 | daf-16(m26); daf-2(e1370) | 0.95 (0.85-1.05) | 0.94 (0.90-0.98) | IGF/Ins-Rts hypomorph + FOXOhypomorph | Reversion control for SR806 |
| SR807 | age-1(hx546) | 1.63 (1.43-1.81) | 1.63 (1.60-1.66) | PI3Kts hypomorph | Long-lived, via IIS disruption |
| SR819 | daf-16(m26); age-1(hx546) | 1.06 (1.06-1.06) | 1.07 (1.03-1.11) | PI3Kts hypomorph + FOXOhypomorph | Reversion control for SR807 |
| SR808 | age-1(mg44) | 9.6 (9.2-9.9)* | 9.5 (8.5-10.5)* | PI3Knull | Long-lived, via IIS and other signaling pathways |
| SR820 | daf-16(m26); age-1(mg44) | 1.06 (1.06-1.06) | 1.10 (1.07-1.12) | PI3Knull + FOXOhypomorph | Reversion control for SR808 |
| Life spans were determined at least twice, for independent expansions, with 35 - 50 worms per group (20 - 38 uncensored deaths). Further details are provided in Supplemental Table S1. The age-1 gene encodes the catalytic (p110ɑ) subunit of phosphatidyl-inositol 3-kinase (PI3K); the daf-2 gene encodes a cell membrane receptor for insulin-like ligands. The daf-16 gene encodes a FOXO transcription factor, phosphorylated via the DAF-2/AGE-1/PDK-1/AKT kinase cascade. The life-extension phenotypes of age-1 and daf-2 are largely or entirely reversed by double mutations with daf-16 [5,7]. *Survival data for the F2 generation of SR808 [age-1(mg44)] are from reference 7, not repeated here. |
The wild-type progenitor strain N2DRM, near-isogenic with all mutant strains studied, served as their common control. Double mutants with daf-16(mu26) provided additional controls that largely or entirely revert life-span and stress-resistance traits of single-gene insulin/IGF-1 signaling (IIS) mutants [7,22,23], although it cannot be assumed that all affected traits are identically reversed. By this comparative design, we sought features of fatty-acid metabolism that correlate with strain longevity, while controlling for mutation-specific phenotypes not associated with longevity. Because all three double-mutant controls and one of the reportedly long-lived mutants, old-1(zIs3000), had longevities very close to that of N2DRM controls, in log-linear regressions they serve chiefly as additional controls for the consequences of the more effective IIS mutants. Although relatively modest, the lifespan extensions by unc-31 and eat-18 mutations were reproducible and sometimes significant; they thus provide informative assay points that contribute to all measures of correlation, and in particular to rank-order correlations.
Identification and quantitation of fatty-acid chains
In total, 23 fatty acids (FA) were detected, positively identified, and quantified for the worm samples examined, which included most of the fatty acids previously reported for wild-type C. elegans [24,25]. These comprised two cyclopropane fatty acids (9,10-methylene 16:0 and 11,12-methylene 18:0), two monomethyl branched-chain fatty acids (15:0-iso and 17:0-iso), five saturated FAs (14:0, 16:0, 18:0, 20:0 and 22:0), five mono-unsaturated fatty acids (16:1∆9, 18:1∆9, 18:1∆11, 20:1∆11, and 22:1∆13), and eight poly-unsaturated fatty acids, of which five are n-6 (or “omega-6”) fatty acids (18:2∆9,12, 18:3∆6,9,12, 20:3∆8,11,14, 20:4∆5,8,11,14, and 20:2∆11,14), while three are n-3 or “omega-3” chains (18:3∆9,12,15, 20:4∆8,11,14,17, and 20:5∆5,8,11,14,17). Of these, fatty acids 20:0, 22:0, 20:2∆11,14(n-6) and 22:1∆13(n-9) do not appear to have been previously reported in this species [24,25]. The first three are presumed to be +2C elongation products of the fatty acids 18:0, 20:0 and 18:2∆9,12(n-6), respectively, whereas 22:1(n-9) would require two +2C additions to 18:1∆9(n-9). The fatty acid 18:4(n-3), shown in schemas as a possible intermediate to formation of 20:4(n-3), was not observed; it has been observed in elo-1 mutants but not in worms with normal lipogenesis [25,26]. Supplemental Table S3a lists the percent content by strain, of 19 of the above fatty acids, excluding several that were less reliably identified or quantified in one or more strains.
The omega-terminal branched-chain fatty acids 15:0-iso and 17:0-iso were found in all C. elegans mutant and control strains. These odd-carbon-number fatty acids are produced in C. elegans by de novo synthesis [27,28], by ELO-5 and ELO-6 extension of branched primers, with essentially none (<1%) arising from ingested bacteria [25]. In contrast, fatty acids containing a cyclopropane ring are believed to be entirely of bacterial origin and vary in quantity with the bacterial diet [29]; they were not included in the analyses described. However, because total cyclo-propane fatty acids varied rather little among strains (6.3 -10.6% of total lipids), their inclusion or exclusion had very little effect on the percentages calculated for other FAs.
Quantitations of fatty acid classes for most of the congenic strains are summarized in Table 2. Double-mutant controls, in which daf-2 and age-1 mutants are reverted by a daf-16 mutation [7,22,23], agreed well with other “normal-lifespan” controls and thus were omitted from this table and Figure 2, although they contributed to the correlations. Columns at the right indicate the strengths of linear (Pearson) and rank-order (Spearman) correlations with the logarithm of strain longevity. Several of the strongest correlations are shown graphically in Figure 2, in which the mean percent of total fatty acids in each class was plotted as a function of the log(10) of strain lifespan. It is apparent from this figure that most log-linear correlations are dominated by the three longest-lived mutants: age-1(hx546), daf-2(e1370) and age-1(mg44). Because these three mutations affect components of the insulin/IGF-1 signaling (IIS) pathway, no conclusions based on correlation analyses alone will necessarily apply outside that pathway. Nevertheless, they serve to dissect the properties of IIS attenuation that bear most directly on longevity, from those that are peculiar to specific gene mutations or to other sequence changes tightly linked to an identified mutation.
Table 2. Fatty acid composition of isogenic C. elegans strains of varying lifespan
(N.B.: double-mutant control strains had values close to N2, and are not shown here although included for calculation of correlation coefficients.)
|

| FA amounts are indicated as percents of total FAs. Longevity was assessed at least twice per strain, with the results as indicated in Table 1, column 3. For rank-order correlations, strains with median lifespans near the value of wild-type N2DRM (relative median lifespans near 1), were assigned the same longevity rank, since they could not be ordered unambiguously with respect to one another. These strains were the control strain N2DRM, the double-mutant control strains SR818 [daf-16(m26); daf-2(e1370)], SR819 [daf-16(m26); age-1(hx546)] and SR820 [daf-16(m26); age-1(mg44)], and SR803 [old-1(zls3000)]. In these analyses, N is the total number of biological replicates. For each correlation coefficient R, calculated from N data points, its P value was ascertained from its t-transformation, t = |R| · [(N – 2) / (1 – R2)]½, treating the result as coming from a t distribution with N–2 degrees of freedom. |
| Average Chain Length, ACL=[(Σ[%14C]×14) + (Σ[%15C]×15) + (Σ[%16C]×16) + (Σ[%17C]×17) + (Σ[%18C]×18) + (Σ[%20C]×20) + (Σ[%22C]×22)]/100, where sums Σ are for all fatty acid chains of the indicated length (14C, 15C, 16C etc.). |
| (Σ[%22C]×22)]/100, where sums Σ are for all fatty acid chains of the indicated length (14C, 15C, 16C etc.). |
| Double Bond Index, DBI = (Σ[%nC:1] × 1) + (Σ[%nC:2] × 2) + (Σ[%nC:3] × 3) + (Σ[%nC:4] × 4) + (Σ[%nC:5] × 5), where Σ is for n=12–22. |
| Peroxidation Index, PI = (Σ[% nC:1] × 0.025) + (Σ[% nC:2] × 1) + (Σ[% nC:3] × 2) + (Σ[% nC:4] × 4) + (Σ[% nC:5] × 6), taking Σ for n=12–22. |
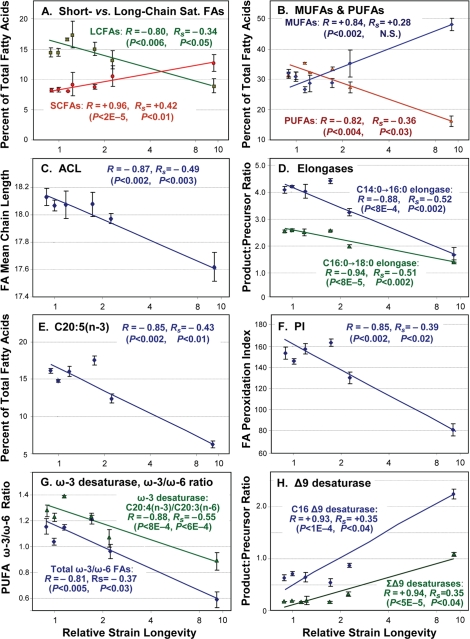
Figure 2. Trends of fatty-acid composition with increasing life span. In each panel, data points with error bars indicate means ± standard errors, of GC-MS quantitations for the indicated lipid component expressed as a percent of total fatty acids quantified for that run. X-axes display median lifespans from Table 1: [strains; number of independent cohorts/runs]: 1.0 [N2DRM, SR803, SR818, SR819, SR820; n = 20], 1.1 - 1.2 [SR800, SR801; n = 4], 1.6 [SR807; n = 5], 2.3 [SR806; n = 3] and 9.6 [SR808; n = 4]. Medians (Table 1) are more robust than means to effects of outliers. Y-axes show (panels A, B and E) the percent of total fatty acids in each indicated class; (C) Average Chain Length; (D) activities of fatty-acid elongases, inferred from FA ratios (C16:0/C14:0, C18:0/C16:0); (F) Peroxidation Index (defined in Table 2 legend); (G) activities of ω-3 desaturases, inferred from FA ratios (e.g., C20:4(n-3)/C20:3(n-6)), and ω-3/ω-6 ratios for all PUFAs; and (H) inferred Δ9 desaturase activities (C16:1Δ9/C16:0, C18:1Δ9/C18:0). In each panel, R denotes the Pearson correlation coefficient, reflecting a linear relationship between the log(10) of strain lifespan and the indicated fatty-acid parameter. RS is the Spearman correlation coefficient, relating the rank-order of strain lifespan to rank-order of fatty-acid parameter per class (e.g., the % of total FAs) in 36 assays. Table 2 lists the corresponding significance thresholds. R values shown here were calculated by treating each of 10 strains as one sample point. This reduces significance (due to lower N), but increases R, relative to points derived from the 36 GC-MS measurements on independent cohorts, due to the lower variance of means.
The first correlation column, headed “N=10”, treats each of the ten strains as a single data point, defined by the means of its lifespan and GC-MS measurements. The other two correlation columns (“N=36”), consider each GC-MS measure on an independent cohort of nematodes as one data point, since these lipid quantitations had far higher variance than did relative lifespan. Rank-order correlations, shown in the right-most column, are independent of all assumptions regarding data distribution or transformation, and are also conservative in that they are influenced equally by strains of moderate or extreme longevity. To the extent that a proximal factor impacting lifespan is expected to vary in abundance in proportion to longevity, however, Pearson log-linear correlations have the merit of preserving that information. Of 21 fatty-acid parameters quantified in Table 2, 19 had Pearson log-linear correlations that were nominally significant at P<0.05, and 13 were highly significant at P<0.0024 (i.e. <0.05/21). This was true whether 10 or 36 data points are considered. In the description that follows, R and P values are given only for 10-point regressions, to maintain consistency with Figure 2. We note, however, that the 36-point analyses better reflect the extent of uncertainty due to biological variation within each group; they usually result in lower correlation coefficients, but improved significance.
Seventeen of these longevity-dependent trends met a more stringent criterion of having nominally significant Spearman rank-order correlation coefficients, P<0.05, of which seven were highly significant at P<0.0024. The data of Table 2 were compiled from a more complete listing that comprises quantitative data for 19 FA species (Supplemental Table S3a) and 18 derived measures of biological interest (Table S3b).
A positive correlation was observed between longevity and the abundance of short-chain saturated fatty acids C14:0, C16:0 and C15-iso, a trend that was reversed for the longer-chain classes 18:0, 20:0 and 22:0 (Figure 2A and Table 2). The same pattern was repeated among the monounsaturated fatty acids (MUFAs, Figure 2B), with positive correlations to lifespan for C16:1∆9 and C18:1∆11, but weaker negative correlations for C20:1 and C22:1 (Tables 2 and S3a). As expected from these trends in individual lipid species, the average chain length of all fatty acids declined in association with lifespan (Figure 2C), with log-linear correlation coefficient R = −0.87 (P< 0.002), and rank-order RS = −0.49 (P<0.003).
Of five major polyunsaturated fatty acid (PUFA) species observed, four fell significantly in amount as longevity increased: 18:3(n-6), 20:4(n-6), 20:4(n-3) and 20:5(n-3), whereas 20:3(n-6) did not (Figure 2, B and E; Tables 2 and S3). Unlike mammals, which require dietary PUFAs to maintain health, nematodes possess all of the enzymes necessary for their biosynthesis, and thus their lipid composition depends on genetics and gene-expression as well as diet (see below). Although it remains controversial whether lifespan is indeed limited by reactive oxygen species [31,32], there is broad agreement that lipoperoxidation products can amplify via chain reactions [32,33], and thus pose a serious biological hazard for all cells. In PUFAs, the carbons situated between double bonds are especially vulnerable to peroxidation, whereas saturated and monounsaturated chains are several hundredfold less susceptible [34]. The Double Bond Index (DBI) is a simple weighted average of the number of double bonds per fatty acid molecule: Σ (1·Σ(1-DB %) + 2·Σ(2-DB %) + …. + 5·Σ(5-DB %) [35]. The Peroxidation Index (PI) is calculated in similar fashion, except that the contributions of MUFAs and PUFAs are weighted to reflect their susceptibilities to lipoperoxidation [34].
DBI and PI displayed quite similar monotonic declines with longevity, giving correlation coefficients of −0.84 and −0.85 (each P<0.0024) and rank-order correlation coefficients of −0.40 and −0.39 (P<0.02; Table 2 and Figure 2F).
C. elegans, unlike mammals, possesses omega-3 (i.e., n-3) desaturase enzymes. They are thus able to convert arachidonic acid, 20:4∆5,8,11,14(n-6), to eicosapen-taenoic acid (EPA), 20:5∆5,8,11,14,17(n-3), and the level of ω-3 desaturase activity can be inferred from the ratio of those chains [30]. Estimated ω-3 desaturase activity declined with lifespan (Figure 2G and Table 2), with log-linear correlation coefficients R of −0.71 (P<0.02) and −0.88 (P<10−3). Among all PUFAs, the ratio of ω-6 to ω-3 fatty acids also declined (Figure 2G) with a log-linear correlation coefficient of −0.81 (P< 0.005). Although many aspects of human health are affected by dietary intake of ω-3 fatty acids, and tend to benefit from reduction of our high ω-6/ω-3 intake ratio, this reflects constraints on mammalian biosynthesis of lipids and of lipid-derived eicosanoid signaling molecules, rather than lipoperoxidation potential (which is somewhat lower for ω-6 than ω-3 fatty acids [34]). Because the same constraints do not apply to nematode biosynthesis of lipids [25], the impact of the ω-6/ω-3 ratio on C. elegans health is not known.
The levels of other desaturase activities can be inferred in like manner from their product/substrate ratios [30]. Based on these ratios (Tables 2 and S3b), the imputed levels of Δ6 desaturase showed a moderate inverse correlation to longevity (R= −0.75, P<0.02), whereas two ratios indicative of Δ9 desaturase activities (16:1Δ9/16:0 and 18:1Δ9/18:0) displayed strongly positive correlations with lifespan (Figure 2H), with a combined log-linear R value of +0.94 (P<5×10⁻⁵). These results are fully consistent with a study of the effects of mutations to Δ9 desaturases, encoded by fat-5, -6 and -7 genes in C. elegans [24]. The Δ9 desaturases are responsible for the initial introduction of a double-bond in a saturated fatty acid chain, and are thought to serve as “pacemaker” enzymes for lipid desaturation pathways [24,25]. It is thus paradoxical that the longest-lived mutant strains had the highest apparent Δ9 desaturase activity (Figure 2H) and the highest amounts of both 16:1Δ9 and 18:1Δ9 (Table S3), and yet the lowest PUFA levels (Figure 2B). This implies that additional regulation must occur downstream of the Δ9 desaturases, to favor or impede further desaturation. The declines with increasing lifespan, seen here for Δ6 and ω-3 desaturases (Table 2), support that interpretation.
Because the longest-lived strain, SR808, differs from the other strains with respect to fertility (age-1(mg44)-F2 homozygotes being completely infertile [7]), we were concerned that the longevity trends observed in FA content may have been confounded by variation in quantities of egg lipid stores. We therefore ran two post-hoc comparisons by ANOVA. In the first, three control strains were analyzed for FA content, comparing them at day 3 (egg-laying adults) vs. day 6 of adulthood, by which time they were post-gravid, pre-senescent adults, devoid of internal eggs or embryos by microscopic examination. None of the 20 FA measures showed a significant effect of eggs that could have contributed to the observed trends with longevity. The effect of infertility would often have opposed the shift seen in the long-lived SR808 [age-1(mg44)] strain, but in those instances where it could have contributed to that strain's exceptional FA content, the estimated effect size ranged from 3-26% of SR808's shift (data not shown). The second comparison simply re-evaluated the association between lifespan and FA content, considering only postgravid samples from four strains plus nongravid age-1(mg44)-F2 samples (SR808). The resulting correlations, summarized in the two right-hand columns of Table 3, closely mirrored the overall trends with lifespan observed previously (columns 2 and 3, taken from Table S3). Although the nongravid analyses carried less statistical significance, as expected in view of their much smaller sample size, the correlation coefficients for these 12 parameters were either similar to, or greater than, the corresponding coefficients from the full data set. The observed longevity trends thus cannot be attributed to strain differences in their egg or embryo content.
Table 3. Fatty acid trends with lifespan are not attributable to gravidity differences
|
| Data in columns 2 and 3 are taken from Supplemental Table S3. |
Transcriptional regulation of lipid biosynthesis
Transcript steady-state levels were assessed for a panel of genes known to be involved in nematode biosynthesis of lipids. Independent biological samples (N = 3 - 8) were prepared from the four longest-lived groups: F1 and F2 homozygotes for the age-1(mg44) mutation (median lifespans 2.5- and 10-fold longer than wild-type, respectively); age-1(hx546) (1.8-fold); and daf-2(e1370) (2.2-fold). First-generation homozygotes for mg44 receive oocyte contributions from their heterozygous parent (termed “maternal rescue”), blunting the more extreme traits associated with their F2 progeny. Additional groups tested include N2DRM adults (wild-type, lifespan defined as 1.0), N2DRM dauer larvae (developmentally arrested at an alternative larval stage 3), and double mutants of each age-1 allele with daf-16 (not shown), which largely or entirely revert longevity and other traits of those mutations [7,36]. Shifts in transcript levels, such as those shown in Figure 3, were highly reproducible; similar results were obtained in three replicate experiments, for all changes that were either significant or suggestive (P<0.1) in individual experiments.
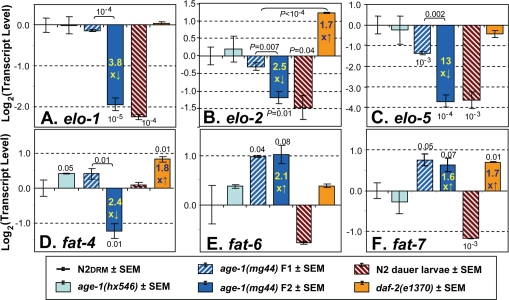
Figure 3. Steady-state transcript levels for genes of lipid metabolism. Real-Time Polymerase Chain Reaction (RT-PCR) was performed for the six indicated groups of C. elegans (see legend panel). In the experiment shown, the number of independent biological preparations was as follows (groups as displayed from left to right): N2DRM adults, N=8; SR807 [age-1(hx546)], N=3; SR808 [age-1(mg44)], first (F1) homozygous generation,N=3; SR808 [age-1(mg44)], F2 generation,N=4; N2DRM dauer larvae, N=2; and SR806 [daf-2(e1370)], N=3. The ordinate (y axis) displays the base-2 logarithm of transcript level, after normalization to N2DRM controls (which thus always have a mean log2 value of zero). The y value is equivalent to - [tc(mutant) - tc(N2)], where tc is the cycle number required to achieve an arbitrary threshold level of PCR amplification product. P values of <0.1 (based on single-tailed, heteroscedastic t tests) are indicated above or below a histogram bar to indicate a comparison of that strain to N2 controls, or above a bracket to indicate a comparison between the two strains linked by the bracket. This experiment was performed three times with similar results.
A, elo-1 (encoding an FA elongase); B, elo-2 (elongase); C, elo-5 (branched‐chain FA elongase); D, fat-4 (Δ5 desaturase); E, fat‐6 (Δ9 desaturase); F, fat‐7 (Δ9 desaturase).
The longest-lived group, age-1(mg44) F2 adults, showed downregulation for the elongase genes elo-1, elo-2, and elo-5, by ~4-fold [P<10−5], 2.5-fold [P<10−2], and 13-fold [P<10−4], respectively, each relative to N2DRM controls (Figure 3, A-C). However, far smaller decreases were seen in first generation (F1) age-1(mg44) homozygotes. A fourth elongase gene, elo-6, did not alter significantly in any strain (not shown). Transcript levels of elo-1,-2 and -5 were also low in N2 dauer larvae. Neither daf-2(e1370) nor age-1(hx546) adults showed significant decreases for any of the elo genes, and daf-2 mutants instead exhibited a modest (1.7-fold) increase in elo-2 expression. Thus, transcriptional attenuation of elongase expression appears to be a mechanism of reducing lipid chain length (ACL, Figure 2C) peculiar to age-1(mg44) mutants and dauer larvae.
Transcript levels were also assessed for seven nematode fatty-acid desaturase genes. Expression of the fat-1, fat-2 and fat-3 genes (respectively encoding ω-3, ∆12 and ∆6 desaturases), did not alter significantly in any of the strains examined (data not shown). Transcripts of fat-4, encoding a Δ5 desaturase that converts C20:3Δ8,11,14 (n-6) to arachidonic acid, C20:4Δ5,8,11,14(n-6), declined only in F2 age-1(mg44) worms, by 2- to 7-fold in three experiments (e.g., Figure 3 D), consistent with the decline in PUFAs observed in longer-lived strains (e.g. Figure 2B). In contrast, two genes encoding Δ9 desaturases, fat-6 and fat-7, both increased similarly in first- and second-generation age-1(mg44) homozygotes: two-fold for fat-6 and 1.6- to 1.8-fold for fat-7 (Figure 3 E,F). Lesser shifts in the same direction were also seen for fat-6 in age-1(hx546)and daf-2(e1370) mutants, and for fat-7 only in daf-2(e1370) adults. In marked contrast to our observations for elongase genes, the desaturase gene shifts observed in age-1(mg44) F2 adults either did not occur in dauer larvae (D, fat-4), or levels shifted in the opposite direction (E, fat-6, and F, fat-7). These expression changes seen in longer-lived strains are presumed to underlie their striking increases in Δ9 MUFAs (Table 2; Figure 2, B and H).
Functional consequences of altering lipid-biosynthesis gene expression
Because all three elongase genes were expressed at reduced levels in the longest-lived (IIS-mutant) worms, while desaturase gene transcript levels varied less systematically, we tested the functional importance of such shifts in expression, for nematode survival of oxidative stress, a rather robust surrogate for longevity effects of IIS disruption [7,37,38]. Wild-type (N2DRM) worms were fed for 3 days, starting at the L4/adult molt, on bacteria expressing gene-specific siRNA constructs [39], and were then assessed for their duration of survival in medium containing a toxic level of hydrogen peroxide. Typical results from two independent experiments are shown in Figure 4 A & B.
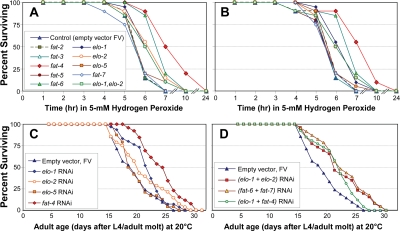
Figure 4. Survival of peroxide stress, and unstressed longevity, of C. elegans adults after elongase- or desaturase-specific knock-down by RNAi. A, B: Worms (25 per group) were fed on E. coli expressing either the indicated siRNA construct (Ahringer RNAi library [39]) or empty-vector control, for 3 days beginning at the L4/adult molt. They were then placed in bacteria-free medium containing 5-mM hydrogen peroxide, freshly diluted from stock solution, and survival was monitored as described previously [7,37,38]. A and B show replicate experiments, assessing effects of RNAi's targeting desaturase (fat-2, -3, -4, -5, -6 or -7) or elongase genes (elo-1, -2 or -5). C, D: Worms (35 worms per group, on 2 plates) were fed the same RNAi constructs as above, continuously from the L4/adult molt, and their survival monitored as described [7,37,38]. C, strains treated with single RNAi constructs as indicated; D, strains treated with pairs of RNAi constructs, following a protocol for combining RNAi treatments [71]. C and D together comprise a single experiment, with which replicates (not shown) agreed.
Knock-down of elo-1 or elo-2 consistently and significantly extended survival of this oxidative stress (each P<0.01), whereas RNAi againstelo-5 (encoding an elongase specific for monomethyl branched-chain fatty acids) was no more effective than empty vector (Figure 4). Knock-down of fat-4, encoding a Δ5 desaturase, increased peroxide survival time by at least 60% in multiple experiments (each P<10−6), while depletion of fat-6 transcripts extended survival by 24% (each P<10−5). With the exception of the latter result, the effects of RNAi were entirely consistent with expectations based on RNA transcript abundance shifts in the longest-lived strain, age-1(mg44).
Effects of RNAi knockdown on longevity (Figure 4, C & D), largely paralleling conferral of peroxide resistance, agreed even more closely with predictions based on transcript changes in age-1(mg44) (see Table 4). Knockdown of either elo-1 or elo-2 elicited moderate and significant extensions of C. elegans lifespan (each P<0.04). RNAi to elo-5 is not expected to affect longevity, since ELO-5 extends only monomethyl branched-chain fatty acids involved in developmental signaling [27,28]. Combined knock-down of both elongases (Figure 4D) was more effective than depletion of either elongase gene alone, but less than their sum; this could reflect the known redundancy between their functions [40], or simply the dilution of each bacterial strain. The greatest life extension (25%, P<10−4) followed depletion of fat-4 transcripts, which also produced the greatest peroxide resistance (60%). In contrast, knockdown of fat-6 or fat-7, both upregulated in long-lived mutants, effected small and insignificant reductions in longevity (Table 4). Life-span changes presented here agree remarkably well with previous data on survival of worms exposed to RNAi's targeting elo-2, fat-3, fat-4, fat-6 and fat-7 [10,12].
Table 4. Fatty-acid biosynthetic activities that covary with longevity based on lipid-profiles:
Trends with lifespan in inferred activities, transcripts encoding implicated enzymes, and effects of RNAi knock-down
| Enzyme Activity (genes responsible) | Correlation to Lifepan Based on Lipid Profiles | Transcript Change in Long-Lived Mutants | Effect of RNAi KD on Peroxide Resistance of N2DRM Adults (P by exp.) | Effect of RNAi KD on Longevity of N2 Adults (P from log-rank tests) |
|---|
| Elongases (elo-1, -2, -5) | ACL, R= −0.87 (P<0.002)
Elongation ratios: R= −0.86 à −0.94 (each P<0.002) | elo-1, ↓ 3.8x
elo-2, ↓ 2.6x
elo-5, ↓ 13x
(MMBC ELO) | elo-1: ↑14% (0.01, 0.01)
elo-2: ↑14% (0.01, 0.01)
elo-5: NC (NS)
elo-1,elo-2: ↑12% (0.04, 0.03) | elo-1: ↑11% (0.02)
elo-2: ↑8% (0.04)
elo-5: NC (NS)
elo-1 + elo-2: ↑15% (0.004) |
| Δ6 desaturase (fat-3) | R= −0.75 (P<0.02) | NC | fat-3, NC (NS) | fat-3: ↑≥10% [10,12] (not retested here due to unaltered H2O2-survival) |
| Δ5 desaturase (fat-4) | R=−0.71 (P<0.03) | ↓ 2 - 7x in age-1(mg44)
↑ 1.4-2x in age-1(hx546)
↑ 1.5-3x in daf-2(e1370) | fat-4, ↑60% (1E-6, 1E-6) | fat-4, ↑ 25% (4E-5)
elo-1 + fat-4: ↑12% (differs from FV or fat-4, P≈0.01) |
| Δ9 desaturases (fat-5, -6, -7) | R= +0.94 (P<5E-5) for 3 Δ9 desaturases combined | fat-5, NC
fat-6 ↑ 2.0-2.2x
fat-7 ↑ 1.5-1.8x | fat-5: NC (NS)
fat-6: ↑24% (1E-5, 1E-5)
fat-7: NC (NS) | fat-5: NC (NS)
fat-6: ↓9% (NS)
fat-7: ↓8% (NS) |
| NC: no change; NS, not significant. Life extension by fat-4 RNAi was also reported previously as ~25% [10]. Significance of survival differences was assessed by Cox-Mantel log-rank test, relative to Feeding Vector (FV) control plasmid unless otherwise indicated. |
Hypomorphic mutations to genes implicated in the present studies have been demonstrated previously to alter lipid profiles in the directions we found to be associated with lower transcript levels [24-26,41]. For example, mutation to elo-1 (which shows substantial functional redundancy with elo-2 [40]) has markedly reduced long-chain FAs and hence PUFAs [26]. A mutation in fat-4 (encoding the Δ5 desaturase) effectively eliminates specific PUFAs such as 20:5(n-3) and 20:4(n-6) [26]; whereas individual mutations in fat-5, -6 or-7 (encoding Δ9 desaturases) lead to significant reductions in either 16:1 or 18:1 Δ9 fatty acids [41]. A schematic of lipid biosynthetic pathways (Figure 5), illustrating alterations to FA abundance and transcript levels in longevity mutants, is thus congruent with the corresponding diagrams based on data from lipogenesis mutants [24-26,41].
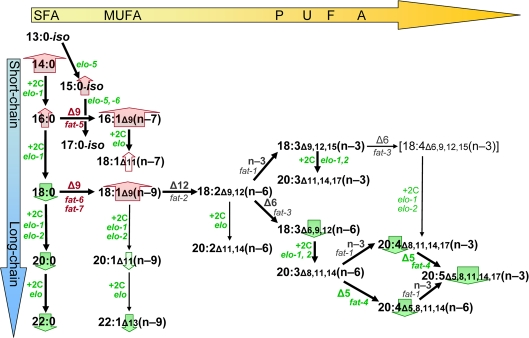
Figure 5. Lipid biosynthesis changes associated with C. elegans longevity. Black arrows in this schematic diagram indicate successive steps in fatty-acid biosynthesis by C. elegans, based on previously published data [24,25]. Enzyme activities (“+2C” for elongases, “Δn”, “n-3” or “n-6” for desaturases) and the implicated genes are indicated beside each arrow, in green font to indicate that transcripts encoding that enzyme are downregulated with increasing life span, or in red to show upregulation. Block arrows behind the names of fatty-acid classes are similarly color-coded, with the width of the arrow corresponding to the strength of the correlation to longevity. Lipids increase in melting temperature with increasing chain length and/or saturation level; thus shifts toward shorter chains with less desaturation, as seen in long-lived strains, may be neutral with respect to membrane fluidity.
Another way to perturb the fatty-acid composition of worms is through diet. We fed worms on the standard monoxenic bacterial diet, either unmodified or supplemented with specific fatty acids. As illustrated in Figure 6, the longevity of wild-type Bristol-N2 [DRM] adult worms was significantly reduced (P<0.01) by addition of 40 μM eicosapentaenoic acid [EPA, C20:5(ω-3)], the longest-chain PUFA we observed in this nematode, relative to worms given an isocaloric supplement of palmitic acid (C16:0), an unsaturated, shorter-chain fatty acid. Lifespan was also reduced relative to worms not given any supplement. These results are entirely consistent with the trends observed among strains, and the life extensions produced by interference with expression of genes involved in PUFA synthesis.
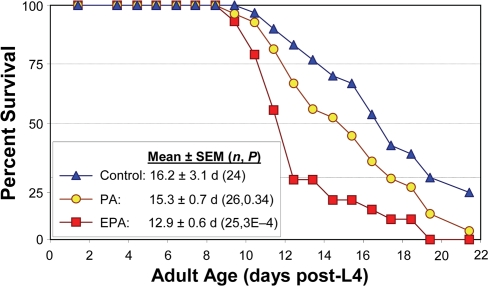
Figure 6. Reduction in C. elegans lifespan with addition of PUFAs to their diet. Adult worms were maintained on agar plates spotted with E. coli (strain OP50). Control plates were unsupplemented, while treatment plates contained either palmitic acid (PA, 16:0) or eicosapentaenoic acid (EPA, 20:5 (ω-3)). Worms were transferred daily to fresh plates of the same type. Survival in the presence of 40 μM EPA was reduced 20% relative to unaugmented controls (P<0.0005 by Gehans Wilcoxon log-rank test), and by 16% relative to worms supplemented with PA approximately isocaloric to the added EPA (P<0.007). Each group initially comprised 35 worms, with 24-26 “natural deaths” after censoring worms killed by other factors (see [7,34]).