


Introduction
One of the most long-standing mysteries of gerontology is that the females of most species live longer than the males [1-12]. Not only most mammals but also women of different nations and at most historical periods live longer [2]. Ironically, it may seem that males do not age faster but simply are weaker at any age. In fact, the mortality rate is higher in young males and teenagers too. Importantly, however, old males die from age-related diseases, whereas young males mostly die from risky behavior and physical competition with each other. While risky competition increases chances of mating and offspring, this simultaneously results in high accidental mortality (from fights) and males die young. There is no reason for them to be naturally selected for slower aging. Therefore, animals with a high accidental death rate tend to age faster. It is exceptionally important for such males early in life to be bigger and stronger (even at the cost of accelerated aging).
Growth is driven by the mammalian Target of Rapamycin (mTOR) pathway [13-23]. (Note: mTOR is also very recently renamed as MechanisticTarget of Rapamycin (MTOR), so we will continue to use mTOR in this paper). TOR is conserved from yeast to mammals, including humans [24-26]. The mTOR pathway stimulates protein synthesis and many cellular functions, including secretion of mitogens, insulin and cytokines, which remind the senescent phenotype [27-30]. In postmitotic non-dividing cells, instead of size growth mTOR drives aging [31-37]. mTOR can convert reversible quiescence into irreversible senescence (geroconversion) [27, 38-43]. TOR pathway is involved in aging from yeast to worms to mammals [44-59] as well as in age-related diseases in mammals [15, 60-71].
Rapamycin suppresses cellular senescence [27, 31-36, 38-41, 72-80] and prolongs life span and health span in diverse species [45, 46, 50, 67, 71, 81-91]. By inhibiting TOR [36, 77, 92-94] p53 can suppress geroconversion [76, 95-98] and affect lifespan [99], [100] and diseases of aging [101]. Also some drugs, other than rapalogs, can alter lifespan by targeting the mTOR pathway [102-109]. Therefore, TOR emerges as a reasonable candidate gene that may determine both growth and aging.
In brief, early in life, TOR drives growth, robustness and reproduction, while causing aging and age-related diseases later in life [110-113]. This example of antagonistic pleiotropy is in line with the evolutionary theory [110]. We speculate that aging as a continuation of growth driven by the same mTOR pathway, leading to aging and diseases of aging culminating in organismal damage and death. The mTOR pathway is extremely complex [114-124]. It is stimulated by nutrients (food), insulin, insulin-like growth factor 1 (IGF-1), testosterone, oxygen, and pro-inflammatory cytokines [39, 55, 62, 114-130]. The TOR kinase forms 2 complexes: mTORC1 and mTORC2 [121]. mTORC1 is rapamycin-sensitive. This complex is characterized by the classic features of mTOR as a nutrient/energy/redox sensor, which controls protein synthesis and growth. Most importantly it promotes geroconversion (conversion from resting state to senescent phenotype) that is partially suppressed by rapamycin. Its most studied target is S6 kinase, which phosphorylates S6 and rapamycin prevents this phosphorylation. Therefore we used pS6, as a marker of mTORC1 activity, the most relevant to growth and aging. mTORC2 is rapamycin-insensitive. mTORC2 is a regulator of the cytoskeleton through its stimulation of F-actin stress fibers, paxillin, and protein kinase Cα (PKCα). mTORC2 phosphorylates the serine/threonine protein kinase Akt/PKB at a serine residue 473 (S473). Phosphorylation of the serine stimulates Akt phosphorylation at a threonine 308 residue by PDK1 and leads to full Akt activation [20, 116, 117, 121, 131-136].
In this study we used pS6 as a marker of mTORC1 activity - the major pro-aging pathway, and p-Akt S473 as a presumable marker of TORC2 activity, although it is also an activator of TOR, acting upstream of mTOR complexes.
In sum, mTOR may drive both growth and aging, associated with hyper-functions coupled with signal-resistance and malfunction, loss of homeostasis, leading to development of deadly diseases of aging such as cardiovascular and metabolic diseases, neuro-degeneration, cancer and organ atrophy or failure [65]. We hypothesize that males have a higher levels of mTOR activity, providing advantage (and bigger size) for young males even though accelerated aging and early death might follow.
Results
Insulin and weight are higher in young male mice
First, we compared 6 months old male and female mice. The most noticeable difference between males and females was body weight (Fig. 1A). At the age of 6 months, males were 28 % heavier than females. Females and males did not differ in levels of fasted triglycerides (Fig. 1B) and glucose (Fig. 1 C), as expected. Fasted insulin levels were slightly, but statistically significantly, increased in males (Fig. 1D). We also measured insulin response to re-feeding. Induction of insulin upon re-feeding was significantly higher in males (Fig. 1E). Moreover, levels of insulin after fasting correlated with higher levels of insulin after re-feeding (re-fed) and levels of both fasted and “re-fed” insulin were preferentially higher in males (Fig. 1F).
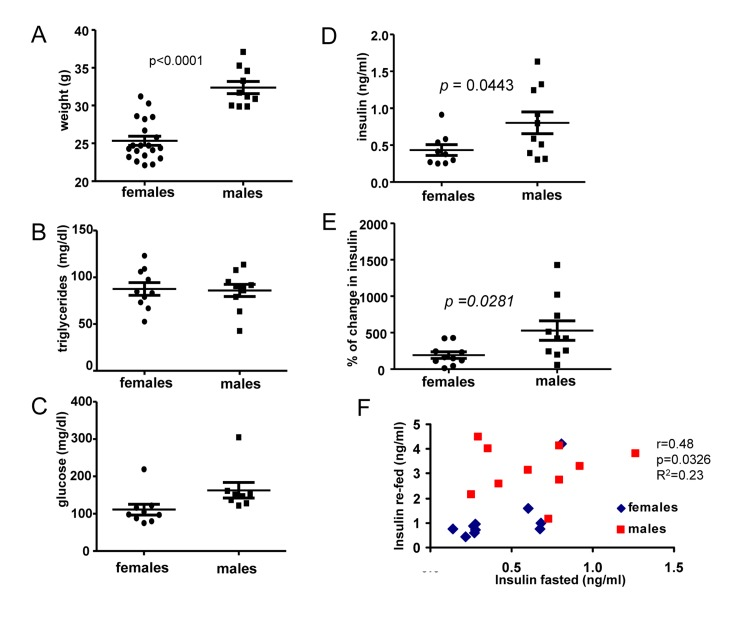
Figure 1. Metabolic profile of 6 months old males and females (A) Weight (grams) of 6 months old female and male mice. Data present mean ± SE. (B) Fasting serum triglyceride levels of females and males. Data are mean ± SE. (C) Fasting serum glucose levels in fasted blood of females and males. Data are mean ± SE. (D) Insulin serum levels in females and males. Data are mean ± SE. (E) Percent of increase in insulin levels in response to re-feeding after fasting by females and males. Data present mean ± SE. (F) Correlation between fasting insulin levels and levels of insulin 2 h after re-feeding. r – Pearson coefficient.
The mTOR pathway is over-activated in 6 months old males
In first series of experiments, blood was collected twice (after fasting and 2 hour after re-fed) and animals were sacrificed to measure pS6 and pAkt levels (Fig. 2 A). Levels of pS6 were variable, whereas levels of p-AKT were less variable between individual mice (individual mice were identified by numbers shown above each blot). (Note: Levels of total S6 (non-phosphorylated) were difficult to determine because S6 location on the blots is coincided with mouse immunoglobulin Gs, contaminating organs and recognizable by the secondary anti-mouse antibody.) However, as it is often observed in culture, pS6 coincided with disappearance of S6 (Fig. 2A).
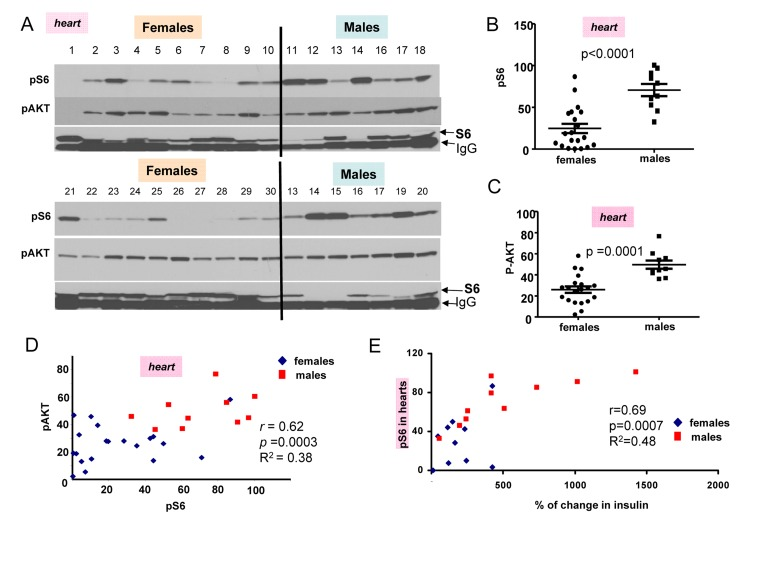
Figure 2. Comparison of pS6 and p-Akt levels in the hearts of 6 month old females and males (A) Immunoblot analysis of protein lysates from the hearts of 6 months old females and males, which were fed ad libitum, fasted overnight for blood collection and then re-fed for 2 hours. Numbers above blots represent individual mice. All mice, except numbers 21-30 underwent this schedule and were well fed before organ collection. In addition some females (21-30) received food ad libitum all the time (without transient fasting). Two conditions were considered as fed ad libitum (at least for 2 hours before sacrifice and organ collection). There was no difference in pS6 and Akt between two subgroups of mice (numbers 1-10 versus 21-30). Also there was no difference between levels of insulin and triglycerides in two sub-groups of females (Fig. 1S), confirming that they were of similar feeding status at the time of organ collection. Because of that we combined two female subgroups for further statistical analysis to increase statistical power to compare with males that were all similar re-fed for 2 hours as females. Now, all comparison of pS6 and p-AKT could be done between males and females as fed ad libitum for the last 2 hours.
Quantitative analysis of data shown in Figure 2A. (B) Quantified intensities of phosphorylated S6 (pS6) signal in the hearts of female (n=20) and male (n=10) mice. Data are presented as mean ± SE. (C) Quantified intensities of p-AKT signal in the hearts of female (n=20) and male (n=10) mice. Data are presented as mean ± SE. (D) Correlation between levels of pS6 and p-AKT in the hearts. r – Pearson coefficient. (E) Correlation between levels of pS6 (in hearts) and an increase in insulin levels upon re-feeding in both females and males taken together.
The most important discovery was that levels of pS6 were significantly (p <0.0001) higher in male hearts (Fig. 2B). Similarly, levels of p-AKT were higher in males when measured in the hearts (significance p = 0.0001) (Fig. 2C). Importantly, levels of pS6 and p-AKT in the hearts strongly correlated in a combined group of all males and females taken together (high p-AKT corresponded to high pS6) (Fig. 2D). Also we found strong correlation between surge of insulin after re-feeding and levels of pS6 in the hearts (Fig. 2E). Furthermore, pS6 and p-AKT were elevated in male livers (Fig. 3). In male livers, levels of pS6 were several times higher and statistically significant in comparison to females (Fig. 3A). Similarly, levels of p-AKT were also statistically significantly higher in males (Fig. 3B). There was a strong correlation between the levels of p-AKT and pS6 in livers of all mice in this study (Fig. 3C). To confirm results obtained by immunoblotting we stained for pS6 sections of the livers from all the mice. Immunohistochemistry demonstrated that all individual male mice had elevated levels of pS6 compared with females (Fig. 3D). Noteworthy, pS6 was localized in the cytoplasm of hepatocytes. Levels of pS6 in females were so low compared with males, that it was possible to see staining as small cytoplasmic grains (Fig. 3D). Thus two different methods and two different organs demonstrated the same results.
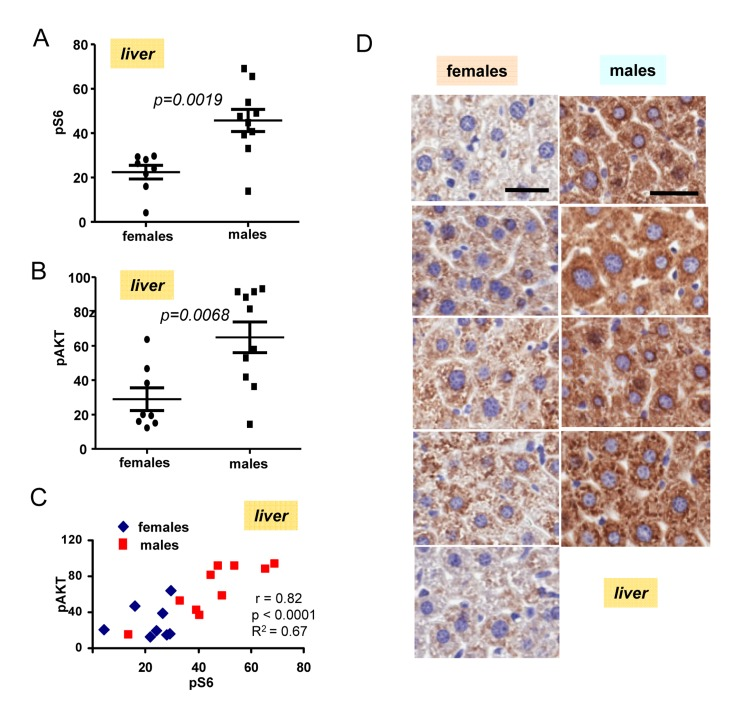
Figure 3. Levels of pS6 and pAKT in the livers of 6 months old females and males (A) Quantified intensities of pS6 signal in livers of females (n=8) and males 10). Data are mean ± SE. (B) Quantified intensities of p-Akt signal in livers of females (n=8) and males 10). Data are mean ± SE. (C) Correlation between levels of pS6 and p-AKT in livers. (D) Immunohistochemistry. pS6 in the livers of individual males and females. Mice were fasted overnight, then re-fed and sacrificed 2 h later. Bar – 30 μm.
Effect of fasting and rapamycin injections in 10 months old mice
In next series of experiments, we subdivided 10 months old mice in 3 sub-groups: fasted, fed ad libitum (control), and control mice treated with rapamycin (Fig. 4). First, we noticed that the difference in p-AKT and pS6 in hearts between control and fasted females as well as between control and fasted males (Fig. 4A) were not significant (Fig. 4 C,E)). We combined two sub-groups of males (individuals with numbers 17-22 plus 23-28) into the male group and, similarly, two sub-groups of females (individuals with numbers 1-5 plus 6-10) into the female group (Fig. 4. B, D) to compare pS6 (Fig. 4 B) and p-AKT (Fig. 4 D) directly between two groups: females vs males (Fig. 4B, D).
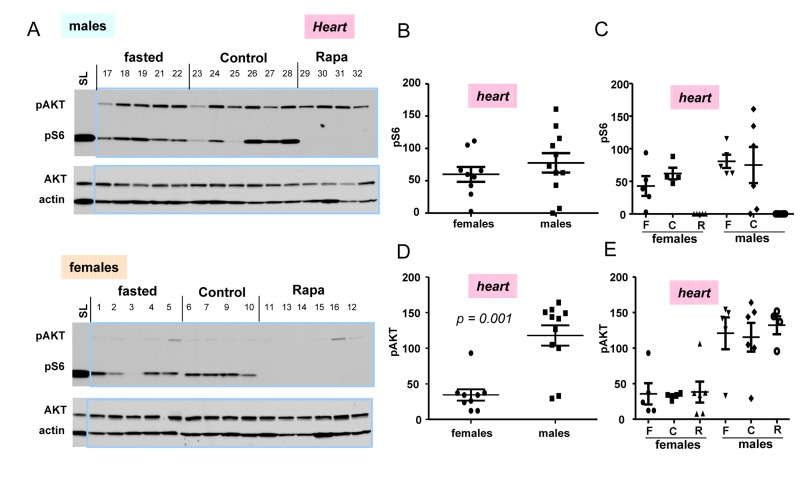
Figure 4. Levels of pS6 and p-AKT in the hearts of 10 months old mice: control, fasted, rapamycin (A) Immunoblot analysis of protein lysates from the hearts of females and males. Numbers above blots are individual mice in each group. Standard loading (SL) – 10 microgram lysates from cultured cells were loaded onto each upper and lower gels and blots were exposed to comparable intensities in SL lanes,. Fasted: mice were fasted for 16 h and sacrificed, control: mice were fed ad libitum, Rapa: “control” mice were treated with 1.5 mg/kg rapamycin (i.p.) 1 h before sacrifice. (B, D) – Quantified intensities of pS6 and p-Akt signal in hearts of females versus males. Female and male groups were comprised of all animals un-treated with rapamycin (n = 9 in female group and n = 11 in male group) regardless of feeding status. Data are mean ± SE. (C, E) Quantified intensities of pS6 and p-Akt signal in each sub-group. Mean ± SE in each subgroup separately: F – fasted; C – control; R – rapamycin-treated subgroup.
(Note: rapamycin-treated mice were not included in such groups and were compared with non-treated groups separately in Fig. 4 C, E). There was a tendency to a higher pS6 in male hearts (Fig. 4 B); however a number of mice was likely to be too small to obtain statistical significance. P-AKT was statistically and dramatically over-expressed in the hearts of males compared with females (Fig. 4 D).
Most measurements were done using 18-well gel/blots. In order to compare levels of pS6 and p-AKT on different blots, produced at different times, with different antibody manufactures and different times of exposure, we decided to include cell culture lysates as loading/exposure controls in each gel. In Fig. 4A, we used 10 μg of the HT-p21-9 lysates used by us in previous studies. For tissues we used 30 ug of protein per well. We found that levels of pS6 in mice tissues were at least an order of magnitude lower than levels of pS6 in cultured cells (Fig. 4A). This result may reflect more “contact-inhibited” conditions in the organs and also less stimulation of the mTOR pathway in normal cells in the organism compared with cancer cells (HT-p21-9 cells). Comparison of levels of mTOR activation in the organism and cell culture will be the subject of separate investigation. Also interestingly, levels of p-AKT were much higher in animal organism than in cultured cells. Levels of p-AKT were significant higher in male hearts compared to females (Fig. 4C).
Rapamycin decreased pS6 but did not affect p-AKT
While rapamycin decreased pS6 in male and female hearts; it did not affect levels of p-AKT (Fig. 4A, B, and C).
Rapamycin did not completely inhibit pS6 in males compared to females
Next we performed immunoblot of tissues obtained from livers from fasted, control and rapamycin-treatedmales and females (Fig. 5A). Levels of pS6 and p-AKT in males were statistically higher then these levels in females (Fig. 5B and C). Using longer exposure, evidenced by the signal obtained from of loading control lysate (SL), we found that pS6 was detectable in the livers from males treated with rapamycin (Fig. 5A). Like in hearts (shown in Fig. 4), rapamycin also did not affect p-AKT in livers of both males and females (Fig. 5A).
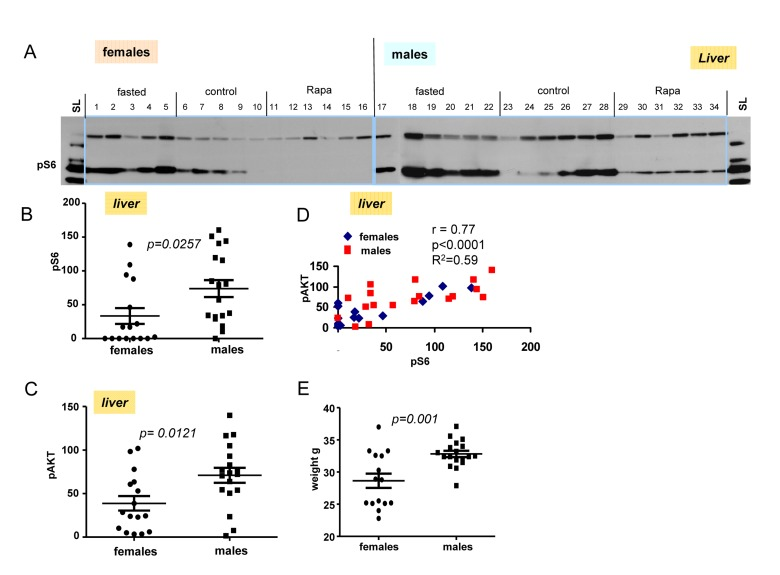
Figure 5. Levels of pS6 and p-AKT in the livers of 10 months old mice: control, fasted, rapamycin (A) Immunoblot analysis of protein lysates from livers of older (10 months old) females and males. Numbers indicate individual mice in each group. SL – standard loading,1 ug lysates from cultured cells was loaded onto each gel (left and right) and blots were over-exposed to obtain comparable intensities in standard loading lanes. (B) Quantified intensities of phosphorylated S6 (pS6) signal in livers of females and males. Left panel – female and male groups were comprised of all the animals from 3 groups (fasted, control and rapamycin) – n = 15 in female group and n = 18 in males group. Data are mean ± SE. (C) Quantified intensities of phosphorylated AKT (Ser 473) in livers of females and males. Data presented as described in legend B. (D) Correlation between levels of pS6 and p-AKT in livers from all the mice under study. (E) Comparison of older (~10 months old) female and male mice weights. Data present mean ± SE.
These results were confirmed in four organs (heart, liver, intestine, kidney) performed by immuno-histochemistry (Fig. 6, 7). First, there was no significant difference between fasted and fed ad libitum animals, indicating that fasting just marginally inhibited pS6. In contrast, in rapamycin-treated mice, levels of pS6 were dramatically decreased in all 4 organs (Fig. 6, 7).
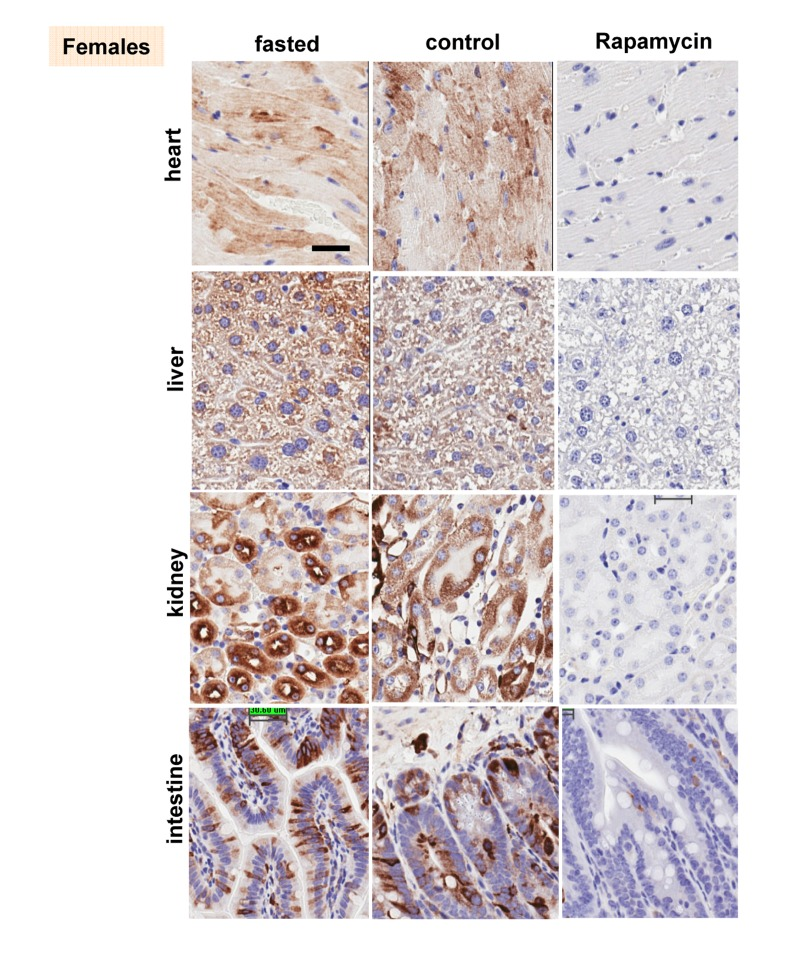
Figure 6. Females: Immunochemistry of pS6 in the organs pS6 in different organs of females (~ 10 months old). Fasted - mice were fasted overnight and sacrificed; control – mice received food ad libitum; rapamycin – mice received 1.5 mg/kg rapamycin i.p. and sacrificed 1 h later Bar. – 30 μm.
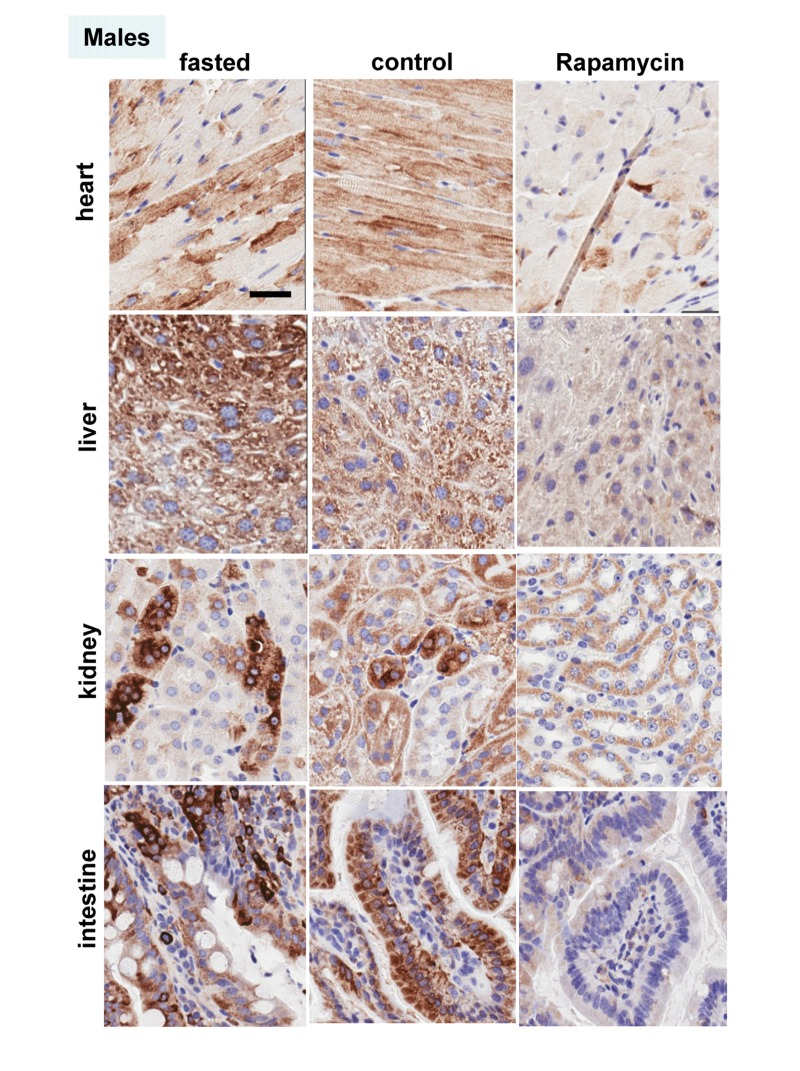
Figure 7. Males: Immunochemistry of pS6 in the organs pS6 in different organs of males (~ 10 months old). Fasted - mice were fasted overnight and sacrificed; control – mice received food ad libitum; rapamycin – mice received 1.5 mg/kg rapamycin i.p. and sacrificed 1 h later. Bar – 30 μm.
However, the effect of rapamycin was more pronounced in females compared to males (Fig. 6 vs 7). In males, rapamycin decreased levels of S6 phosphorylation but pS6 staining was still well detectable in all 4 organs (Fig. 7). However, in female organs rapamycin not only decreased levels of pS6 but also completely eliminated it, making it undetectable (Fig. 5A and 6).
Discussion
Why males, who are robust in young age, usually undergo unhealthy and rapid aging and die relatively fast? There are many explanations including unhealthy life style, at least, in humans. But the universality of the phenomenon is startling. Among hundreds of theories there were some that propose that women live longer after menopause for the purpose to help their daughters to raise grandchildren [137-139]. Such theories imply that diseases like menopause may be programmed. In contrast, menopause is an age-related disease because it increases mortality [140]. Like aging and diseases, menopause is not programmed but quasi-programmed [12]. Still females live longer. Females compete to a lesser extent and their accidental death rate is lower than in young males. Therefore, they are often smaller and weaker than males. Taking this into consideration, hyperfunction theory allowed us to solve the mystery of female longevity. Young females, which are smaller than males, might have a lower activity of the mTOR pathway. Since phosphorylation of S6 was inhibited by rapamycin, we consider it as the most reliable marker of mTORC1 activity, which is rapamycin sensitive. Here we assessed the activity of the mTOR pathway by pS6 (a marker of mTORC1) and p-AKT (Ser 473), which is a rapamycin-insensitive marker of mTORC2. At age of 6 months, males were significantly heavier than females. Both pS6 and p-AKT were statistically higher in at least some male organs, as indicated by both immunoblotting and immunohistochemistry (Fig. 2 and 3). Levels of pS6 significantly correlated with body weight and p-AKT (Fig. 2 and 3). Male mice had significantly higher fasted insulin levels and higher insulin response to re-feeding when compared to females (Fig. 1D and E). From 6 to 10 months age, the difference between males and females become less prominent. Since levels of pS6 were variable among individual mice, fasting decreased the average pS6 only marginally (control and fasted mice are different individuals) and a larger study may be required. In contrast to fasting, intraperitoneal (i.p.) administration of rapamycin dramatically decreased pS6 in all organs tested (the liver, the heart, the intestine, the kidney) (Fig. 4A, 5A, 6 and 7). The magnitude of S6 dephosphorylation by rapamyin was more pronounced in females than in males as seen on overexposed immunoblot of liver samples (Fig. 5A) and on immuno-histochemically stained slides of four organs (Fig. 6 and 7). In conclusion, our study demonstrated that both p-AKT and pS6 were higher in young males than in young females. These data can explain robust growth and faster aging in male species. Higher sensitivity of females to rapamycin explains superb life extension observed in females compared to males in several studies [86-88].
Many questions remain. Is p-AKT predominantly a marker of mTORC2 activity or also a marker of the activity of the AKT/mTOR pathway, acting upstream of mTOR. What other kinases are involved in S6 phosphorylation? What are other kinase pathways involved in senescence? What are other sites of phosphorylation and modification of multiple components of the mTOR pathway (including Akt, AMPK, TSC, IRS, PI-3K, elongation factors, raptor, TOR itself and so on) could be biomarkers of longevity, health and aging? How does the activity of the MTOR pathway affect the difference in longevity among species? For millennia, people erroneously thought that biological aging is caused by accumulation of all sorts of damage, a process similar to the decay of the Egypt pyramids or car rusting. More recently aging has been believed to be caused by accumulation of molecular damage such as DNA damage by free radicals [141-154] but this has been practically disproved [113, 155-168]. Also, mild hormesis that increases life span induces molecular damage [169-172].
Consider the simplest paradox of the molecular theory of aging. Obviously, nutrients provide energy to repair molecular damage. If this damage is a cause of aging, animals would live longer. However, it is exactly opposite: nutrients and obesity accelerate aging, whereas calorie restriction increases lifespan [55, 148, 149, 173-188]. It is possible to speculate about a mysterious allocation of energy to the anti-aging repair during famine and starvation (perhaps we can even doubt the law of energy conservation). But the fact is: the more energy (nutrients), the shorter lifespan. But the very simple solution to this paradox is that aging is not caused by accumulation of molecular damage [189]. Instead, aging is driven by the mTOR pathway, which is activated by growth factors, nutrients (food), insulin (which is induced by nutrients), testosterone and some other factors that all stimulate cellular and organismal growth. When development is completed the same still active mTOR pathway then drives aging and age-related diseases [189]. In other words, aging is a quasi-program of development, an aimless continuation of growth driven by nutrient/insulin-sensing signaling pathways [60]. Therefore, males live shorter not because they are too weak but because they are too robust (due to hyperactive mTOR).
Our work complements outstanding discoveries by Bartke and co-workers that high levels of growth hormone shorten life span. In fact, high levels of growth hormone (GH), IGF-1, insulin all decrease lifespan in mice. Such mice are big and short-lived. In contrast, mice deficient in GH/IGF-1 signaling live longer [190-198]. The GH/IGF-1 axis activates the mTOR pathway. In line with the hyperfunction theory is an excellent observation that big mice die young: early life body weight predicts longevity in genetically heterogeneous mice [199]. Our data provide mechanistic explanation: the higher the TOR activity, the bigger the mice. Early life growth hormone treatment shortens longevity [200, 201] and instead antagonists of these hormones may extend life span, treat cancer and some age-related diseases [202-206].
TOR-driven cellular hyperfunction and aging cause organ damage. For example, cancer cells are not weak but instead robust despite high levels of damage including DNA damage. An organism dies because cancer cells are too robust not because they are weak due to damage. Robustness, in part, can be explained by hyperactive TOR in cancer cells, which is the most common alteration in cancer and a target for therapy [125, 136, 207-239].
The hyperfunction theory suggests that if aggressive males must have high mTOR activity early in life, they must age fast too. Furthermore, the theory suggests that these aging-promoting genes like mTOR are antagonistically pleiotropic [110]. Active and robust mTOR pathway provides advantage early in life including reproduction (noteworthy, mTOR increases spermatogenesis and fertility). At the same time mTOR decreases survival much later in life, when an organism would not exist in dangerous for males natural environment anyway. And this mechanism is much more important to males than to females. It was theoretically described why and how males must age faster and die younger than females [12]. However, for the first time this hypothesis was supported experimentally.
Materials and Methods
Mice
All animal studies were conducted in accordance with the regulations of the Committee of Animal Care and Use at Roswell Park Cancer Institute. Mice were kept in polypropylene cages (30 × 21 × 10 cm) under standard light/dark regimen (12 hours light: 12 hours darkness) at 22 ± 2 °C and received standard laboratory chow (5% fat).
Study in 6 months old mice
Mice of C57BL/6NCr strain, 6 months old, were divided into 3 groups: 10 females and 10 males were fasted overnight and 10 females were fed ad libitum. Fasted and non-fasted blood sera were prepared, accordingly, for biochemical analysis. Fasted animals were re-fed and sacrificed 2 hour later.
Study in 10 months old mice
16 females and 18 males of C57BL/6NCr strain were randomly assigned to 3 of the following groups: fasted, control (received food ad libitum) and rapamycin treated. Mice in rapamycin group received rapamycin (purchased from LC laboratories, USA) at 1.5 mg/kg intraperitoneally (i.p.) and sacrificed an hour later. Mice in fasted group were fasted overnight and sacrificed. Non-fasted (fed) and fasted blood was collected. Blood was also collected after re-feeding during sacrifice. Glucose levels were measured directly in blood upon collection using Accu-Chek Aviva strips (McKesson, Atlanta, GA). Sera were prepared and used for biochemical analyses.
Insulin concentration in blood sera
Was measured using Insulin (Mouse) Ultrasensitive ELISA kit (ALPCO Diagnostics, Salem, NH) according to manufacture's protocol. Data were analyzed using range of insulin standards and four parameter logistic fit.
Statistical analyses
T test and correlation analyses (Pearson r coefficient and p value (two tailed)) were performed using GraphPad Prism version 5.00 for Windows, GraphPad Software, San Diego California USA, www.graphpad.com.
Western blot analysis
Tissues were homogenized in a Bullet blender using stainless steel 0.5 mm diameter beads (Next Advantage, Inc, Averill Park, NY, USA) and RIPA lysis buffer supplemented with protease and phosphatase inhibitor tablets (Roche Diagnostics, Indianapolis, IN, USA). Lysates were cleared by centrifugation at 4°C at 13,000 rpm. Equal amounts of protein were separated on gradient Criterion gels (BioRad) and immunoblotting was performed with rabbit anti-phospho S6(Ser 240/244), anti-phospho AKT (Ser473), anti-AKT and mouse anti-S6 antibodies from Cell Signaling Biotechnology as described previously [36, 39, 40]. Rabbit anti-actin antibody was from Sigma-Aldrich. Secondary antibodies were from Cell Signaling.
Immunochemistry
Dissected tissue samples were fixed in 10% buffered formalin, embedded into paraffin. 4 μm thin histological sections were stained with anti-phospho S6 (Ser240/244) antibody (Cell Signaling), followed by biotinylated goat-anti-rabbit secondary antibody (Vector, cat # BA-1000, Burlingame, CA) and counterstained with Hematoxylin.
Conflict of Interest Statement The authors of this manuscript have no conflict of interests to declare.
Supplementary Materials
References
- 1. Waldron I and Johnston S. Why do women live longer than men? J Human Stress. 1976; 2: 19 -30. .
- 2. Vina J, Borras C, Gambini J, Sastre J, Pallardo FV. Why females live longer than males? Importance of the upregulation of longevity-associated genes by oestrogenic compounds. FEBS Lett. 2005; 579: 2541 -2545. [PubMed] .
- 3. Clutton-Brock TH and Isvaran K. Sex differences in ageing in natural populations of vertebrates. Proc Biol Sci. 2007; 274: 3097 -3104. [PubMed] .
- 4. Passarino G, Calignano C, Vallone A, Franceschi C, Jeune B, Robine JM, Yashin AI, Cavalli Sforza LL, De Benedictis G. Male/female ratio in centenarians: a possible role played by population genetic structure. Exp Gerontol. 2002; 37: 1283 -1289. [PubMed] .
- 5. Austad SN. Why women live longer than men: sex differences in longevity. Gend Med. 2006; 3: 79 -92. [PubMed] .
- 6. Yashin AI, Wu D, Arbeev KG, Ukraintseva SV. Joint influence of small-effect genetic variants on human longevity. Aging (Albany NY). 2010; 2: 612 -620. [PubMed] .
- 7. Pan Z and Chang C. Gender and the regulation of longevity: implications for autoimmunity. Autoimmun Rev. 2012; 11: A393 -403. [PubMed] .
- 8. Crimmins EM, Kim JK, Hagedorn A. Life with and without disease: women experience more of both. J Women Aging. 2002; 14: 47 -59. [PubMed] .
- 9. Gowaty PA. Sex differences in ageing in natural populations of mammals and birds. J Biosci. 2007; 32: 1221 -1222. [PubMed] .
- 10. Newman AB, Glynn NW, Taylor CA, Sebastiani P, Perls TT, Mayeux R, Christensen K, Zmuda JM, Barral S, Lee JH, Simonsick EM, Walston JD, Yashin AI, Hadley E. Health and function of participants in the Long Life Family Study: A comparison with other cohorts. Aging (Albany NY). 2011; 3: 63 -76. [PubMed] .
- 11. Blagosklonny MV. Why the disposable soma theory cannot explain why women live longer and why we age. Aging (Albany NY). 2010; 2: 884 -887. [PubMed] .
- 12. Blagosklonny MV. Why men age faster but reproduce longer than women: mTOR and evolutionary perspectives. Aging (Albany NY). 2010; 2: 265 -273. [PubMed] .
- 13. Schmelzle T and Hall MN. TOR, a central controller of cell growth. Cell. 2000; 103: 253 -262. [PubMed] .
- 14. Proud CG. Amino acids and mTOR signalling in anabolic function. Biochem Soc Trans. 2007; 35: 1187 -1190. [PubMed] .
- 15. Cornu M, Albert V, Hall MN. mTOR in aging, metabolism, and cancer. Curr Opin Genet Dev. 2012; .
- 16. Lee CH, Inoki K, Guan KL. mTOR Pathway as a Target in Tissue Hypertrophy. Annu Rev Pharmacol Toxicol. 2007; 47: 443 -467. [PubMed] .
- 17. Zoncu R, Efeyan A, Sabatini DM. mTOR: from growth signal integration to cancer, diabetes and ageing. Nat Rev Mol Cell Biol. 2011; 12: 21 -35. [PubMed] .
- 18. Bhatia B, Nahle Z, Kenney AM. Double trouble: when sonic hedgehog signaling meets TSC inactivation. Cell Cycle. 2010; 9: 456 -459. [PubMed] .
- 19. Tsang CK, Liu H, Zheng XF. mTOR binds to the promoters of RNA polymerase I- and III-transcribed genes. Cell Cycle. 2010; 9: 953 -957. [PubMed] .
- 20. Sarbassov dos D, Ali SM, Sabatini DM. Growing roles for the mTOR pathway. Curr Opin Cell Biol. 2005; 17: 596 -603. [PubMed] .
- 21. Yan L, Mieulet V, Lamb RF. Nutrient regulation of mTORC1 and cell growth. Cell Cycle. 2010; 9: 2473 -2474. [PubMed] .
- 22. Mounier R, Lantier L, Leclerc J, Sotiropoulos A, Foretz M, Viollet B. Antagonistic control of muscle cell size by AMPK and mTORC1. Cell Cycle. 2011; 10: 2640 -2646. [PubMed] .
- 23. Blagosklonny MV and Hall MN. Growth and aging: a common molecular mechanism. Aging (Albany NY). 2009; 1: 357 -362. [PubMed] .
- 24. Shaw RJ, Bardeesy N, Manning BD, Lopez L, Kosmatka M, DePinho RA, Cantley LC. The LKB1 tumor suppressor negatively regulates mTOR signaling. Cancer Cell. 2004; 6: 91 -99. [PubMed] .
- 25. Shaw RJ and Cantley LC. Ras, PI(3)K and mTOR signalling controls tumour cell growth. Nature. 2006; 441: 424 -430. [PubMed] .
- 26. Pena-Llopis S and Brugarolas J. TFEB, a novel mTORC1 effector implicated in lysosome biogenesis, endocytosis and autophagy. Cell Cycle. 2011; 10: 3987 -3988. [PubMed] .
- 27. Blagosklonny MV. Cell cycle arrest is not senescence. Aging (Albany NY). 2011; 3: 94 -101. [PubMed] .
- 28. CoppŽ JP, Patil CK, Rodier F, Sun Y, Mu-oz DP, Goldstein J, Nelson PS, Desprez PY, Campisi J. Senescence-associated secretory phenotypes reveal cell-nonautonomous functions of oncogenic RAS and the p53 tumor suppressor. PLoS Biol. 2008; 6: 2853 -2868. [PubMed] .
- 29. de Keizer PL, Laberge RM, Campisi J. p53: Pro-aging or pro-longevity? Aging (Albany NY). 2010; 2: 377 -379. [PubMed] .
- 30. Rodier F, Munoz DP, Teachenor R, Chu V, Le O, Bhaumik D, Coppe JP, Campeau E, Beausejour CM, Kim SH, Davalos AR, Campisi J. DNA-SCARS: distinct nuclear structures that sustain damage-induced senescence growth arrest and inflammatory cytokine secretion. J Cell Sci. 2011; 124: 68 -81. [PubMed] .
- 31. Demidenko ZN and Blagosklonny MV. Growth stimulation leads to cellular senescence when the cell cycle is blocked. Cell Cycle. 2008; 7: 3355 -3361. [PubMed] .
- 32. Demidenko ZN, Zubova SG, Bukreeva EI, Pospelov VA, Pospelova TV, Blagosklonny MV. Rapamycin decelerates cellular senescence. Cell Cycle. 2009; 8: 1888 -1895. [PubMed] .
- 33. Demidenko ZN, Shtutman M, Blagosklonny MV. Pharmacologic inhibition of MEK and PI-3K converges on the mTOR/S6 pathway to decelerate cellular senescence. Cell Cycle. 2009; 8: 1896 -1900. [PubMed] .
- 34. Pospelova TV, Demidenko ZN, Bukreeva EI, Pospelov VA, Gudkov AV, Blagosklonny MV. Pseudo-DNA damage response in senescent cells. Cell Cycle. 2009; 8: 4112 -4118. [PubMed] .
- 35. Demidenko ZN and Blagosklonny MV. Quantifying pharmacologic suppression of cellular senescence: prevention of cellular hypertrophy versus preservation of proliferative potential. Aging (Albany NY). 2009; 1: 1008 -1016. [PubMed] .
- 36. Leontieva O, Gudkov A, Blagosklonny M. Weak p53 permits senescence during cell cycle arrest. Cell Cycle. 2010; 9: 4323 -4327. [PubMed] .
- 37. Pani G. From growing to secreting: new roles for mTOR in aging cells. Cell Cycle. 2011; 10: 2450 -2453. [PubMed] .
- 38. Blagosklonny MV. Cell cycle arrest is not yet senescence, which is not just cell cycle arrest: terminology for TOR-driven aging. Aging (Albany NY). 2012; 4: 159 -165. [PubMed] .
- 39. Leontieva OV, Natarajan V, Demidenko ZN, Burdelya LG, Gudkov AV, Blagosklonny MV. Hypoxia suppresses conversion from proliferative arrest to cellular senescence. Proc Natl Acad Sci U S A. 2012; 109: 13314 -13318. [PubMed] .
- 40. Leontieva OV and Blagosklonny MV. DNA damaging agents and p53 do not cause senescence in quiescent cells, while consecutive re-activation of mTOR is associated with conversion to senescence. Aging (Albany NY). 2010; 2: 924 -935. [PubMed] .
- 41. Leontieva OV, Lenzo F, Demidenko ZN, Blagosklonny MV. Hyper-mitogenic drive coexists with mitotic incompetence in senescent cells. Cell Cycle. 2012; 11: 4642 -4649. [PubMed] .
- 42. Castilho RM, Squarize CH, Chodosh LA, Williams BO, Gutkind JS. mTOR mediates Wnt-induced epidermal stem cell exhaustion and aging. Cell Stem Cell. 2009; 5: 279 -289. [PubMed] .
- 43. Chen C, Liu Y, Zheng P. mTOR regulation and therapeutic rejuvenation of aging hematopoietic stem cells. Sci Signal. 2009; 2: ra75 [PubMed] .
- 44. Stipp D. A new path to longevity. Sci Am. 2012; 306: 32 -39. [PubMed] .
- 45. Kaeberlein M, Powers RW 3rd, Steffen KK, Westman EA, Hu D, Dang N, Kerr EO, Kirkland KT, Fields S, Kennedy BK. Regulation of yeast replicative life span by TOR and Sch9 in response to nutrients. Science. 2005; 310: 1193 -1196. [PubMed] .
- 46. Kapahi P, Zid BM, Harper T, Koslover D, Sapin V, Benzer S. Regulation of lifespan in Drosophila by modulation of genes in the TOR signaling pathway. Curr Biol. 2004; 14: 885 -890. [PubMed] .
- 47. Jia K, Chen D, Riddle DL. The TOR pathway interacts with the insulin signaling pathway to regulate C. elegans larval development, metabolism and life span. Development. 2004; 131: 3897 -3906. [PubMed] .
- 48. Ayyadevara S, Alla R, Thaden JJ, Shmookler Reis RJ. Remarkable longevity and stress resistance of nematode PI3K-null mutants. Aging Cell. 2008; 7: 13 -22. [PubMed] .
- 49. Stanfel MN, Shamieh LS, Kaeberlein M, Kennedy BK. The TOR pathway comes of age. Biochim Biophys Acta. 2009; 1790: 1067 -1074. [PubMed] .
- 50. Kapahi P, Chen D, Rogers AN, Katewa SD, Li PW, Thomas EL, Kockel L. With TOR, less is more: a key role for the conserved nutrient-sensing TOR pathway in aging. Cell Metab. 2010; 11: 453 -465. [PubMed] .
- 51. Lee JH, Budanov AV, Park EJ, Birse R, Kim TE, Perkins GA, Ocorr K, Ellisman MH, Bodmer R, Bier E, Karin M. Sestrin as a feedback inhibitor of TOR that prevents age-related pathologies. Science. 2010; 327: 1223 -1228. [PubMed] .
- 52. Selman C, Lingard S, Choudhury AI, Batterham RL, Claret M, Clements M, Ramadani F, Okkenhaug K, Schuster E, Blanc E, Piper MD, Al-Qassab H, Speakman JR, Carmignac D, Robinson IC, Thornton J, Gems D, Partridge L, Withers DJ. Evidence for lifespan extension and delayed age-related biomarkers in insulin receptor substrate 1 null mice. FASEB J. 2008; 22: 807 -818. [PubMed] .
- 53. Selman C, Tullet JM, Wieser D, Irvine E, Lingard SJ, Choudhury AI, Claret M, Al-Qassab H, Carmignac D, Ramadani F, Woods A, Robinson IC, Schuster E, Batterham RL, Kozma SC, Thomas G, et al. Ribosomal protein S6 kinase 1 signaling regulates mammalian life span. Science. 2009; 326: 140 -144. [PubMed] .
- 54. Katewa SD and Kapahi P. Role of TOR signaling in aging and related biological processes in Drosophila melanogaster. Exp Gerontol. 2011; 46: 382 -390. [PubMed] .
- 55. Barzilai N, Huffman DM, Muzumdar RH, Bartke A. The critical role of metabolic pathways in aging. Diabetes. 2012; 61: 1315 -1322. [PubMed] .
- 56. Partridge L, Alic N, Bjedov I, Piper MD. Ageing in Drosophila: the role of the insulin/Igf and TOR signalling network. Exp Gerontol. 2011; 46: 376 -381. [PubMed] .
- 57. Demidenko ZN. Rapamycin for life: a step to immortality. Cell Cycle. 2011; 10: 4206 [PubMed] .
- 58. Passtoors WM, Beekman M, Deelen J, van der Breggen R, Maier AB, Guigas B, Derhovanessian E, van Heemst D, de Craen AJ, Gunn DA, Pawelec G, Slagboom PE. Gene expression analysis of mTOR pathway: association with human longevity. Aging Cell. 2013; 12: 24 -31. [PubMed] .
- 59. Haselton A, Sharmin E, Schrader J, Sah M, Poon P, Fridell YW. Partial ablation of adult Drosophila insulin-producing neurons modulates glucose homeostasis and extends life span without insulin resistance. Cell Cycle. 2010; 9: 3063 -3071. [PubMed] .
- 60. Blagosklonny MV. Aging and immortality: quasi-programmed senescence and its pharmacologic inhibition. Cell Cycle. 2006; 5: 2087 -2102. [PubMed] .
- 61. Tsang CK, Qi H, Liu LF, Zheng XFS. Targeting mammalian target of rapamycin (mTOR) for health and diseases. Drug Disc Today. 2007; 12: 112 -124. .
- 62. Inoki K, Corradetti MN, Guan KL. Dysregulation of the TSC-mTOR pathway in human disease. Nat Genet. 2005; 37: 19 -24. [PubMed] .
- 63. Chen WQ, Zhong L, Zhang L, Ji XP, Zhang M, Zhao YX, Zhang C, Zhang Y. Oral rapamycin attenuates inflammation and enhances stability of atherosclerotic plaques in rabbits independent of serum lipid levels. Br J Pharmacol. 2009; 156: 941 -951. [PubMed] .
- 64. Blagosklonny MV. Validation of anti-aging drugs by treating age-related diseases. Aging (Allbany NY). 2009; 1: 281 -288. .
- 65. Blagosklonny MV. Prospective treatment of age-related diseases by slowing down aging. Am J Pathol. 2012; 181: 1142 -1146. [PubMed] .
- 66. Dazert E and Hall MN. mTOR signaling in disease. Curr Opin Cell Biol. 2011; .
- 67. Zhao C and Vollrath D. mTOR pathway activation in age-related retinal disease. Aging (Albany NY). 2011; 3: 346 -347. [PubMed] .
- 68. Saha AK, Xu XJ, Balon TW, Brandon A, Kraegen EW, Ruderman NB. Insulin resistance due to nutrient excess: is it a consequence of AMPK downregulation? Cell Cycle. 2011; 10: 3447 -3451. [PubMed] .
- 69. Lu MK, Gong XG, Guan KL. mTOR in podocyte function: is rapamycin good for diabetic nephropathy? Cell Cycle. 2011; 10: 3415 -3416. [PubMed] .
- 70. Williamson DL. Normalizing a hyperactive mTOR initiates muscle growth during obesity. Aging (Albany NY). 2011; 3: 83 -84. [PubMed] .
- 71. Majumder S, Caccamo A, Medina DX, Benavides AD, Javors MA, Kraig E, Strong R, Richardson A, Oddo S. Lifelong rapamycin administration ameliorates age-dependent cognitive deficits by reducing IL-1beta and enhancing NMDA signaling. Aging Cell. 2012; 11: 326 -335. [PubMed] .
- 72. Romanov VS, Abramova MV, Svetlikova SB, Bykova TV, Zubova SG, Aksenov ND, Fornace AJ Jr., Pospelova TV, Pospelov VA. p21(Waf1) is required for cellular senescence but not for cell cycle arrest induced by the HDAC inhibitor sodium butyrate. Cell Cycle. 2010; 9: 3945 -3955. [PubMed] .
- 73. Kolesnichenko M, Hong L, Liao R, Vogt PK, Sun P. Attenuation of TORC1 signaling delays replicative and oncogenic RAS-induced senescence. Cell Cycle. 2012; 11: 2391 -2401. [PubMed] .
- 74. Pospelova TV, Leontieva OV, Bykova TV, Zubova SG, Pospelov VA, Blagosklonny MV. Suppression of replicative senescence by rapamycin in rodent embryonic cells. Cell Cycle. 2012; 11: 2402 -2407. [PubMed] .
- 75. Wesierska-Gadek J. mTOR and its link to the picture of Dorian Gray - re-activation of mTOR promotes aging. Aging (Albany NY). 2010; 2: 892 -893. [PubMed] .
- 76. Dulic V. Be quiet and you'll keep young: does mTOR underlie p53 action in protecting against senescence by favoring quiescence? Aging (Albany NY). 2011; 3: 3 -4. [PubMed] .
- 77. Maki CG. Decision-making by p53 and mTOR. Aging (Albany NY). 2010; 2: 324 -326. [PubMed] .
- 78. Serrano M. Shifting senescence into quiescence by turning up p53. Cell Cycle. 2010; 9: 4256 -4257. [PubMed] .
- 79. Cho S and Hwang ES. Status of mTOR activity may phenotypically differentiate senescence and quiescence. Mol Cells. 2012; 33: 597 -604. [PubMed] .
- 80. Menendez JA, Vellon L, Oliveras-Ferraros C, Cufi S, Vazquez-Martin A. mTOR-regulated senescence and autophagy during reprogramming of somatic cells to pluripotency: a roadmap from energy metabolism to stem cell renewal and aging. Cell Cycle. 2011; 10: 3658 -3677. [PubMed] .
- 81. Powers RWr, Kaeberlein M, Caldwell SD, Kennedy BK, Fields S. Extension of chronological life span in yeast by decreased TOR pathway signaling. Genes Dev. 2006; 20: 174 -184. [PubMed] .
- 82. Khanna A and Kapahi P. Rapamycin: killing two birds with one stone. Aging (Albany NY). 2011; 3: 1043 -1044. [PubMed] .
- 83. Moskalev AA and Shaposhnikov MV. Pharmacological Inhibition of Phosphoinositide 3 and TOR Kinases Improves Survival of Drosophila melanogaster. Rejuvenation Res. 2010; 13: 246 -247. [PubMed] .
- 84. Polak P, Cybulski N, Feige JN, Auwerx J, RŸegg MA, Hall MN. Adipose-specific knockout of raptor results in lean mice with enhanced mitochondrial respiration. Cell Metab. 2008; 8: 399 -410. [PubMed] .
- 85. Bjedov I, Toivonen JM, Kerr F, Slack C, Jacobson J, Foley A, Partridge L. Mechanisms of life span extension by rapamycin in the fruit fly Drosophila melanogaster. Cell Metab. 2010; 11: 35 -46. [PubMed] .
- 86. Harrison DE, Strong R, Sharp ZD, Nelson JF, Astle CM, Flurkey K, Nadon NL, Wilkinson JE, Frenkel K, Carter CS, Pahor M, Javors MA, Fernandezr E, Miller RA. Rapamycin fed late in life extends lifespan in genetically heterogenous mice. Nature. 2009; 460: 392 -396. [PubMed] .
- 87. Miller RA, Harrison DE, Astle CM, Baur JA, Boyd AR, de Cabo R, Fernandez E, Flurkey K, Javors MA, Nelson JF, Orihuela CJ, Pletcher S, Sharp ZD, Sinclair D, Starnes JW, Wilkinson JE, et al. Rapamycin, but not resveratrol or simvastatin, extends life span of genetically heterogeneous mice. J Gerontol A Biol Sci Med Sci. 2011; 66: 191 -201. [PubMed] .
- 88. Anisimov VN, Zabezhinski MA, Popovich IG, Piskunova TS, Semenchenko AV, Tyndyk ML, Yurova MN, Rosenfeld SV, Blagosklonny MV. Rapamycin increases lifespan and inhibits spontaneous tumorigenesis in inbred female mice. Cell Cycle. 2011; 10: 4230 -4236. [PubMed] .
- 89. Anisimov VN, Zabezhinski MA, Popovich IG, Piskunova TS, Semenchenko AV, Tyndyk ML, Yurova MN, Antoch MP, Blagosklonny MV. Rapamycin extends maximal lifespan in cancer-prone mice. Am J Pathol. 2010; 176: 2092 -2097. [PubMed] .
- 90. Wilkinson JE, Burmeister L, Brooks SV, Chan CC, Friedline S, Harrison DE, Hejtmancik JF, Nadon N, Strong R, Wood LK, Woodward MA, Miller RA. Rapamycin slows aging in mice. Aging Cell. 2012; 11: 675 -682. [PubMed] .
- 91. Longo VD and Fontana L. Intermittent supplementation with rapamycin as a dietary restriction mimetic. Aging (Albany NY). 2011; 3: 1039 -1040. [PubMed] .
- 92. Levine AJ, Feng Z, Mak TW, You H, Jin S. Coordination and communication between the p53 and IGF-1-AKT-TOR signal transduction pathways. Genes Dev. 2006; 20: 267 -275. [PubMed] .
- 93. Lane DP, Verma C, Fang CC. The p53 inducing drug dosage may determine quiescence or senescence. Aging (Albany NY). 2010; 2: 748 [PubMed] .
- 94. Long JS and Ryan KM. p53 and senescence: a little goes a long way. Cell Cycle. 2010; 9: 4050 -4051. .
- 95. Galluzzi L, Kepp O, Kroemer G. TP53 and MTOR crosstalk to regulate cellular senescence. Aging (Albany NY). 2010; 2: 535 -537. [PubMed] .
- 96. Demidenko ZN, Korotchkina LG, Gudkov AV, Blagosklonny MV. Paradoxical suppression of cellular senescence by p53. Proc Natl Acad Sci U S A. 2010; 107: 9660 -9664. [PubMed] .
- 97. Korotchkina LG, Leontieva OV, Bukreeva EI, Demidenko ZN, Gudkov AV, Blagosklonny MV. The choice between p53-induced senescence and quiescence is determined in part by the mTOR pathway. Aging (Albany NY). 2010; 2: 344 -352. [PubMed] .
- 98. Chao SK, Horwitz SB, McDaid HM. Insights into 4E-BP1 and p53 mediated regulation of accelerated cell senescence. Oncotarget. 2011; 2: 89 -98. [PubMed] .
- 99. Komarova EA, Antoch MP, Novototskaya LR, Chernova OB, Paszkiewicz G, Leontieva OV, Blagosklonny MV, Gudkov AV. Rapamycin extends lifespan and delays tumorigenesis in heterozygous p53+/− mice. Aging (Albany NY). 2012; 4: 709 -714. [PubMed] .
- 100. Comas M, Toshkov I, Kuropatwinski KK, Chernova OB, Polinsky A, Blagosklonny MV, Gudkov AV, Antoch MP. New nanoformulation of rapamycin Rapatar extends lifespan in homozygous p53−/− mice by delaying carcinogenesis. Aging (Albany NY). 2012; 4: 715 -722. [PubMed] .
- 101. Roemer K. Are the conspicuous interdependences of fecundity, longevity and cognitive abilities in humans caused in part by p53? Cell Cycle. 2010; 9: 3438 -3441. [PubMed] .
- 102. Moskalev A and Shaposhnikov M. Pharmacological inhibition of NF-kappaB prolongs lifespan of Drosophila melanogaster. Aging (Albany NY). 2011; 3: 391 -394. [PubMed] .
- 103. Anisimov VN, Egormin PA, Piskunova TS, Popovich IG, Tyndyk ML, Yurova MN, Zabezhinski MA, Anikin IV, Karkach AS, Romanyukha AA. Metformin extends life span of HER-2/neu transgenic mice and in combination with melatonin inhibits growth of transplantable tumors in vivo. Cell Cycle. 2010; 9: 188 -197. [PubMed] .
- 104. Anisimov VN, Berstein LM, Popovich IG, Zabezhinski MA, Egormin PA, Piskunova TS, Semenchenko AV, Tyndyk ML, Yurova MN, Kovalenko IG, Poroshina TE. If started early in life, metformin treatment increases life span and postpones tumors in female SHR mice. Aging (Albany NY). 2011; 3: 148 -157. [PubMed] .
- 105. Menendez JA, Cufi S, Oliveras-Ferraros C, Vellon L, Joven J, Vazquez-Martin A. Gerosuppressant metformin: less is more. Aging (Albany NY). 2011; 3: 348 -362. [PubMed] .
- 106. Anisimov VN, Piskunova TS, Popovich IG, Zabezhinski MA, Tyndyk ML, Egormin PA, Yurova MV, Rosenfeld SV, Semenchenko AV, Kovalenko IG, Poroshina TE, Berstein LM. Gender differences in metformin effect on aging, life span and spontaneous tumorigenesis in 129/Sv mice. Aging (Albany NY). 2010; 2: 945 -958. [PubMed] .
- 107. Minois N, Carmona-Gutierrez D, Madeo F. Polyamines in aging and disease. Aging (Albany NY). 2011; 3: 716 -732. [PubMed] .
- 108. Blagosklonny MV. Metformin and sex: Why suppression of aging may be harmful to young male mice. Aging (Albany NY). 2010; 2: 897 -899. [PubMed] .
- 109. Xiang L, Nakamura Y, Lim YM, Yamasaki Y, Kurokawa-Nose Y, Maruyama W, Osawa T, Matsuura A, Motoyama N, Tsuda L. Tetrahydrocurcumin extends life span and inhibits the oxidative stress response by regulating the FOXO forkhead transcription factor. Aging (Albany NY). 2011; 3: 1098 -1109. [PubMed] .
- 110. Blagosklonny MV. Revisiting the antagonistic pleiotropy theory of aging: TOR-driven program and quasi-program. Cell Cycle. 2010; 9: 3151 -3156. [PubMed] .
- 111. Blagosklonny MV. Why human lifespan is rapidly increasing: solving “longevity riddle” with “revealed-slow-aging” hypothesis. Aging (Albany NY). 2010; 9: 177 -182. [PubMed] .
- 112. Blagosklonny MV. Rapamycin and quasi-programmed aging: Four years later. Cell Cycle. 2010; 9: 1859 -1862. [PubMed] .
- 113. Blagosklonny MV. Hormesis does not make sense except in the light of TOR-driven aging. Aging (Albany NY). 2011; 3: 1051 -1062. [PubMed] .
- 114. Proud CG. The multifaceted role of mTOR in cellular stress responses. DNA Repair. 2004; 3: 927 -934. [PubMed] .
- 115. Nobukuni T, Joaquin M, Roccio M, Dann SG, Kim SY, Gulati P, Byfield MP, Backer JM, Natt F, Bos JL, Zwartkruis FJ, Thomas G. Amino acids mediate mTOR/raptor signaling through activation of class 3 phosphatidylinositol 3OH-kinase. Proc Natl Acad Sci U S A. 2005; 102: 14238 -14243. [PubMed] .
- 116. Sengupta S, Peterson TR, Sabatini DM. Regulation of the mTOR complex 1 pathway by nutrients, growth factors, and stress. Mol Cell. 2010; 40: 310 -322. [PubMed] .
- 117. Oh WJ and Jacinto E. mTOR complex 2 signaling and functions. Cell Cycle. 2011; 10: 2305 -2316. [PubMed] .
- 118. Loewith R and Hall MN. Target of rapamycin (TOR) in nutrient signaling and growth control. Genetics. 2011; 189: 1177 -1201. [PubMed] .
- 119. Dann SG, Selvaraj A, Thomas G. mTOR Complex1-S6K1 signaling: at the crossroads of obesity, diabetes and cancer. Trends Mol Med. 2007; 13: 252 -259. [PubMed] .
- 120. Hay N and Sonenberg N. Upstream and downstream of mTOR. Genes Dev. 2004; 18: 1926 -1945. [PubMed] .
- 121. Bhaskar PT and Hay N. The Two TORCs and Akt. Dev Cell. 2007; 12: 487 -502. [PubMed] .
- 122. Wullschleger S, Loewith R, Hall MN. TOR signaling in growth and metabolism. Cell. 2006; 124: 471 -484. [PubMed] .
- 123. Um SH, Frigerio F, Watanabe M, Picard F, Joaquin M, Sticker M, Fumagalli S, Allegrini PR, Kozma SC, Auwerx J, Thomas G. Absence of S6K1 protects against age- and diet-induced obesity while enhancing insulin sensitivity. Nature. 2004; 431: 200 -205. [PubMed] .
- 124. Vazquez-Martin A, Cufi S, Oliveras-Ferraros C, Menendez JA. Raptor, a positive regulatory subunit of mTOR complex 1, is a novel phosphoprotein of the rDNA transcription machinery in nucleoli and chromosomal nucleolus organizer regions (NORs). Cell Cycle. 2011; 10: 3140 -3152. [PubMed] .
- 125. Brugarolas J, Lei K, Hurley RL, Manning BD, Reiling JH, Hafen E, Witters LA, Ellisen LW, Kaelin WG Jr.. Regulation of mTOR function in response to hypoxia by REDD1 and the TSC1/TSC2 tumor suppressor complex. Genes Dev. 2004; 18: 2893 -2904. [PubMed] .
- 126. Fingar DC, Richardson CJ, Tee AR, Cheatham L, Tsou C, Blenis J. mTOR controls cell cycle progression through its cell growth effectors S6K1 and 4E-BP1/eukaryotic translation initiation factor 4E. Mol Cell Biol. 2004; 24: 200 -216. [PubMed] .
- 127. Harrington LS, Findlay GM, Lamb RF. Restraining PI3K: mTOR signalling goes back to the membrane. Trends Biochem Sci. 2005; 30: 35 -42. [PubMed] .
- 128. Murakami M, Ichisaka T, Maeda M, Oshiro N, Hara K, Edenhofer F, Kiyama H, Yonezawa K, Yamanaka S. mTOR is essential for growth and proliferation in early mouse embryos and embryonic stem cells. Mol Cell Biol. 2004; 24: 6710 -6718. [PubMed] .
- 129. Tee AR and Blenis J. mTOR, translational control and human disease. Semin Cell Dev Biol. 2005; 16: 29 -37. [PubMed] .
- 130. Ruvinsky I, Sharon N, Lerer T, Cohen H, Stolovich-Rain M, Nir T, Dor Y, Zisman P, Meyuhas O. Ribosomal protein S6 phosphorylation is a determinant of cell size and glucose homeostasis. Genes Dev. 2005; 19: 2199 -2211. [PubMed] .
- 131. Jacinto E, Loewith R, Schmidt A, Lin S, Ruegg MA, Hall A, Hall MN. Mammalian TOR complex 2 controls the actin cytoskeleton and is rapamycin insensitive. Nat Cell Biol. 2004; 6: 1122 -1128. [PubMed] .
- 132. Hagiwara A, Cornu M, Cybulski N, Polak P, Betz C, Trapani F, Terracciano L, Heim MH, Ruegg MA, Hall MN. Hepatic mTORC2 Activates Glycolysis and Lipogenesis through Akt, Glucokinase, and SREBP1c. Cell Metab. 2012; 15: 725 -738. [PubMed] .
- 133. Shiota C, Woo JT, Lindner J, Shelton KD, Magnuson MA. Multiallelic disruption of the rictor gene in mice reveals that mTOR complex 2 is essential for fetal growth and viability. Dev Cell. 2006; 11: 583 -589. [PubMed] .
- 134. Chen CC, Jeon SM, Bhaskar PT, Nogueira V, Sundararajan D, Tonic I, Park Y, Hay N. FoxOs inhibit mTORC1 and activate Akt by inducing the expression of Sestrin3 and Rictor. Dev Cell. 18: 592 -604. [PubMed] .
- 135. Laplante M and Sabatini DM. An emerging role of mTOR in lipid biosynthesis. Curr Biol. 2009; 19: R1046 -1052. [PubMed] .
- 136. Yang WL, Wu CY, Wu J, Lin HK. Regulation of Akt signaling activation by ubiquitination. Cell Cycle. 2010; 9: 487 -497. [PubMed] .
- 137. Shanley DP and Kirkwood TB. Evolution of the human menopause. Bioessays. 2001; 23: 282 -287. [PubMed] .
- 138. Kirkwood TB. Understanding ageing from an evolutionary perspective. J Intern Med. 2008; 263: 117 -127. [PubMed] .
- 139. Shanley DP, Sear R, Mace R, Kirkwood TB. Testing evolutionary theories of menopause. Proc Biol Sci. 2007; 274: 2943 -2949. [PubMed] .
- 140. Horiuchi S. Postmenopausal acceleration of age-related mortality increase. J Gerontol A Biol Sci Med Sci. 1997; 52: B78 -92. [PubMed] .
- 141. Kirkwood TB and Austad SN. Why do we age? Nature. 2000; 408: 233 -238. [PubMed] .
- 142. Kirkwood TB. Understanding the odd science of aging. Cell. 2005; 120: 437 -447. [PubMed] .
- 143. Kirkwood TB and Kowald A. The free-radical theory of ageing--older, wiser and still alive: modelling positional effects of the primary targets of ROS reveals new support. Bioessays. 2012; 34: 692 -700. [PubMed] .
- 144. Zimniak P. What is the proximal cause of aging? Front Genet. 2012; 3: 189 [PubMed] .
- 145. Mulder H. Is shortening of telomeres the missing link between aging and the Type 2 Diabetes epidemic? Aging (Albany NY). 2010; 2: 634 -636. [PubMed] .
- 146. Burhans WC and Weinberger M. Revisiting the free radical theory using next-generation sequencing technology. Aging (Albany NY). 2010; 2: 459 -460. [PubMed] .
- 147. Stefanatos R and Sanz A. Mitochondrial complex I: a central regulator of the aging process. Cell Cycle. 2011; 10: 1528 -1532. [PubMed] .
- 148. Martins I, Galluzzi L, Kroemer G. Hormesis, cell death and aging. Aging (Albany NY). 2011; 3: 821 -828. [PubMed] .
- 149. Schulz TJ, Westermann D, Isken F, Voigt A, Laube B, Thierbach R, Kuhlow D, Zarse K, Schomburg L, Pfeiffer AF, Tschope C, Ristow M. Activation of mitochondrial energy metabolism protects against cardiac failure. Aging (Albany NY). 2010; 2: 843 -853. [PubMed] .
- 150. Papaconstantinou J and Hsieh CC. Activation of senescence and aging characteristics by mitochondrially generated ROS: how are they linked? Cell Cycle. 2010; 9: 3831 -3833. [PubMed] .
- 151. Seviour EG and Lin SY. The DNA damage response: Balancing the scale between cancer and ageing. Aging (Albany NY). 2010; 2: 900 -907. [PubMed] .
- 152. Krishnan V, Liu B, Zhou Z. 'Relax and Repair' to restrain aging. Aging (Albany NY). 2011; 3: 943 -954. [PubMed] .
- 153. Lu JY, Lin YY, Zhu H, Chuang LM, Boeke JD. Protein acetylation and aging. Aging (Albany NY). 2011; 3: 911 -912. [PubMed] .
- 154. Kocylowski MK and Halazonetis TD. SAHF, to senesce or not to senesce? Cell Cycle. 2011; 10: 738 -739. [PubMed] .
- 155. Blagosklonny MV. Aging: ROS or TOR. Cell Cycle. 2008; 7: 3344 -3354. [PubMed] .
- 156. Doonan R, McElwee JJ, Matthijssens F, Walker GA, Houthoofd K, Back P, Matscheski A, Vanfleteren JR, Gems D. Against the oxidative damage theory of aging: superoxide dismutases protect against oxidative stress but have little or no effect on life span in Caenorhabditis elegans. Genes Dev. 2008; 22: 3236 -3241. [PubMed] .
- 157. Gems D and Doonan R. Antioxidant defense and aging in C. elegans: Is the oxidative damage theory of aging wrong? Cell Cycle. 2009; 8: 1681 -1687. [PubMed] .
- 158. Gems D and Partridge L. Genetics of Longevity in Model Organisms: Debates and Paradigm Shifts. Annu Rev Physiol. 2012; .
- 159. Gems DH and de la Guardia YI. Alternative Perspectives on Aging in C. elegans: Reactive Oxygen Species or Hyperfunction? Antioxid Redox Signal. 2012; .
- 160. Perez VI, Van Remmen H, Bokov A, Epstein CJ, Vijg J, Richardson A. The overexpression of major antioxidant enzymes does not extend the lifespan of mice. Aging Cell. 2009; 8: 73 -75. [PubMed] .
- 161. Pani G. P66SHC and ageing: ROS and TOR? Aging (Albany NY). 2010; 2: 514 -518. [PubMed] .
- 162. Cabreiro F, Ackerman D, Doonan R, Araiz C, Back P, Papp D, Braeckman BP, Gems D. Increased life span from overexpression of superoxide dismutase in Caenorhabditis elegans is not caused by decreased oxidative damage. Free Radic Biol Med. 2011; 51: 1575 -1582. [PubMed] .
- 163. Lapointe J and Hekimi S. When a theory of aging ages badly. Cell Mol Life Sci. 2009; 67: 1 -8. [PubMed] .
- 164. Van Raamsdonk JM and Hekimi S. Deletion of the mitochondrial superoxide dismutase sod-2 extends lifespan in Caenorhabditis elegans. PLoS Genet. 2009; 5: e1000361 [PubMed] .
- 165. Speakman JR and Selman C. The free-radical damage theory: Accumulating evidence against a simple link of oxidative stress to ageing and lifespan. Bioessays. 2011; 33: 255 -259. [PubMed] .
- 166. Ristow M and Schmeisser S. Extending life span by increasing oxidative stress. Free Radic Biol Med. 2011; 51: 327 -336. [PubMed] .
- 167. Guachalla LM and Rudolph KL. ROS induced DNA damage and checkpoint responses: influences on aging? Cell Cycle. 2010; 9: 4058 -4060. [PubMed] .
- 168. Blagosklonny MV. Molecular damage in cancer: an argument for mTOR-driven aging. Aging (Albany NY). 2011; 3: 1130 -1141. [PubMed] .
- 169. Rattan SI. Hormetic modulation of aging and longevity by mild heat stress. Dose Response. 2006; 3: 533 -546. [PubMed] .
- 170. Le Bourg E and Rattan SI. Can dietary restriction increase longevity in all species, particularly in human beings? Introduction to a debate among experts. Biogerontology. 2006; 7: 123 -125. [PubMed] .
- 171. Rattan SIS. Anti-ageing strategies: prevention or therapy. EMBO Rep. 2005; 6: S25 -29. [PubMed] .
- 172. Gems D and Partridge L. Stress-response hormesis and aging: “that which does not kill us makes us stronger”. Cell Metab. 2008; 7: 200 -203. [PubMed] .
- 173. Blagosklonny MV. Rapamycin-induced glucose intolerance: Hunger or starvation diabetes. Cell Cycle. 2011; 10: 4217 -4224. [PubMed] .
- 174. Blagosklonny MV. Calorie restriction: Decelerating mTOR-driven aging from cells to organisms (including humans). Cell Cycle. 2010; 9: 683 -688. [PubMed] .
- 175. Fontana L. The scientific basis of caloric restriction leading to longer life. Curr Opin Gastroenterol. 2009; 25: 144 -150. [PubMed] .
- 176. Henry RR and Gumbiner B. Benefits and limitations of very-low-calorie diet therapy in obese NIDDM. Diabetes Care. 1991; 14: 802 -823. [PubMed] .
- 177. Mostoslavsky R, Esteller M, Vaquero A. At the crossroad of lifespan, calorie restriction, chromatin and disease: meeting on sirtuins. Cell Cycle. 2010; 9: 1907 -1912. [PubMed] .
- 178. Wang C, Maddick M, Miwa S, Jurk D, Czapiewski R, Saretzki G, Langie SA, Godschalk RW, Cameron K, von Zglinicki T. Adult-onset, short-term dietary restriction reduces cell senescence in mice. Aging (Albany NY). 2010; 2: 555 -566. [PubMed] .
- 179. Cohen HY, Miller C, Bitterman KJ, Wall NR, Hekking B, Kessler B, Howitz KT, Gorospe M, de Cabo R, Sinclair DA. Calorie restriction promotes mammalian cell survival by inducing the SIRT1 deacetylase. Science. 2004; 305: 390 -392. [PubMed] .
- 180. Bartke A, Wright JC, Mattison JA, Ingram DK, Miller RA, Roth GS. Dietary restriction and life-span. Science. 2002; 296: 2141 -2142. [PubMed] .
- 181. Kelley DE, Wing R, Buonocore C, Sturis J, Polonsky K, Fitzsimmons M. Relative effects of calorie restriction and weight loss in noninsulin-dependent diabetes mellitus. J Clin Endocrinol Metab. 1993; 77: 1287 -1293. [PubMed] .
- 182. Kirkland JL. Perspectives on cellular senescence and short term dietary restriction in adults. Aging (Albany NY). 2010; 2: 542 -544. [PubMed] .
- 183. Galikova M and Flatt T. Dietary restriction and other lifespan extending pathways converge at the activation of the downstream effector takeout. Aging (Albany NY). 2010; 2: 387 -389. [PubMed] .
- 184. Mattson MP and Wan R. Beneficial effects of intermittent fasting and caloric restriction on the cardiovascular and cerebrovascular systems. J Nutr Biochem. 2005; 16: 129 -137. [PubMed] .
- 185. Bodkin NL, Alexander TM, Ortmeyer HK, Johnson E, Hansen BC. Mortality and morbidity in laboratory-maintained Rhesus monkeys and effects of long-term dietary restriction. J Gerontol A Biol Sci Med Sci. 2003; 58: 212 -219. [PubMed] .
- 186. Colman RJ, Beasley TM, Allison DB, Weindruch R. Attenuation of sarcopenia by dietary restriction in rhesus monkeys. J Gerontol A Biol Sci Med Sci. 2008; 63: 556 -559. [PubMed] .
- 187. Colman RJ, Anderson RM, Johnson SC, Kastman EK, Kosmatka KJ, Beasley TM, Allison DB, Cruzen C, Simmons HA, Kemnitz JW, Weindruch R. Caloric restriction delays disease onset and mortality in rhesus monkeys. Science. 2009; 325: 201 -204. [PubMed] .
- 188. Mercken EM, Carboneau BA, Krzysik-Walker SM, de Cabo R. Of mice and men: the benefits of caloric restriction, exercise, and mimetics. Ageing Res Rev. 2012; 11: 390 -398. [PubMed] .
- 189. Blagosklonny MV. Paradoxes of aging. Cell Cycle. 2007; 6: 2997 -3003. [PubMed] .
- 190. Ikeno Y, Bronson RT, Hubbard GB, Lee S, Bartke A. Delayed occurrence of fatal neoplastic diseases in ames dwarf mice: correlation to extended longevity. J Gerontol A Biol Sci Med Sci. 2003; 58: 291 -296. [PubMed] .
- 191. Bartke A and Brown-Borg H. Life extension in the dwarf mouse. Curr Top Dev Biol. 2004; 63: 189 -225. [PubMed] .
- 192. Sharp ZD and Bartke A. Evidence for down-regulation of phosphoinositide 3-kinase/Akt/mammalian target of rapamycin (PI3K/Akt/mTOR)-dependent translation regulatory signaling pathways in Ames dwarf mice. J Gerontol A Biol Sci Med Sci. 2005; 60: 293 -300. [PubMed] .
- 193. Bartke A. Insulin and aging. Cell Cycle. 2008; 7: 3338 -3343. [PubMed] .
- 194. Bartke A. Long-lived Klotho mice: new insights into the roles of IGF-1 and insulin in aging. Trends Endocrinol Metab. 2006; 17: 33 -35. [PubMed] .
- 195. Ratajczak MZ, Shin DM, Ratajczak J, Kucia M, Bartke A. A novel insight into aging: are there pluripotent very small embryonic-like stem cells (VSELs) in adult tissues overtime depleted in an Igf-1-dependent manner? Aging (Albany NY). 2010; 2: 875 -883. [PubMed] .
- 196. Bartke A. Healthy aging: is smaller better? - a mini-review. Gerontology. 2012; 58: 337 -343. [PubMed] .
- 197. Bartke A, Coschigano K, Kopchick J, Chandrashekar V, Mattison J, Kinney B, Hauck S. Genes that prolong life: relationships of growth hormone and growth to aging and life span. J Gerontol A Biol Sci Med Sci. 2001; 56: B340 -349. [PubMed] .
- 198. Spong A and Bartke A. Rapamycin slows aging in mice. Cell Cycle. 2012; 11: 845 [PubMed] .
- 199. Miller RA, Harper JM, Galecki A, Burke DT. Big mice die young: early life body weight predicts longevity in genetically heterogeneous mice. Aging Cell. 2002; 1: 22 -29. [PubMed] .
- 200. Panici JA, Harper JM, Miller RA, Bartke A, Spong A, Masternak MM. Early life growth hormone treatment shortens longevity and decreases cellular stress resistance in long-lived mutant mice. Faseb J. 2010; 24: 5073 -5079. [PubMed] .
- 201. Bartke A. Can growth hormone (GH) accelerate aging? Evidence from GH-transgenic mice. Neuroendocrinology. 2003; 78: 210 -216. [PubMed] .
- 202. Siejka A, Barabutis N, Schally AV. GHRH antagonist MZ-5-156 increases the expression of AMPK in A549 lung cancer cells. Cell Cycle. 2011; 10: 3714 -3718. [PubMed] .
- 203. Barabutis N and Schally AV. Growth hormone-releasing hormone: extrapituitary effects in physiology and pathology. Cell Cycle. 2010; 9: 4110 -4116. [PubMed] .
- 204. Szepeshazi K, Schally AV, Keller G, Block NL, Benten D, Halmos G, Szalontay L, Vidaurre I, Jaszberenyi M, Rick FG. Receptor-targeted therapy of human experimental urinary bladder cancers with cytotoxic LH-RH analog AN-152 [AEZS- 108]. Oncotarget. 2012; 3: 686 -699. [PubMed] .
- 205. Perez R, Schally AV, Vidaurre I, Rincon R, Block NL, Rick FG. Antagonists of growth hormone-releasing hormone suppress in vivo tumor growth and gene expression in triple negative breast cancers. Oncotarget. 2012; 3: 988 -997. [PubMed] .
- 206. Hohla F and Schally AV. Targeting gastrin releasing peptide receptors: New options for the therapy and diagnosis of cancer. Cell Cycle. 2010; 9: 1738 -1741. [PubMed] .
- 207. Vogelstein B and Kinzler KW. Cancer genes and the pathways they control. Nat Med. 2004; 10: 789 -799. [PubMed] .
- 208. Schmidt-Kittler O, Zhu J, Yang J, Liu G, Hendricks W, Lengauer C, Gabelli SB, Kinzler KW, Vogelstein B, Huso DL, Zhou S. PI3Kalpha inhibitors that inhibit metastasis. Oncotarget. 2010; 1: 339 -348. [PubMed] .
- 209. Choo AY and Blenis J. TORgeting oncogene addiction for cancer therapy. Cancer Cell. 2006; 9: 77 -79. [PubMed] .
- 210. Adams JR, Schachter NF, Liu JC, Zacksenhaus E, Egan SE. Elevated PI3K signaling drives multiple breast cancer subtypes. Oncotarget. 2011; 2: 435 -447. [PubMed] .
- 211. Dancey JE. Therapeutic targets: MTOR and related pathways. Cancer Biol Ther. 2006; 5: 1065 -1073. [PubMed] .
- 212. Bernardi R, Guernah I, Jin D, Grisendi S, Alimonti A, Teruya-Feldstein J, Cordon-Cardo C, Simon MC, Rafii S, Pandolfi PP. PML inhibits HIF-1alpha translation and neoangiogenesis through repression of mTOR. Nature. 2006; 442: 779 -785. [PubMed] .
- 213. Gruppuso PA, Boylan JM, Sanders JA. The physiology and pathophysiology of rapamycin resistance: implications for cancer. Cell Cycle. 2011; 10: 1050 -1058. [PubMed] .
- 214. Averous J, Fonseca BD, Proud CG. Regulation of cyclin D1 expression by mTORC1 signaling requires eukaryotic initiation factor 4E-binding protein 1. Oncogene. 2008; 27: 1106 -1113. [PubMed] .
- 215. Cully M, You H, Levine AJ, Mak TW. Beyond PTEN mutations: the PI3K pathway as an integrator of multiple inputs during tumorigenesis. Nat Rev Cancer. 2006; 6: 184 -192. [PubMed] .
- 216. Green AS, Chapuis N, Lacombe C, Mayeux P, Bouscary D, Tamburini J. LKB1/AMPK/mTOR signaling pathway in hematological malignancies: from metabolism to cancer cell biology. Cell Cycle. 2011; 10: 2115 -2120. [PubMed] .
- 217. Sokolosky ML, Stadelman KM, Chappell WH, Abrams SL, Martelli AM, Stivala F, Libra M, Nicoletti F, Drobot LB, Franklin RA, Steelman LS, McCubrey JA. Involvement of Akt-1 and mTOR in sensitivity of breast cancer to targeted therapy. Oncotarget. 2011; 2: 538 -550. [PubMed] .
- 218. Sabatini DM. mTOR and cancer: insights into a complex relationship. Nat Rev Cancer. 2006; 6: 729 -734. [PubMed] .
- 219. Steelman LS, Navolanic P, Chappell WH, Abrams SL, Wong EW, Martelli AM, Cocco L, Stivala F, Libra M, Nicoletti F, Drobot LB, Franklin RA, McCubrey JA. Involvement of Akt and mTOR in chemotherapeutic- and hormonal-based drug resistance and response to radiation in breast cancer cells. Cell Cycle. 2011; 10: 3003 -3015. [PubMed] .
- 220. Markman B, Dienstmann R, Tabernero J. Targeting the PI3K/Akt/mTOR pathway--beyond rapalogs. Oncotarget. 2010; 1: 530 -543. [PubMed] .
- 221. Shahbazian D, Parsyan A, Petroulakis E, Hershey J, Sonenberg N. eIF4B controls survival and proliferation and is regulated by proto-oncogenic signaling pathways. Cell Cycle. 2010; 9: 4106 -4109. [PubMed] .
- 222. Back JH and Kim AL. The expanding relevance of nuclear mTOR in carcinogenesis. Cell Cycle. 2011; 10: 3849 -3852. [PubMed] .
- 223. Feng Z, Zhang H, Levine AJ, Jin S. The coordinate regulation of the p53 and mTOR pathways in cells. Proc Natl Acad Sci U S A. 2005; 102: 8204 -8209. [PubMed] .
- 224. Feng Z, Hu W, de Stanchina E, Teresky AK, Jin S, Lowe S, Levine AJ. The regulation of AMPK beta1, TSC2, and PTEN expression by p53: stress, cell and tissue specificity, and the role of these gene products in modulating the IGF-1-AKT-mTOR pathways. Cancer Res. 2007; 67: 3043 -3053. [PubMed] .
- 225. Burger JA and Hoellenriegel J. Phosphoinositide 3'-kinase delta: turning off BCR signaling in Chronic Lymphocytic Leukemia. Oncotarget. 2011; 2: 737 -738. [PubMed] .
- 226. Sahin M. Eph receptor and mTOR pathway crosstalk: implications for cancer. Cell Cycle. 2010; 9: 2053 -2054. [PubMed] .
- 227. Demidenko ZN and Blagosklonny MV. The purpose of the HIF-1/PHD feedback loop: to limit mTOR-induced HIF-1alpha. Cell Cycle. 2011; 10: 1557 -1562. [PubMed] .
- 228. Altman JK, Sassano A, Platanias LC. Targeting mTOR for the treatment of AML. New agents and new directions. Oncotarget. 2011; 2: 510 -517. [PubMed] .
- 229. Murai R, Yoshida Y, Muraguchi T, Nishimoto E, Morioka Y, Kitayama H, Kondoh S, Kawazoe Y, Hiraoka M, Uesugi M, Noda M. A novel screen using the Reck tumor suppressor gene promoter detects both conventional and metastasis-suppressing anticancer drugs. Oncotarget. 2010; 1: 252 -264. [PubMed] .
- 230. Hart JR and Vogt PK. Phosphorylation of AKT: a mutational analysis. Oncotarget. 2011; 2: 467 -476. [PubMed] .
- 231. Weber GL, Parat MO, Binder ZA, Gallia GL, Riggins GJ. Abrogation of PIK3CA or PIK3R1 reduces proliferation, migration, and invasion in glioblastoma multiforme cells. Oncotarget. 2011; 2: 833 -849. [PubMed] .
- 232. Guertin DA and Sabatini DM. Defining the role of mTOR in cancer. Cancer Cell. 2007; 12: 9 -22. [PubMed] .
- 233. Abrams SL, Steelman LS, Shelton JG, Wong EW, Chappell WH, Basecke J, Stivala F, Donia M, Nicoletti F, Libra M, Martelli AM, McCubrey JA. The Raf/MEK/ERK pathway can govern drug resistance, apoptosis and sensitivity to targeted therapy. Cell Cycle. 2010; 9: 1781 -1791. [PubMed] .
- 234. Sacco A, Roccaro A, Ghobrial IM. Role of dual PI3/Akt and mTOR inhibition in Waldenstrom's Macroglobulinemia. Oncotarget. 2010; 1: 578 -582. [PubMed] .
- 235. Renner AG, Creancier L, Dos Santos C, Fialin C, Recher C, Bailly C, Kruczynski A, Payrastre B, Manenti S. A functional link between polo-like kinase 1 and the mammalian target-of-rapamycin pathway? Cell Cycle. 2010; 9: 1690 -1696. [PubMed] .
- 236. Brenneisen P, Wenk J, Wlaschek M, Krieg T, Scharffetter-Kochanek K. Activation of p70 ribosomal protein S6 kinase is an essential step in the DNA damage-dependent signaling pathway responsible for the ultraviolet B-mediated increase in interstitial collagenase (MMP-1) and stromelysin-1 (MMP-3) protein levels in human dermal fibroblasts. J Biol Chem. 2000; 275: 4336 -4344. [PubMed] .
- 237. Stoeltzing O. Dual-targeting of mTOR and HSP90 for cancer therapy: facing oncogenic feed-back-loops and acquired mTOR resistance. Cell Cycle. 2010; 9: 2051 -2052. [PubMed] .
- 238. Garrett JT, Chakrabarty A, Arteaga CL. Will PI3K pathway inhibitors be effective as single agents in patients with cancer? Oncotarget. 2011; 2: 1314 -1321. [PubMed] .
- 239. Zhao L and Vogt PK. Hot-spot mutations in p110alpha of phosphatidylinositol 3-kinase (pI3K): differential interactions with the regulatory subunit p85 and with RAS. Cell Cycle. 2010; 9: 596 -600. [PubMed] .