


Introduction
Endometrial carcinoma (EC) originates in the endometrium [1] and is one of the commonest malignancy of the female genital tract, which ranks fourth in whole malignancies among women [2]. Each year, about 142000 women in the worldwide suffer from endometrial cancer and 42000 women die from this cancer [2]. Though there are some advances in surgery and chemoradiotherapy, many patients have recurrence and distant metastases after these treatments [3]. Key events of mutation in EC have been characterized, but the underlying molecular mechanisms involved in carcinogenesis or identities of tumor suppressor factors are still unclear [4]. Therefore, an understanding of the molecular mechanisms touched upon the pathogenesis of EC must be increased to identify new therapeutic targets and to develop more effective EC treatment strategies.
In cancer research, long non-coding RNAs (lncRNAs) and micro-RNAs (miRNAs) are the most popular noncoding RNAs, and they represent a vital component of tumor biology [5]. lncRNAs are a new class of non-protein coding molecules that are longer than 200 nucleotides. They do not have protein-coding function or encode open reading frames of insufficient lengths [6]. It has been appreciated that lncRNAs contribute to the occurrence and progression of many types of tumours [7,8]. For example, CCAT1 is a lncRNA that was upregulated in lung squamous cell carcinoma (LSCC) and this upregulation contributes to enhanced cell invasion and migration [9]. In EC, lncRNAs including HOTAIR, H19 and SRA were found to be upregulated [10]. On the other hand, miRNAs, small non-coding RNAs of about 22 bp can induce the interference of RNA with complementary mRNA and play a role in silencing mRNA [11]. Thus, miRNAs are considered to be closely associated with the regulation of gene expression, epigenetic dysfunction and cancer initiation [11]. For example, miR-198 can inhibit lung cancer cell proliferation and induce cell apoptosis by targeting FGFR1 [12,13]. Furthermore, many studies over the past ten years have begun to reveal the interaction between mammalian lncRNA and miRNA [14], suggesting that non-coding RNAs may form an lncRNA-miRNA-mRNA interaction network to regulate cancer [15,16]. For instance, lncRNA, H19 preferentially bind to let-7 miRNAs, and the interaction between them is important for maintaining breast cancer stem cell [17]. LncRNA-miRNA interaction also affect EC progression. For example, Guo et al. found that lncRNA-GAS5 promoted PTEN expression by inhibiting miR-103. In the current study, we aim to reveal a novel lncRNA-miRNA interaction in EC.
As a typical epigenetic modification, DNA methylation plays critical roles in the occurrence of cancers [18]. For example, expression of many tumor suppressor genes such as PTEN, MMR were suppresed by DNA hypermethylation and thus cancer progression is promoted [19]. Previous studies revealed that LncRNAs could affect DNA methylation, but also be regulated by histone modification [20]. In colon cancer, for example, DNA methylation was regulated by DNMT1-assocaited lncRNAs, and this affected expression of DACOR1, which activated tumor-supresor pathways in normal cells [21]. In EC, however, limited information can be found regarding association between lncRNA and DNA methylation.
In the present study, we aim to investigate the roles of lncRNA in EC. Specifically, DNA methylation state will be assessed, trying to answer the question whether interplay between lncRNA and DNA methylation contributes to EC progression.
Results
Significant differences existed between EC tissues and paired normal tissues
In order to identify 1000 most variable positions, the ways of multi-dimensional scaling were used in which differential clustering between EC and normal were shown (Figure 1A). The dendrogram of 25998 probes visually showed a clear differentiation between normal and endometrial neoplasm (Figure 1B). The heatmap of 1000 variable CpGs showed high methylation in tumor tissues while low methylation in adjacent normal endometrial tissues (Figure 1C). Figure 1D in which the CpGs number in different regions was showed illustrated the CpG content in shelf was the most significant compared with other regions (island,shore, open sea) and IGR contained the largest number of CpGs contrasted with other gene regions (TSS1500, TSS200, 5 'UTR, 1stExon, Body and 3'UTR).
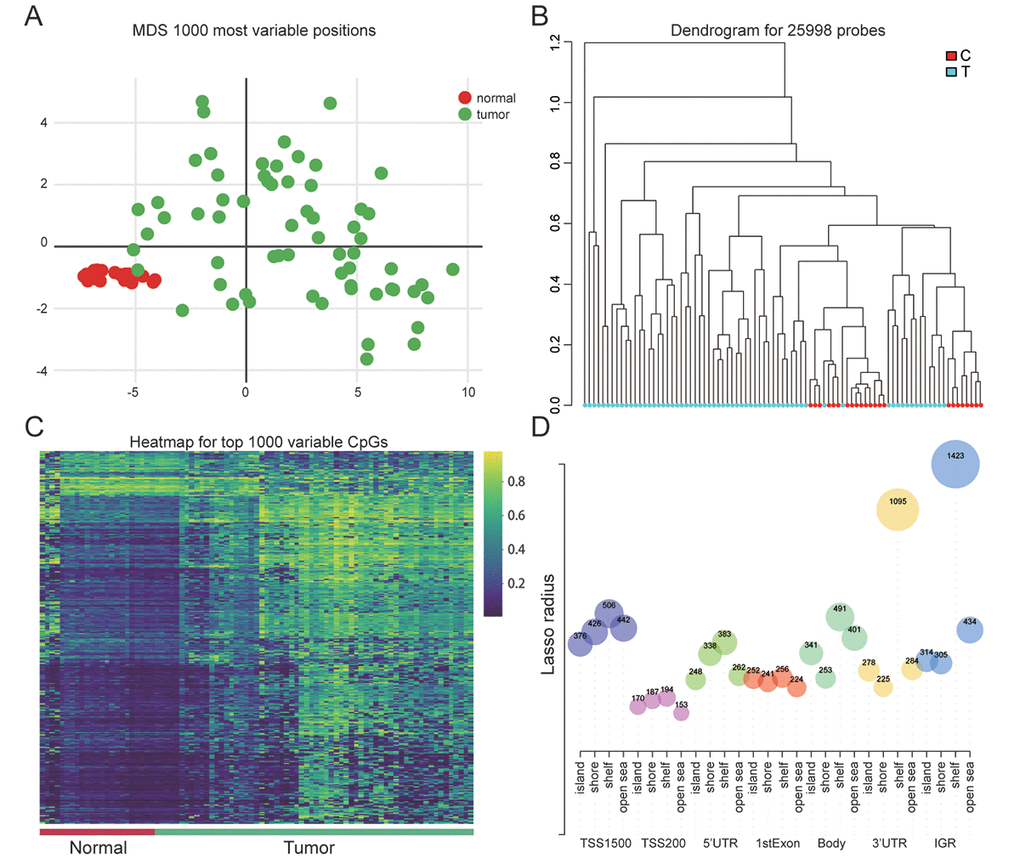
Figure 1. Genome-wide methylation data for endometrial carcinoma. (A) Multi-dimensional scaling (MDS) plot showing differential clustering of normal vs. tumor samples. (B) Dendrogram produced for 25998 probes in normal and tumor samples. (C) Heatmap of top 1000 differentially methylated imprinted CpG sites. (D) The distribution of CpG sites in different gene regions.
Different methylation probes’ distribution in gene fragments
The allocation of different kind of probes at CpG sites externally proved that hyperprobe proportions mainly locates in CpG island, open sea and shore, but not in shelf (Figure 2A). The distribution of probes in different gene fragments regions showed a comprehensive overview about the methylation of gene, and the promoter region’s methylation level inclusive of 5’UTR, TSS1500, TSS200 has reached around 60% (Figure 2B). Combining Figure 2A and Figure 2B, it was found that 1 stExon, 5 ’UTR, body and TSS200 had higher hyperprobe proportions in island, while IGR and TSS1500 had higher hyperprobe proportions in the opensea and shore respectively (Figure 2C).
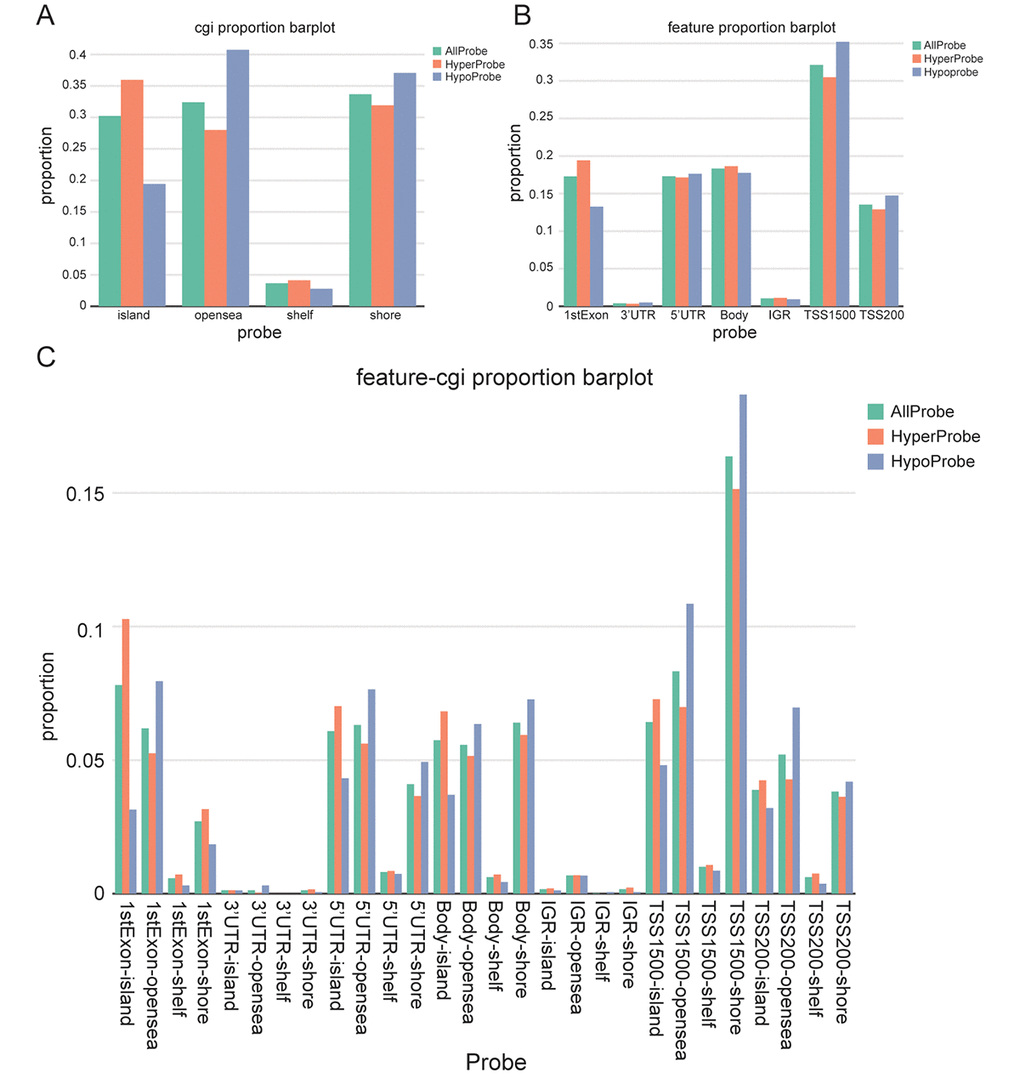
Figure 2. Screening and visualization of differential CpG sites. (A) Distribution of differentially methylated CpG sites according to regions (shores, shelves, islands, and open sea). (B) Distribution of differentially methylated CpG sites according to gene position (1stExon, 3’ UTRs or 5’ UTRs, body, IGR, TSS1500 and TSS200). (C) The distribution of differentially methylated CpG sites by combining CpG regions and gene location.
LncRNAs and TAC1 were hypermethylated in EC
Figure 3A showed the 30 most significant differential methylated genes in EC. Two lncRNAs, LOC 441666 and LOC134466, were found to be hypermethylated in EC tissues compared to paired normal tissues. Previous studies have revealed roles of LOC134466 in several cancers, including epithelial ovarian cancer and small cell lung cancer [9,21,22]. Thus, we chose LOC134466 for further studies. On the other hand, 20 differently methylated genes were screened out based on GSE40032 database (Figure 3B). TAC1 gene was the only gene that was identified as hypermethylated gene from both heatmap. Thus, we raised particular interest in TAC1 gene, wondering how lncRNA regulated TAC1 expression if there was a relationship between them.
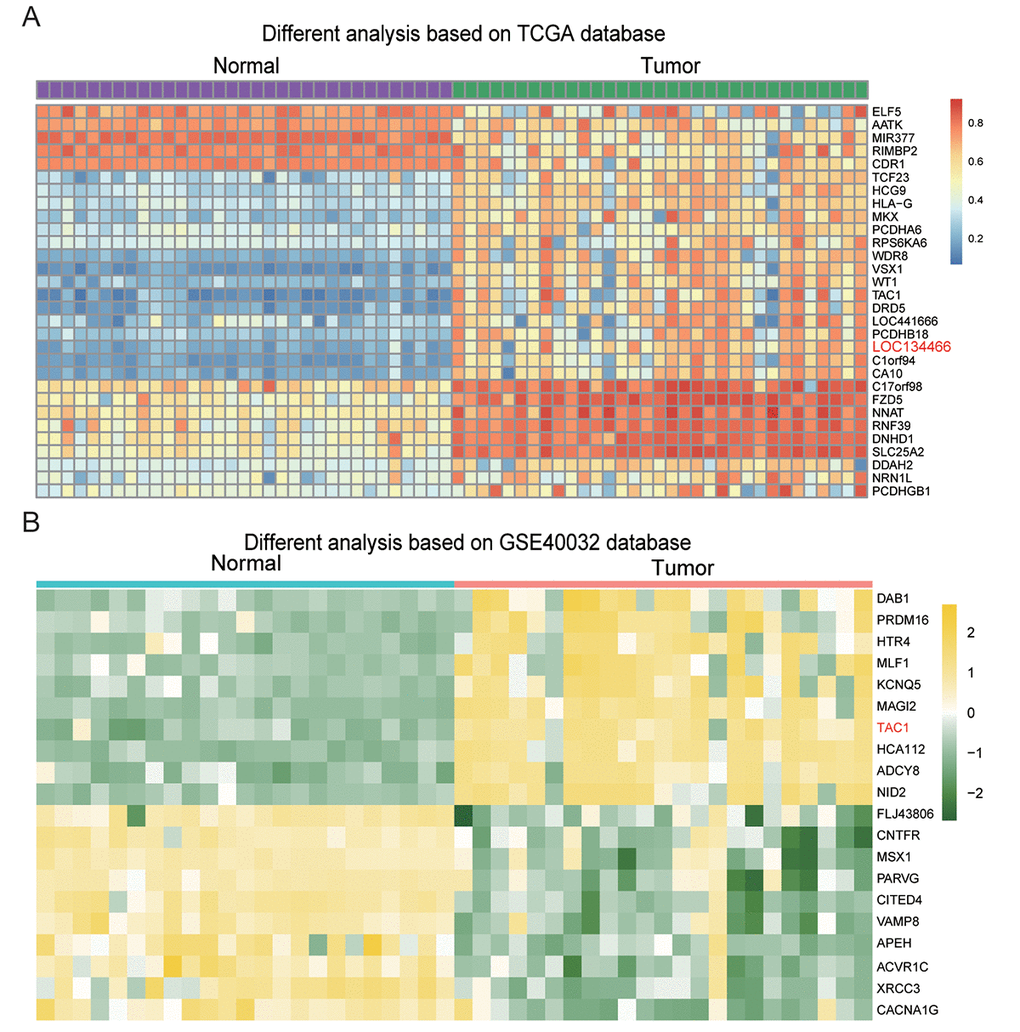
Figure 3. Hypermethylated genes in endometrial carcinoma. (A) The heatmap showed differentially methylated genes in the 20 endometrial carcinoma samples compared to normal adjacent tissues. (B) The heatmap showed differentially methylated genes in endometrial carcinoma compared to paired normal tissues. The results were generated based on GSE40032 database.
CpG analysis of LOC134466 methylation status
As is shown in Figure 4A, LOC134466 methylation in tumor tissues was higher compared to that in paired normal tissues. From the data of boxplot related to 10 CpG sites that were differentially methylated, we found all CpG sites in the tumor group displayed an increased methylation compared with normal tissues. Boxplot for cg04755771, cg05016408, cg06953773, cg07499553, cg11501236, cg3790719, cg15996534, cg18428283, cg19585597 and cg27079680 were showed in Figure 4B-4K which validated that there was a significant methylation in the tumor group compared with the normal group. To conclude, these results suggested that DNA methylation level for LOC134466 was increased obviously in endometrial carcinoma tissues.
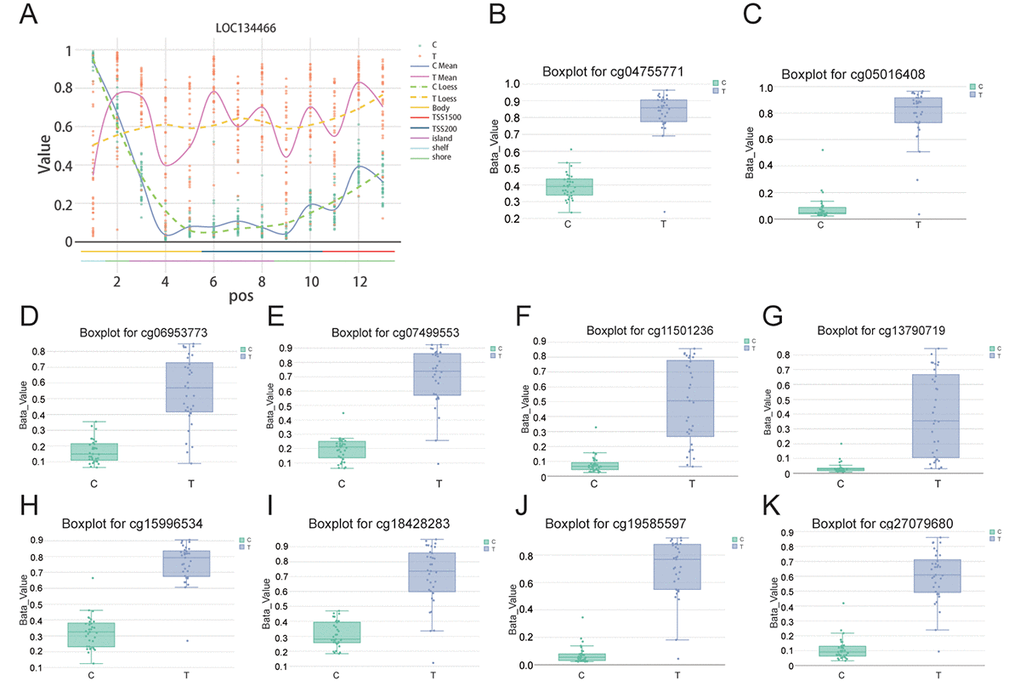
Figure 4. CpG analysis further proved that LOC134466 was hypermethylated in EC. (A) LOC134466 was differentially methylated in tumor tissues compared with paired normal tissues. Boxplot for cg04755771 (B), cg05016408 (C), cg06953773 (D), cg07499553 (E), cg11501236 (F), cg3790719 (G), cg15996534 (H), cg18428283 (I), cg19585597 (J), cg27079680 (K), all above showed significant difference in methylation among normal and tumor patients. Beta value was generated by DMP analysis.
Neuroactive ligand-receptor interaction was remarkably up-regulated
The heatmap of neuroactive ligand-receptor interaction which closely related with endometrial carcinoma showed hypermethylation of associated genes, including TACR3, in tumor tissues and opposite result in normal tissues (Figure 5A). Then on the grounds of GSEA report which was shown in Figure 5B, neuroactive ligand-receptor interaction was discovered to be significantly up-regulated in endometrial carcinoma. And the results of visualized pathway enrichment which was conducted by R and shown as joyplot (Figure 5C) and dotplot (Figure 5D) also revealed the same results.
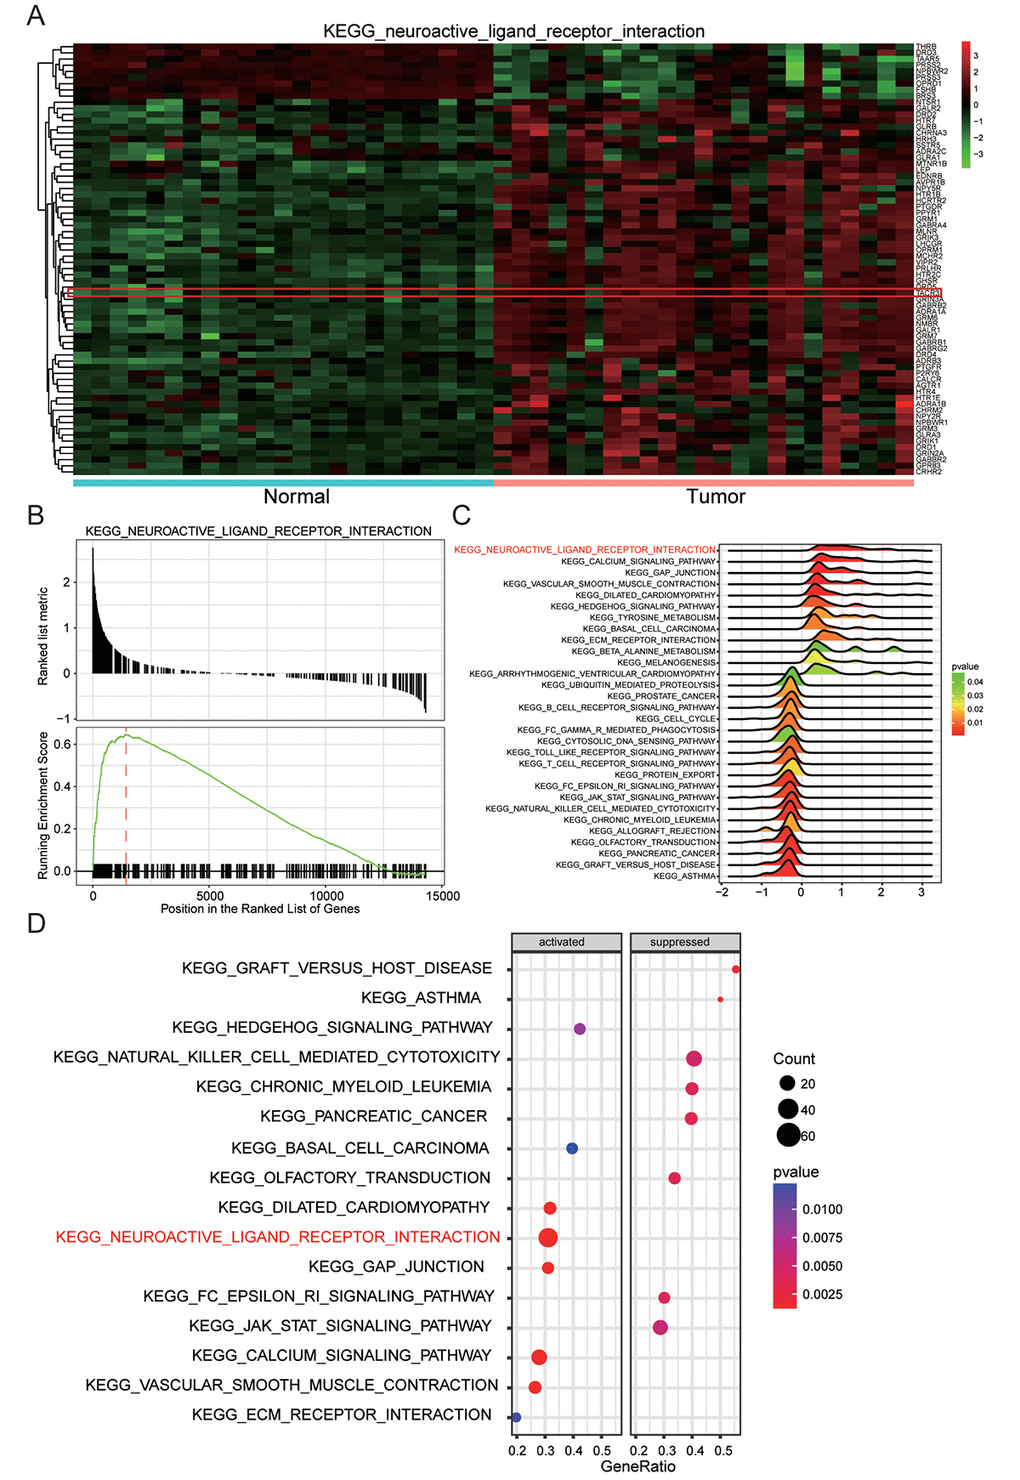
Figure 5. Neuroactive ligand-receptor interaction was remarkably up-regulated. (A) Genes involving neuroactive ligand-receptor interaction, for example TACR3, were generally upregulated. (B) Neuroactive ligand-receptor interaction enriched by KEGG was up-regulated. (C) Joyplot of GSEA showed that neuroactive ligand-receptor interaction was upregulated in EC. (D) Dotplot of GSEA which displayed the activation and inactivation of top 16 significantly enriched signaling pathways showed that neuroactive ligand-receptor interaction was activated in EC.
Hsa-miR-196a-5p formed a bridge connecting LOC134466 and TAC1
Based on TargetScan as well as miRcode database, we sorted out miRNAs that regulated by LOC134466. We also used DIANA Tools to find neuroactive ligand-receptor interaction related miRNAs. As shown in Figure 6A, hsa-miR-196a-5p formed a bridge between LOC134466 and TAC1. Interestingly, hsa-miR-196a-50 was the only miRNA that bound to both LOC134466 and TAC1. Predicted binding sites of LOC134466 and TAC1 on hsa-miR-196a-5p gene were shown in Figure 6B-6C. The following experiments aimed to investigate roles of LOC134466/hsa-miR-196a-5p/TAC1 axis on EC progression.
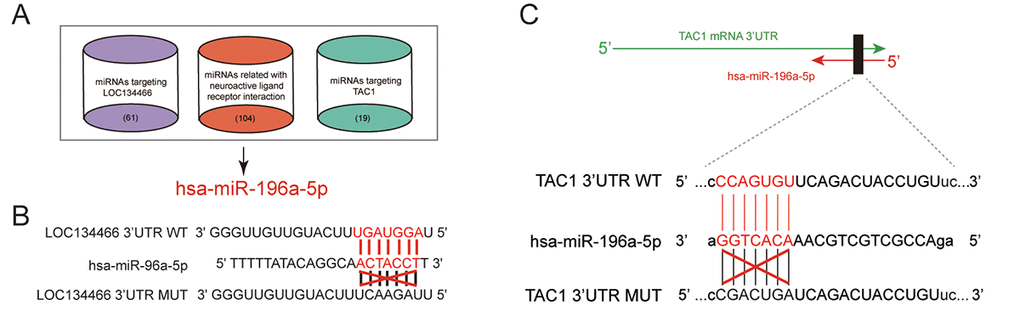
Figure 6. Analysis of lncRNA/miRNA/mRNA axis. (A) Venn diagram indicated that hsa-miR-196a-5p was a bridge between LOC134466 and TAC1. TargetScan and miRcode database were used to sort out miRNAs that interact with both LOC134466 and TAC1. DIANA Tools was used to screen miRNAs that associate with neuroactive ligand-receptor interaction. (B) Predicted binding sites between hsa-miR-196a-5p and LOC134466. (C) Predicted binding sites between hsa-miR-196a-5p and TAC1.
LOC134466 and TAC1 were hypermethylated and downregulated in EC
The results of MSP were shown in Figure 7A. The more distinct white stripe emerged in tumor group indicated that both LOC134466 and TAC1 were hypermethylated in EC. Then the expression of the two genes was examined by qRT-PCR. It was found that both LOC134466 and TAC1 were dramatically silenced in tumor tissues (Figure 7B), indicating that methylation of gene might negatively affect gene expression. Then, same experiments were conducted using normal endometrial cell line (hEEC) and EC cell lines (KLE, Ishikawa, HEC1A). Consistently, LOC134466 and TAC1 were hypermethylated and downregulated in all tumor cell lines (Figure 4C-D). 5-Aza-2-Deoxycytidine concentration screening was done to select the appropriate concentration. The results showed that 5-Aza started to show effects at dose of 5 μM (Figure 7E). To minimize toxicity effects, 5 μM of 5-Aza was used for following studies.
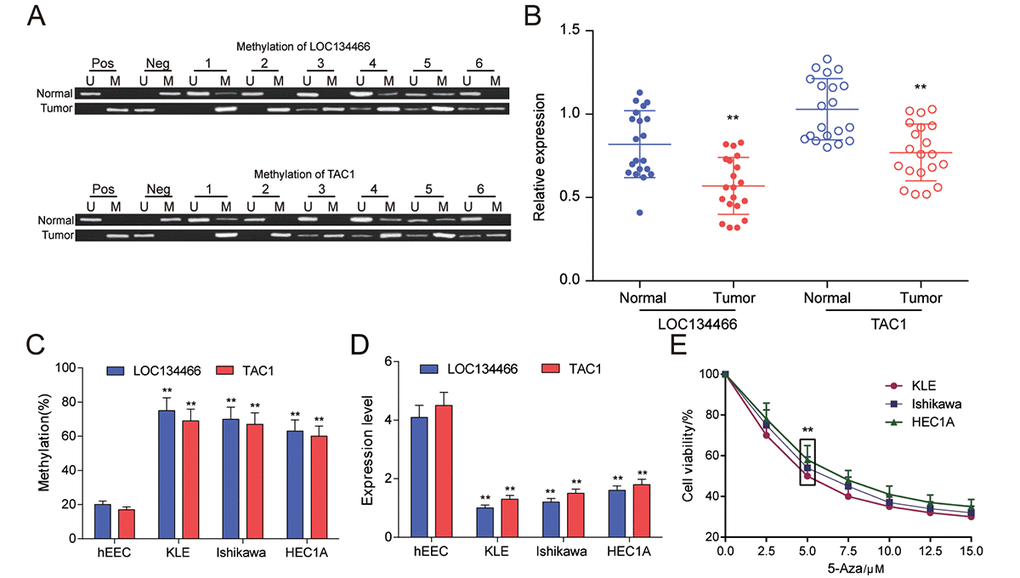
Figure 7. LOC134466 and TAC1 were hypermethylated and lower-expressed in EC tumors. (A) Methylation state of LOC134466 and TAC1 in tumor tissues and paired adjacent tissues. There were 20 paired tissue samples and six representative MSP results were represented. (B) The expressions of LOC134466 and TAC1 in tumor tissues and paired adjacent tissues were assessed by qRT-PCR. The expression of gene was normalized to that of GADPH. (C) DNA methylation level of LOC134466 and TAC1 in normal endometrial cell line (hEEC) and EC tumour cell lines (KLE, Ishikawa and HEC1A) were determined by MSP. (D) The LOC134466 and TAC1 mRNA expressions in cancer cell lines and normal cell line were analyzed by real-time PCR. The expressions of genes were normalized to that of GADPH. (E) Minimum effective dose of 5'-Aza-deoxycytidine was determined by cell viability assay. 5 μM 5’-Aza-deoxycytidine showed a great difference. ** P<0.01 compared to corresponding control (paired normal tissues or hEEC cell line or cell viability without 5’-Aza treatment).
LOC134466 and TAC1 restoration inhibited proliferation and induced apoptosis in EC cells
The decrease of LOC134466 and TAC1 expression in endometrium cancer suggested that the two gens may play a tumor-suppressive role in EC tumorigenesis. To test this notion, we first performed gain-of-function study by overexpressing LOC134466 or TAC1 through DNA vector. Successful restoration of LOC134466 expression (Figure 8A) and TAC1 expression (Figure 9A) were found to inhibit endometrium carcinoma cell proliferation (Figure 8B&9B). Thereafter, we determine how cell proliferation was modulated by LOC134466 and TAC1. Annexin V/PI double staining revealed that overexpression of LOC134466 (Figure 8C-9D) and TAC1 (Figure 9C-9D) induced a reduction in the living cell population (LL phase) and an accompanying increase in the early apoptotic population (LR phase). Moreover, flow cytometer was used to reveal relative cell numbers in each cell-cycle phase (G1, S, G2, and subG1). SubG1 phase refers to some of the debris peaks that existed before the G0 /G1 phase and cells in this phase may be considered as apoptotic cells. A marked increase cells in subG1 was detected when LOC134466 and TAC1 were overexpressed (Figure 8E&9E). Noticeably, 5-Aza treatment produced similar effects on cell apoptosis and proliferation as produced by overexpressing LOC134466 and TAC1. The effects of 5-Aza on gene expression were presented in a supplementary figure (Figure S1). As shown in the figure, demethylation restored normal expression of LOC134466 and TAC1. Taken all together, these results suggested that LOC134466 and TAC1 overexpression contributed to EC progression.
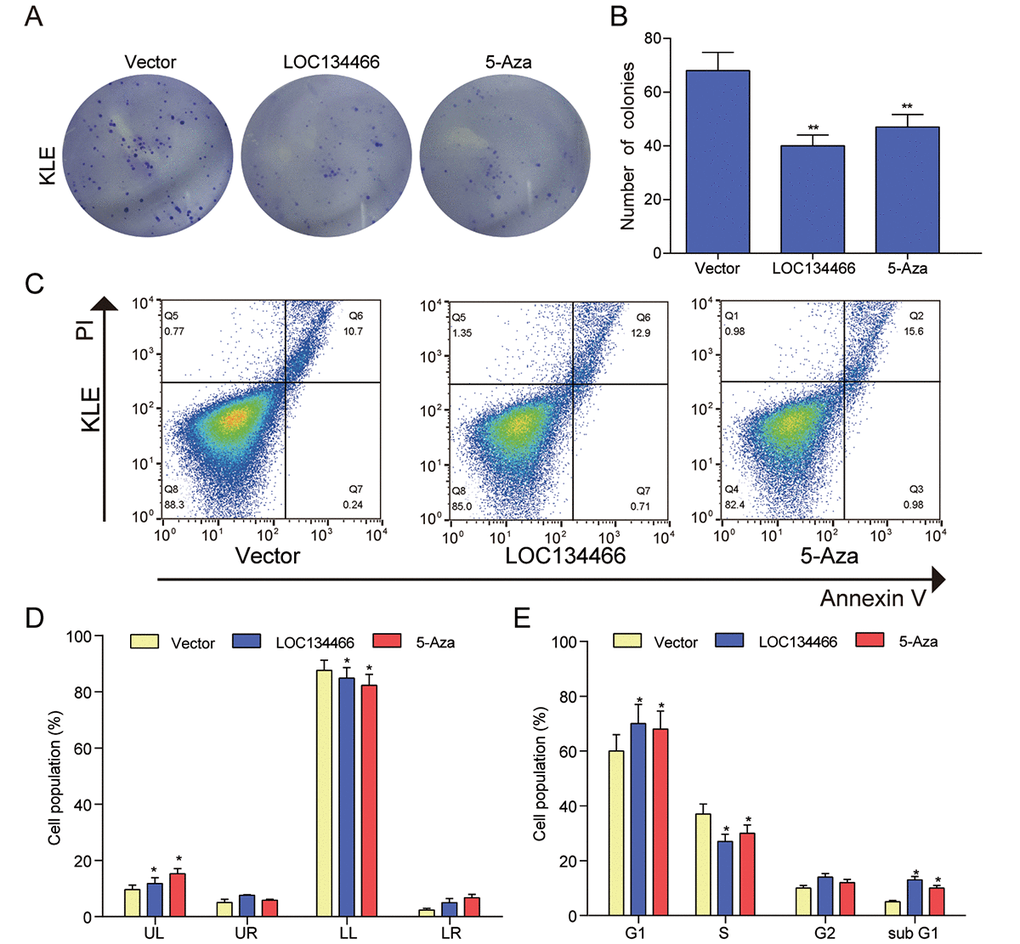
Figure 8. LOC134466 demethylation inhibited KLE cells proliferation, arrested the cell cycle at the G1 phase, and accelerated cell apoptosis. (A-B) Cell proliferation was assessed by Colony formation assay and proliferation was indicated by number of colonies. (C-D) Cell apoptosis was determined by Annexin V/PI double staining and percentages of cells in each phase (LL, viable; LR, early apoptotic; UL and UR, late apoptotic/necrotic cell) were calculated. (E) Relative cell numbers in each cell-cycle phase (G1, S, G2, and subG1) were determined by flow cytometer. *P<0.05, **P<0.01, compared with corresponding control group.
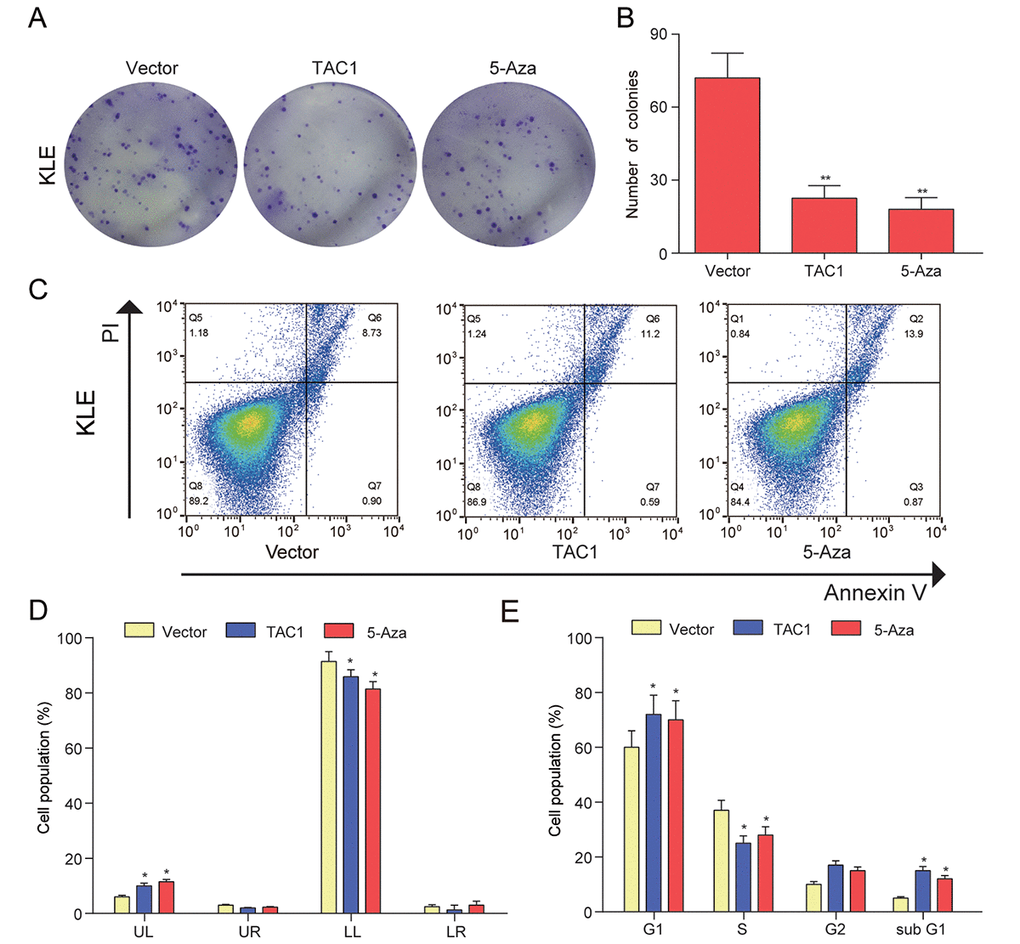
Figure 9. TAC1 demethylation inhibited KLE cells proliferation, arrested the cell cycle at the G1, and accelerated cell apoptosis. (A-B) Colony formation assay was used to assess cell proliferation ability and proliferation was indicated by number of colonies. (C-D) Cell apoptosis was determined by Annexin V/PI double staining and percentages of cells in each phase (LL, viable; LR, early apoptotic; UL and UR, late apoptotic/necrotic cell) were calculated. (E) Relative cell numbers in each cell-cycle phase (G1, S, G2, and subG1) were determined by flow cytometer of the TAC1 and vector control. *P<0.05, **P<0.01, compared with corresponding control group.
Upregulation of LOC134466/hsa-miR-196a-5p/TAC1 axis promoted cell proliferation and inhibited apoptosis
Dual-luciferase reporter gene assay demonstrated that hsa-miR-196a-5p was significantly down-regulated upon LOC134466 overexpression (Figure 10A) and TAC1 was also remarkably decreased through hsa-miR-196a-5p treatment (Figure 10B). Figure 10A-B indicated that LOC134466 promoted TAC1 expression by downregulating hsa-miR-196a-5p. Then, we analyzed the impact of hsa-miR-196a-5p on cells proliferation, apoptosis in KLE cells. It was found that hsa-miR-196a-5p promoted cell proliferation (Figure 10C-10E) and inhibited apoptosis (Figure 10C&10F). Besides, the effect of LOC134466/hsa-mir-196a-5p/TAC1 axis on EC was analyzed by a series of cell experiments. From the perspective of cell proliferation, cell proliferation was significantly reduced in both LOC134466 and TAC1 treatment group, but a totally opposite effect was produced by hsa-miR-196a-5p mimics treatment (Figure 10G-10I). Cell apoptosis, on the other hand, was remarkably decreased with LOC134466 and TAC1 treatments, but increased by hsa-miR-196a-5p inhibit treatment (Figure 10G&10J). To conclude, LOC134466/hsa-miR-196a-5p/TAC1 axis played important roles in the pathogenesis of EC.
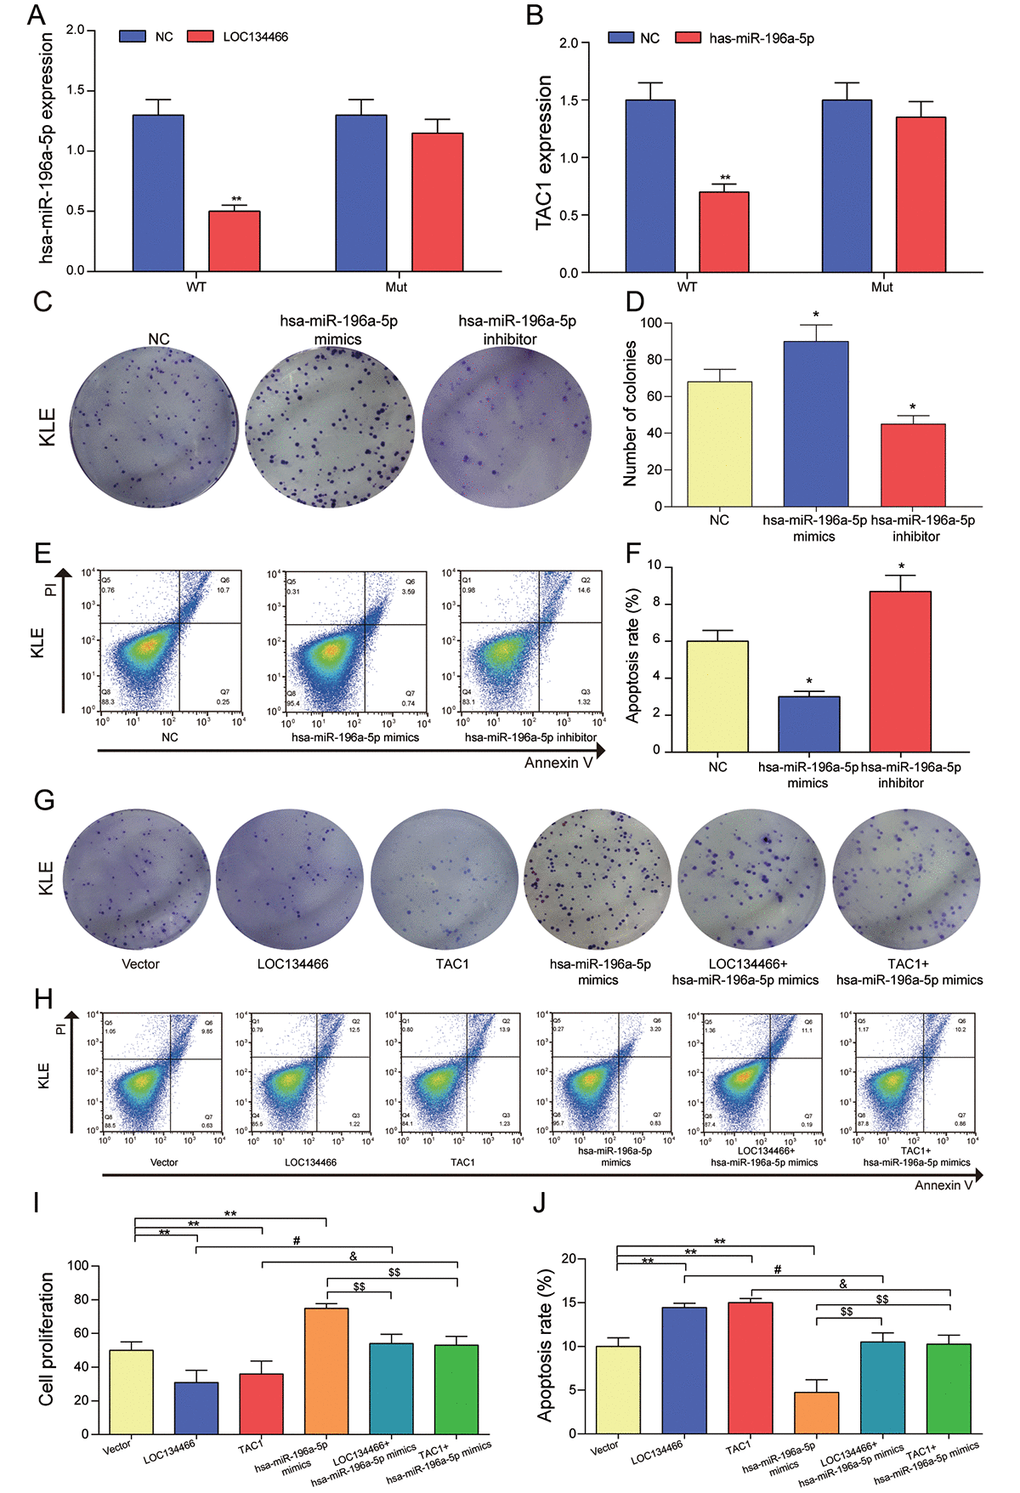
Figure 10. The relationship among LOC134466, hsa-miR-196a-5p and TAC1, and the effects of hsa-miR-196a-5p on cell proliferation and apoptosis. (A) The effect of LOC134466 on hsa-miR-196a-5p expression was determined by dual-luciferase reporter gene assay. (B) The effects of hsa-miR-196a-5p on TAC1 expression was determined by dual-luciferase reporter gene assay. (C-D) The effects of hsa-miR-196a-5p on cell proliferation were assessed by colony formation assay. (E-F) The effects of hsa-miR-196a-5p on cell apoptosis was assessed by Annexin V/PI double staining and apoptosis rates were calculated. (G) The effect of LOC134466/hsa-mir-196a-5p/TAC1 axis on EC was analyzed by plate clone formation assay. (H-J) The roles of LOC134466/hsa-miR-196a-5p/TAC1 axis on cell apoptosis and cell proliferation were determined by Annexin V/PI double staining and colony formation assay respectively. *P<0.05, **P<0.01, compared with vector group. #P<0.05, compared with LOC134466 group, &P<0.05 compared with TAC1 group, $$P<0.01 compared with hsa-miR-196a-5p group.
LOC134466/hsa-miR-196a-5p/TAC1 axis affected EC carcinogenesis through activating neuroactive ligand-receptor interaction
Compared with the vector control, enhanced expression of LOC134466 and TAC1 caused a sharp decrease of several known neuroactive ligand-receptor interaction targets, including TACR1, TACR2 and TACR3 in KLE cells (Figure 11A-11B). Figure 11C illustrated that TCA1 directly associate with TACR1, TACR2 and TACR3. As mentioned previously, TAR3 was overexpressed in EC tissues (Figure 5A). So, we hypothesized that LOC134466/hsa-miR-196a-5p/TAC1 axis performed tumor suppressive function through activating neuroactive ligand-receptor interaction (Figure 10D).
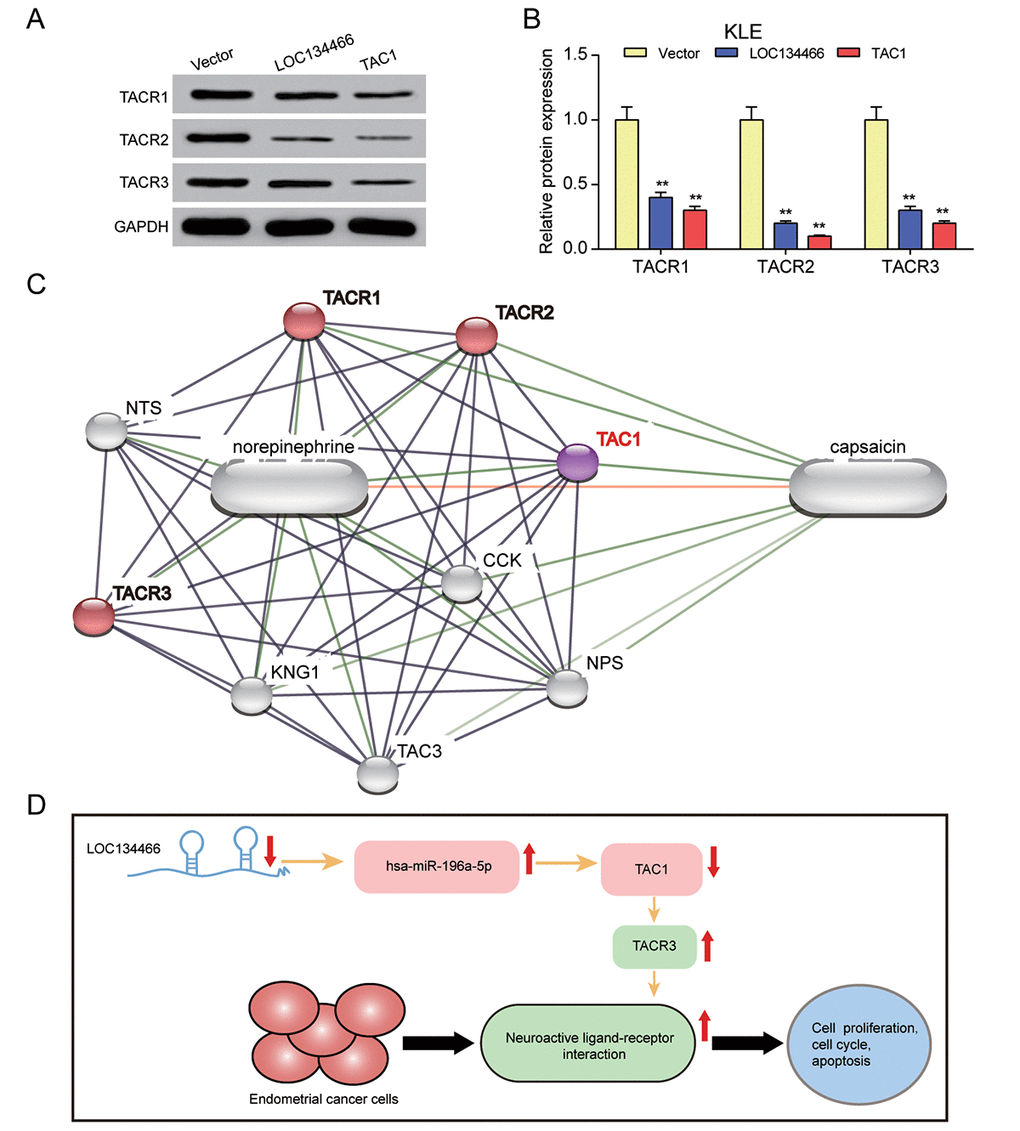
Figure 11. LOC134466/hsa-miR-196a-5p/TAC1 axis affected EC carcinogenesis through neuroactive ligand-receptor interaction. (A-B) The effects of LOC134466 or TAC1 overexpression on TACR1, TACR2 and TACR3 expression were determined by western blot. Protein expression was normalized to that of GADPH. (C) The TAC1 network was generated by Stich website. The neuroactive ligand-receptor interaction was marked red. (D) A model of LOC134466/hsa-miR-196a-5p/TAC1 axis action on EC development. ** P<0.01 compared with corresponding control group.
LOC134466 and TAC1 suppressed tumor growth in vivo
To verify the curative effect of different treatments in EC, Tumor Xenograft experiment was employed. The results of Xenograft assay showed in Figure 12A-12C revealed that the tumor size and weight were suppressed in LOC134466 group, TAC1 group and 5-Aza treatment group.
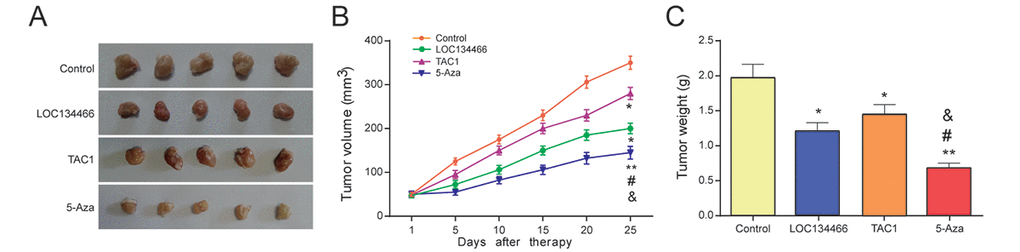
Figure 12. LOC134466 and TAC1 suppressed tumor growth in vivo. (A-C) Tumor growth was assessed by tumor volume and tumor weight. Five-week nude mice were injected with KLE cells (1× 10⁶/200 μl PBS) subcutaneously. * P<0.05, ** P<0.01, compared with control group, #P<0.05, compared with LOC134466 group, &P<0.05 compared with TAC1 group.
Discussion
The results of bioinformatic analysis and in vitro studies together revealed a novel regulatory axis, LOC134466/hsa-miR-196a-5p/TAC1 axis that play an important tole in EC development. Moreover,we found that both LOC134466 and its target gene TAC1 was hypermethylated in EC tumor tissues. Upregulating LOC134466 and TAC1, and 5-Aza treatment sucessfully arrested tumour progression in both in vitro and in vivo studies. All together, LOC134466/hsa-miR-196a-5p/TAC1 axis may be an important therapeutic targets for EC.
LOC134466 is also known as ZNF300P1, a pseudogene of the human zinc finger protein ZNF300 [23]. Notably, LOC134466 has been recently proved to be a novel methylated marker [24] and many researches have shown that LOC134466 is commonly silenced by methylation in several cancer types such as epithelial ovarian cancer and small cell lung cancer [23,24]. These research results potentially indicated that LOC134466 methylation may be a major factor in carcinogenesis. On the other hand, TAC1 is a single-copy gene with 7 exons [25], which encodes neuroendocrine gastrointestinal peptides including substance P (SP) and neurokinin A [26]. Both substance P (SP) and neurokinin A play vital roles in cancer development [25,27,28]. In order to verify the role of LOC134466 and TAC1 in tumorigenesis of EC, we constructed LOC134466 and TAC1 overexpressed KLE cell line models through DNA vector. The results showed that LOC134466 and TAC1 inhibited EC cells proliferation and accelerated apoptosis. Via methylation-specific PCR (MSP), it was found that both LOC134466 and TAC1 were hypermethylated in the EC tissues and hypermethylation resulted in their low expression. Development of endometrial carcinoma was significantly suprresed by 5-Aza treatment. To conclude, both LOC134466 and TCA1 played important roles in EC development.
Many studies over the past ten years have begun to reveal the interaction between lncRNA-miRNA-mRNA [14,16,29]. However, little research has reported the structural and functional relationship between LOC134466 and TCA1. Thus, it’s very essential to figure out whether LOC134466 and TCA1 are functionally related. In this research, we reported how LOC134466 and TAC1 interact for the first time. The results showed that hsa-miR-196a-5p was a bridge between LOC134466 and TAC1. Based on the further analysis, we finally confirmed that the LOC134466 / hsa-miR-196a-5p / TAC1 axis regulated endometrial carcinoma by TACR3. It should be emphasized that our research has revealed that TACR3 which was recently found to be associated with gingival oral squamous cell carcinoma [30,31] also played significant roles in EC. Therefore, we can reasonably speculate that TACR3 is a key impact factor of many cancers.
TACR3 can activate neuroactive ligand-receptor interaction. Recently, some researches have shown that neuroactive ligand-receptor interaction, a kind of G protein-coupled receptor-mediated signaling pathway [32], is associated with cancer progression such as bladder cancer and pancreatic cancer [32–34]. As the first gate, the high activity of GPCRs may lead to transportation of externally unfavorable signals such as glucose, insulin, or carcinogens into a cell which may induce a series of cascade reactions related to carcinogenesis [32]. Given the heatmap and GSEA report, we found that in EC, the neuroactive ligand-receptor interaction was also significantly up-regulated. According to these results, apparently, neuroactive ligand-receptor interaction plays an important role in EC carcinogenesis.
In conclusion, our research has revealed that LOC134466 methylation was directly related to tumorigenesis of EC, but it is worthy of further study on the relationship between LOC134466 methylation and other cancers. Furthermore, we also identified its internal mechanism that could be summarized as a novel regulatory axis, LOC134466 / hsa-miR-196a-5p / TAC1, which activated neuroactive ligand-receptor interaction through activating TACR3 in EC. However, whether the LOC134466 / hsa-miR-196a-5p / TAC1 axis we built exists in other kinds of cancers and how it plays roles respectively need to be further explored.
Materials and Methods
Bioinformatic analysis
As a kind of functional pipeline, the Chip Analysis Methylation Pipeline (ChAMP) package not only combines the available 450k analysis methods at present, but also provides its own original functionality. On the other hand, Gene set enrichment analysis (GSEA) is used to judge whether a set of genes that are priori defined exhibits statistically significant, consistent differences between two biological states. In this study, we detected gene methylation by R through ChAMP package. Then, an ordered list of all genes was generated by GSEA according to their correlation with endometrial carcinoma. The significant difference was observed towards high- and low-activity related pathways between endometrial cancer group and normal group.
Tissue samples and cell culture
20 endometrial tissue samples were obtained from endometrial carcinoma patients who presented at Huangjiahu Hospital of Hubei University of Chinese Medicine. The study was performed in accordance with human subject guidelines and was approved by the Scientific and Ethical Committee of Huangjiahu Hospital of Hubei University of Chinese Medicine. All subjects gave written informed consent.
The cell lines of endometrial cancer, KLE, Ishikawa, HEC1A, and the normal endometrial cell line hEEC were originally from BeNa Culture Collection (Beijing, China). Cultured the KLE, Ishikawa, and hEEC cells in 90% EMEM (AmyJet Scientific, Wuhan, China), which was replenished with 10% fetal bovine serum (FBS; Thermo Fisher Scientific, Waltham, MA, USA). At the same time, cultured the HEC1A cells in 90% McCoy’s 5a medium (Thermo Fisher Scientific) replenished with 10% FBS. All cells were grown at 37 °C, 5% CO2.
Methylation-Specific PCR (MSP)
It has been previously described and shown in Table 1 about what the methylation and unmethylation-sensitive primers of LOC134466 and TAC1 were used in the study. In a 25 μl reaction mixture, we amplify 1.5 μl of bisulfite-converted DNA. The reaction mixture contained 200 μM dNTPs, 10X reaction buffer, 2.5 mM MgCL2, 10 pM forward and reverse primers, as well as 1 U of FastTaq (Roche, Basel, Switzerland). Bisulfite-modified DNA was then amplified with two primer sets that differentiate methylated from unmethylated DNA. Meanwhile, we performed Hot-start PCR at an annealing temperature of 60 °C using hot-start Taq DNA polymerase (Thermo Fisher Scientific). Cases in which methylated alleles were present were repeated once again for confirmation.
Table 1. Sequences of MSP primers.
| Name | Sequence |
| Methylation | |
| LOC134466 forward | 5' TACGAGGTTAGGAGTTC 3' |
| LOC134466 reverse | 5' AATAACACGATCTCGA 3' |
| TAC1 forward | 5' GGGGCGTTAGATTTGTAGAC 3' |
| TAC1 reverse | 5' ACGATAACTCGTCGATACCC3' |
| No Methylation | |
| LOC134466 forward | 5' TACGAGGTTAGGAGTTC 3' |
| LOC134466 reverse | 5' AATAACACGATCTCGA 3' |
| TAC1 forward | 5' GAGGGGGTGTTAGATTTGTAGAT 3' |
| TAC1 reverse | 5' AAAACAATAACTCATCAATACCC 3' |
The isolation of RNA and quantitative real time PCR
We used TRIzol reagent (Invitrogen, Carlsbad, USA) to extract the total RNA endometrial carcinoma tissues and corresponding healthy tissues. The SuperScriptTM II Reverse Transcriptase Kit (Invitrogen) was used to reversely transcript of 5 μg of total RNA. SYBRGreen reagent (Thermo Fisher Scientific) was used for quantitative real time polymerase chain reaction (qRT-PCR). For qRT-PCR, primers that were used to estimate the expression of total LOC134466 and TAC1 were listed in Table 2. The expression of these genes was normalized to that of GADPH. Besides, subsequent to the real-time RT-PCR, we examined the dissociation reaction diagram and then verified the specificity of the PCR. It is worth conducting all the experiments in triplicate.
Table 2. Sequences of primers for qPCR.
| Name | Sequence |
| LOC134466 Forward | 5’-AGTACGGGGTCGTTATTTTGAGATTTT-3’ |
| LOC134466 Reverse | 5’-CGGAATGTGGATCCCTTCICAATCACTATAATACAA-3’ |
| TAC1 Forward | 5’-TGGTCCGACTGGTACGACAG-3’ |
| TAC1 Reverse | 5’-CTGCAGAAGATGCTCAAAGGG-3’ |
5-Aza treatment studies
Use MTT assay to evaluate the cytotoxicity of 5-Aza-2-Deoxycytidine. Concisely, each well of the 96-well plate contained 50 μL of RPMI medium was seeded with 5×10⁴ cells (KLE, Ishikawa, HEC1A). 24 h later, added 5-Aza-2-Deoxycytidine of various concentrations (0, 2.5, 5, 7.5, 10, 12.5 and 15 μM) and 50 μL of MTT (5 mg/mL stock solution)into each well and after 48 h. Incubated the plates for an additional 4 h. Finally, discard the medium and dissolve the substance formed in the cells by 50 μL DMSO. At last, measure the optical density at 570 nm by Multiskan™ Sky microplate spectrophotometer (Thermo Fisher Scientific). To evaluate the effects of 5-Aza on gene expression, endometrial cancer cells were seeded on 10 cm plate and after 24 hours treated with 2 μmol/L of the DNA demethylating agent 5-Aza-2’-deoxycytidine (Sigma-Aldrich, St. Louis, MO, USA) for 72 h. Gene expression was assessed by qRT-PCR.
Cell transfection
To increase LOC134466 and TAC1 expression, LOC134466 expression vector and TAC1 expression vector were purchased from Biovector (Beijing China). For hsa-miR-196a-5p treatment, use Lipofectamine 3000 reagent (Thermo Fisher Scientific) to transfect cells separately with hsa-miR-196a-5p mimics in the light of the manufacturer’s protocol.
Colony formation assay
Seeded the transfected cells in 96-well plates at the density of 5 × 10³ cells /well, and incubated the plates for 48 hours. After incubation, the resultant colonies were stained by 0.2% crystal violet and those larger than 1 mm in diameter were counted under the microscope. The experiments were repeated in triplicate and cell density was indirectly assessed by the absorbance at 570 nm.
Cell cycle assay
For cell cycle analysis, 2×10⁵ cells were plated in a 6-well culture plate and grown for 24 h. Cells were then incubated with 1 mM thymidine (Sigma-Aldrich) for 24 h to synchronize cells at the G1/S boundary. The cells were then treated with serum-deprived culture medium for another 24 h. Next, the cells were trypsinized, then washed twice using cold PBS and fixed with cold 70% ethanol at -20°C overnight. After an overnight stay, washed the cells twice with PBS and incubated them with 10 mg/ml RNase A and 400 mg/ml propidium iodide (PI; MedChemExpress, Shanghai, China) in PBS at room temperature for 30 mins.
Flow cytometry
5×10⁵ cells of each well were cultured in 12-well plates for 48 hours at 37 °C in a 5% CO2 atmosphere. And after fixed with 70% ethanol for 72 h and stained by 25 μg/mL PI in fluorescence-activated cell sorting buffer (PBS containing 0.1% of bovine serum albumin, 0.05% of Triton X-100, and 50 μg /mL RNaseA), incubated cells for 30 min in dark environment at room temperature. Then used a Attune NxT Flow Cytometer (Thermo Fisher Scientific) to assess relative cell numbers in each cell-cycle phase (G1, S, G2, and subG1). Each experiment was performed in triplicate.
Dual-luciferase reporter gene assay
KLE cells were used to perform the dual-luciferase reporter assay. For hsa-miR-196a-5p reporter assay, cells were co-transfected with 250 ng of LOC134466 expression vector or control. For TAC1 reporter assay, cells were co-transfected with 250 ng of hsa-miR-196a-5p expression vector or control. According to the manufacturer’s protocol, we used the Dual-Luciferase Reporter Assay System (Biomart, Beijing, China) to measure luciferase activity. For each transfection, three replicates were performed to get the activity of luciferase.
Western blot
Washed cells twice with PBS (Thermo Fisher Scientific), and then collected and lysed them with RIPA buffer (Beyotime, Shanghai, China). The protein concentrations in the cell lysates were measured using a BCA Protein Assay Kit (Thermo Fisher Scientific). Separated the protein samples in 12% SDS-PAGE gel, and then samples were transferred onto the PVDF membranes (Thermo Fisher Scientific). Blocked the membranes with 5% nonfat dry milk and probed them with primary antibodies (anti-ZNF300P1, Sigma; anti-TAC1, Thermo Fisher Scientific). After being incubated overnight at 4 °C, the membranes were washed and incubated with a secondary peroxidase conjugated antibody for 1 h. Antibody binding was detected using Amersham ECL detection reagents (GE Healthcare, Little Chalfont, Buckinghamshire, UK) via X films. All blots were stripped and reprobed with polyclonal anti-GADPH antibody to ascertain equal loading of proteins. Repeated each experiment for three times.
Tumor xenograft
Five-week nude mice at the same condition were arranged randomly, with five in each group, including control group, LOC134466 group, TAC1 group and 5-Aza group. Then injected KLE cells (1× 10⁶/200 μl PBS) subcutaneously into the nude mice at a single site. Used calipers to measure the size of tumor weekly. When the average tumor size reached about 100 mm3, injected 5-Aza-dC (5 mg/kg) and measured the tumor volumes and tumor weights every 5 days. 25 days after simultaneous administration, all mice were sacrificed and whole proteins were isolated from the xenografted tissues of the mice for western blot analysis and immunohistochemical analysis. The Animal Care and Use Committee of Huangjiahu Hospital of Hubei University of Chinese Medicine approved all these experiments. And we obeyed the institutional ethics guidelines when we done the animal experiments.
Statistical analysis
Use GraphPad Prism 6.0 to conduct statistical analyses. Present all the values as means ± SD and we used the Bonferroni correction method to correct the multiple testing in order to control the false discovery rate (FDR). Student t-test was performed to compared between two groups and One-way ANOVA was used for comparison among multiple groups. The level of significance was assigned at p-value < 0.05.
Declarations
Ethics approval and consent to participate:This study was authorized by Huangjiahu Hospital of Hubei University of Chinese Medicine, and obtained written informed consents from all the participants.
Availability of data and material: All data generated or analyzed during this study are included in this published article.
Supplementary Materials
Author Contributions
Hai Xu, Yuan Sun: critical revision of the manuscript; Yuan Sun, Lili Qin: substantial contribution to the conception and design of the work, Hai Xu, Xin Xu: manuscript drafting; Hai Xu, Zhen Ma: acquisition, analysis, and interpretation of the data; Baoping Luo: revising the manuscript critically, final approval of the version to be published. All authors have read and approved the final article.
Conflicts of Interest
The authors confirm that there are no conflicts of interest.
Funding
This study was supported by the National Science and Technology Major Project of the Ministry of Science and Technology of China (Grant Number:2018ZX10303502); And Hubei Natural Science Foundation (Grant Number: 2018cf808).
References
- 1. Kandoth C, Schultz N, Cherniack AD, Akbani R, Liu Y, Shen H, Robertson AG, Pashtan I, Shen R, Benz CC, Yau C, Laird PW, Ding L, et al, and Cancer Genome Atlas Research Network. Integrated genomic characterization of endometrial carcinoma. Nature. 2013; 497:67–73. https://doi.org/10.1038/nature12113 [PubMed]
- 2. Bąkiewicz A, Michalak J, Sporny S. Immunoexpression and clinical significance of the PTEN and MLH1 proteins in endometrial carcinomas. Pol J Pathol. 2010; 61:185–91. [PubMed]
- 3. Xin W, Liu X, Ding J, Zhao J, Zhou Y, Wu Q, Hua K. Long non-coding RNA derived miR-205-5p modulates human endometrial cancer by targeting PTEN. Am J Transl Res. 2015; 7:2433–41. [PubMed]
- 4. Zhao Y, Yang Y, Trovik J, Sun K, Zhou L, Jiang P, Lau TS, Hoivik EA, Salvesen HB, Sun H, Wang H. A novel wnt regulatory axis in endometrioid endometrial cancer. Cancer Res. 2014; 74:5103–17. https://doi.org/10.1158/0008-5472.CAN-14-0427 [PubMed]
- 5. Huang YK, Yu JC. Circulating microRNAs and long non-coding RNAs in gastric cancer diagnosis: an update and review. World J Gastroenterol. 2015; 21:9863–86. https://doi.org/10.3748/wjg.v21.i34.9863 [PubMed]
- 6. Wang D, Wang D, Wang N, Long Z, Ren X. Long non-coding RNA BANCR promotes endometrial cancer cell proliferation and invasion by regulating MMP2 and MMP1 via ERK/MAPK signaling pathway. Cell Physiol Biochem. 2016; 40:644–56. https://doi.org/10.1159/000452577 [PubMed]
- 7. Gupta RA, Shah N, Wang KC, Kim J, Horlings HM, Wong DJ, Tsai MC, Hung T, Argani P, Rinn JL, Wang Y, Brzoska P, Kong B, et al. Long non-coding RNA HOTAIR reprograms chromatin state to promote cancer metastasis. Nature. 2010; 464:1071–76. https://doi.org/10.1038/nature08975 [PubMed]
- 8. Aicardi J, Goutières F, Challamel MJ, Gilly R. [Childhood cerebral hemiplegia. Semeiology, etiology, and prognosis]. Rev Electroencephalogr Neurophysiol Clin. 1972; 2:95–100. https://doi.org/10.1016/S0370-4475(72)80008-X [PubMed]
- 9. Luo X, Qiu Y, Jiang Y, Chen F, Jiang L, Zhou Y, Dan H, Zeng X, Lei YL, Chen Q. Long non-coding RNA implicated in the invasion and metastasis of head and neck cancer: possible function and mechanisms. Mol Cancer. 2018; 17:14. https://doi.org/10.1186/s12943-018-0763-7 [PubMed]
- 10. Smolle MA, Bullock MD, Ling H, Pichler M, Haybaeck J. Long non-coding RNAs in endometrial carcinoma. Int J Mol Sci. 2015; 16:26463–72. https://doi.org/10.3390/ijms161125962 [PubMed]
- 11. Banno K, Yanokura M, Kisu I, Yamagami W, Susumu N, Aoki D. MicroRNAs in endometrial cancer. Int J Clin Oncol. 2013; 18:186–92. https://doi.org/10.1007/s10147-013-0526-9 [PubMed]
- 12. Zhai H, Fesler A, Ba Y, Wu S, Ju J. Inhibition of colorectal cancer stem cell survival and invasive potential by hsa-miR-140-5p mediated suppression of Smad2 and autophagy. Oncotarget. 2015; 6:19735–46. https://doi.org/10.18632/oncotarget.3771 [PubMed]
- 13. Zhang ZY, Fu SL, Xu SQ, Zhou X, Liu XS, Xu YJ, Zhao JP, Wei S. By downregulating Ku80, hsa-miR-526b suppresses non-small cell lung cancer. Oncotarget. 2015; 6:1462–77. https://doi.org/10.18632/oncotarget.2808 [PubMed]
- 14. Yoon JH, Abdelmohsen K, Gorospe M. Functional interactions among microRNAs and long noncoding RNAs. Semin Cell Dev Biol. 2014; 34:9–14. https://doi.org/10.1016/j.semcdb.2014.05.015 [PubMed]
- 15. Fang XN, Yin M, Li H, Liang C, Xu C, Yang GW, Zhang HX. Comprehensive analysis of competitive endogenous RNAs network associated with head and neck squamous cell carcinoma. Sci Rep. 2018; 8:10544. https://doi.org/10.1038/s41598-018-28957-y [PubMed]
- 16. Zhang Y, Li Y, Wang Q, Zhang X, Wang D, Tang HC, Meng X, Ding X. Identification of an lncRNA‑miRNA‑mRNA interaction mechanism in breast cancer based on bioinformatic analysis. Mol Med Rep. 2017; 16:5113–20. https://doi.org/10.3892/mmr.2017.7304 [PubMed]
- 17. Chan JJ, Tay Y. Noncoding RNA:RNA regulatory networks in cancer. Int J Mol Sci. 2018; 19:E1310. https://doi.org/10.3390/ijms19051310 [PubMed]
- 18. Jones PA, Baylin SB. The fundamental role of epigenetic events in cancer. Nat Rev Genet. 2002; 3:415–28. https://doi.org/10.1038/nrg816 [PubMed]
- 19. Hu Q, Yu L, Liao QP. [Methylation of matrix metalloproteinases-2 promoter in endometrial cancer invasion]. Beijing Da Xue Xue Bao. 2012; 44:911–15. [PubMed]
- 20. Schmitz SU, Grote P, Herrmann BG. Mechanisms of long noncoding RNA function in development and disease. Cell Mol Life Sci. 2016; 73:2491–509. https://doi.org/10.1007/s00018-016-2174-5 [PubMed]
- 21. Merry CR, Forrest ME, Sabers JN, Beard L, Gao XH, Hatzoglou M, Jackson MW, Wang Z, Markowitz SD, Khalil AM. DNMT1-associated long non-coding RNAs regulate global gene expression and DNA methylation in colon cancer. Hum Mol Genet. 2015; 24:6240–53. https://doi.org/10.1093/hmg/ddv343 [PubMed]
- 22. Baldys-Waligorska A, Pour A, Moriarty CM, Dowd F. The effect of calcium and cyclic AMP on amylase release in digitonin-permeabilized parotid gland cells. Biochim Biophys Acta. 1987; 929:190–96. https://doi.org/10.1016/0167-4889(87)90175-3 [PubMed]
- 23. Gloss B, Moran-Jones K, Lin V, Gonzalez M, Scurry J, Hacker NF, Sutherland RL, Clark SJ, Samimi G. ZNF300P1 encodes a lincRNA that regulates cell polarity and is epigenetically silenced in type II epithelial ovarian cancer. Mol Cancer. 2014; 13:3. https://doi.org/10.1186/1476-4598-13-3 [PubMed]
- 24. Gloss BS, Patterson KI, Barton CA, Gonzalez M, Scurry JP, Hacker NF, Sutherland RL, O’Brien PM, Clark SJ. Integrative genome-wide expression and promoter DNA methylation profiling identifies a potential novel panel of ovarian cancer epigenetic biomarkers. Cancer Lett. 2012; 318:76–85. https://doi.org/10.1016/j.canlet.2011.12.003 [PubMed]
- 25. Reddy BY, Greco SJ, Patel PS, Trzaska KA, Rameshwar P. RE-1-silencing transcription factor shows tumor-suppressor functions and negatively regulates the oncogenic TAC1 in breast cancer cells. Proc Natl Acad Sci USA. 2009; 106:4408–13. https://doi.org/10.1073/pnas.0809130106 [PubMed]
- 26. Tham C, Chew M, Soong R, Lim J, Ang M, Tang C, Zhao Y, Ong SY, Liu Y. Postoperative serum methylation levels of TAC1 and SEPT9 are independent predictors of recurrence and survival of patients with colorectal cancer. Cancer. 2014; 120:3131–41. https://doi.org/10.1002/cncr.28802 [PubMed]
- 27. Mori Y, Cai K, Cheng Y, Wang S, Paun B, Hamilton JP, Jin Z, Sato F, Berki AT, Kan T, Ito T, Mantzur C, Abraham JM, Meltzer SJ. A genome-wide search identifies epigenetic silencing of somatostatin, tachykinin-1, and 5 other genes in colon cancer. Gastroenterology. 2006; 131:797–808. https://doi.org/10.1053/j.gastro.2006.06.006 [PubMed]
- 28. Rameshwar P, Gascón P. Induction of negative hematopoietic regulators by neurokinin-A in bone marrow stroma. Blood. 1996; 88:98–106. [PubMed]
- 29. Ye S, Yang L, Zhao X, Song W, Wang W, Zheng S. Bioinformatics method to predict two regulation mechanism: TF-miRNA-mRNA and lncRNA-miRNA-mRNA in pancreatic cancer. Cell Biochem Biophys. 2014; 70:1849–58. https://doi.org/10.1007/s12013-014-0142-y [PubMed]
- 30. Obata K, Shimo T, Okui T, Matsumoto K, Takada H, Takabatake K, Kunisada Y, Ibaragi S, Nagatsuka H, Sasaki A. Tachykinin Receptor 3 distribution in human oral squamous cell carcinoma. Anticancer Res. 2016; 36:6335–41. https://doi.org/10.21873/anticanres.11230 [PubMed]
- 31. Xin X, Zhang J, Chang Y, Wu Y. Association study of TAC3 and TACR3 gene polymorphisms with idiopathic precocious puberty in Chinese girls. J Pediatr Endocrinol Metab. 2015; 28:65–71. https://doi.org/10.1515/jpem-2013-0460 [PubMed]
- 32. Wei P, Tang H, Li D. Insights into pancreatic cancer etiology from pathway analysis of genome-wide association study data. PLoS One. 2012; 7:e46887. https://doi.org/10.1371/journal.pone.0046887 [PubMed]
- 33. Huan J, Wang L, Xing L, Qin X, Feng L, Pan X, Zhu L. Insights into significant pathways and gene interaction networks underlying breast cancer cell line MCF-7 treated with 17β-estradiol (E2). Gene. 2014; 533:346–55. https://doi.org/10.1016/j.gene.2013.08.027 [PubMed]
- 34. Fang ZQ, Zang WD, Chen R, Ye BW, Wang XW, Yi SH, Chen W, He F, Ye G. Gene expression profile and enrichment pathways in different stages of bladder cancer. Genet Mol Res. 2013; 12:1479–89. https://doi.org/10.4238/2013.May.6.1 [PubMed]