


Introduction
Type 1 diabetes mellitus (T1DM) is a D-glucose metabolic disorder characterized by autoimmune destruction of pancreatic β-cells, leading to insulin deficiency and hyperglycaemia [1]. T1DM can affect different organs and result in many complications; among these complications, diabetic encephalopathy is diabetes-induced brain damage [2]. As early as 1922, diabetes was recognized to lead to cognitive dysfunction [3]. Because an increasing number of people are diagnosed with T1DM or type 2 diabetes mellitus (T2DM), diabetic encephalopathy has become widely recognized [4–6]. Patients with diabetic encephalopathy show both mental and physical symptoms, including an altered mental state, cognitive decline, memory lapses, and changes in personality [2, 7]. Compared with people without diabetes mellitus, people with diabetes are at higher risk of cognitive decline and dementia, such as Alzheimer's disease [8].
Although many pathomechanisms, such as alterations in the vascular supply of the brain and the interaction between insulin and the brain [9], have been proposed for diabetes mellitus, the most attention has been paid to T2DM in ageing people [10]. Unlike T2DM, T1DM is one of the most frequent chronic diseases in children and can start at any age. Some children with T1DM may be at high risk of cognitive deficits, especially those diagnosed at earlier ages [11, 12]. Middle-aged and older adults are also at increased risk for cognitive decline [13, 14]; however, the risk factors for cognitive decline in adults with T1DM have remained unclear thus far [15]. Therefore, identifying the risk factors of T1DM-related cognitive impairment is important.
D-glucose is a long-standing major molecular biomarker for both T1DM and T2DM. However, recent studies have shown that in addition to D-glucose, D-ribose plays a role in T2DM [16, 17]. As a key component of intracorporal biomolecules, including RNA, ATP and riboflavin, D-ribose participates in numerous biochemical processes [18–20] and has an active role in the glycation of protein, producing advanced glycation end products (AGE) [21, 22]. In particular, D-ribose is an important contributor to glycated haemoglobin (HbA1c) [17] and glycated serum protein [23], showing the linkage between aldopentose and diabetes. Intraperitoneal injection with D-ribose (3.2 g/kg.bw, once daily) elicited a significant increase in triglyceride in Sprague-Dawley (SD) rat liver [24]. As described by the European Food Safety Authority [25], toxicological effects could not be ruled out, although the use of D-ribose in nutritional supplement is considered acceptable. Especially in cognitive impairment, ribosylation-induced Tau protein aggregation is highly cytotoxic to neuronal cells [26]. Long-term gavage of D-ribose can also cause cognitive impairment in mice [27]. Increasing evidence suggests that D-ribose is closely related to T2DM and even diabetic complications. However, the relationship between D-ribose and cognitive impairment in T1DM has not yet been investigated.
The streptozotocin (STZ)-injected rats is a common animal model used in T1DM studies [28, 29]. T1DM is associated with neurocognitive dysfunction and astrogliosis [30]. Furthermore, metabolic analyses revealed that T1DM mainly affects metabolic pathways involved in mitochondrial energy failure and impairs the antioxidative system [31]. In the present study, we observed that T1DM patients had abnormally increased levels of D-ribose in blood and urine. STZ-induced T1DM rats exhibited cognitive impairment and had high levels of D-ribose in blood and urine, along with AGE formation, Tau hyperphosphorylation and neuronal death. Transketolase (TKT) was demonstrated to be an important enzyme in regulating D-ribose metabolism in T1DM-related encephalopathy rats. Interestingly, elevation of TKT by benfotiamine (BTMP) rescued D-ribose dysmetabolism, followed by decreases in AGE accumulation, Tau hyperphosphorylation, and neuronal death, as well as the rescue of cognitive impairment in T1DM rats.
Results
High D-ribose levels in type 1 diabetic rats
To investigate D-ribose dysmetabolism in T1DM, we prepared a T1DM animal model by administering a single intraperitoneal injection of STZ (n = 30) to SD rats as previously described [32]. Rats injected with citrate buffer (pH 4.2-4.5) were employed as controls (n = 10). Rats were maintained for 10 weeks; during this period, their fasting blood glucose (FBG), body weight and forepaw tensions were monitored every other week (Supplementary Figure 1A–1C). FBG levels in diabetic rats markedly increased after STZ injection, while body weight and tension decreased. Low levels of serum C-peptide, glucagon and insulin and brain insulin were also detected in diabetic rats (Supplementary Figure 1D). These data conformed to the requirements for using rats as a diabetic model, which was observed as D-glucose dysmetabolism.
To investigate whether D-ribose dysmetabolism occurs in T1DM, we monitored urine D-ribose levels every other week. As shown in Figure 1A, the concentrations of urine D-ribose in diabetic rats were significantly higher than those in control rats (P < 0.001). Moreover, serum and brain D-ribose levels were markedly increased in T1DM rats (P < 0.001 and P < 0.01, Figure 1B and 1C, respectively). Together with the results above, these results indicated that T1DM rats exhibit D-glucose and D-ribose dysmetabolism. However, further investigation was needed to determine why D-ribose levels were increased in T1DM.
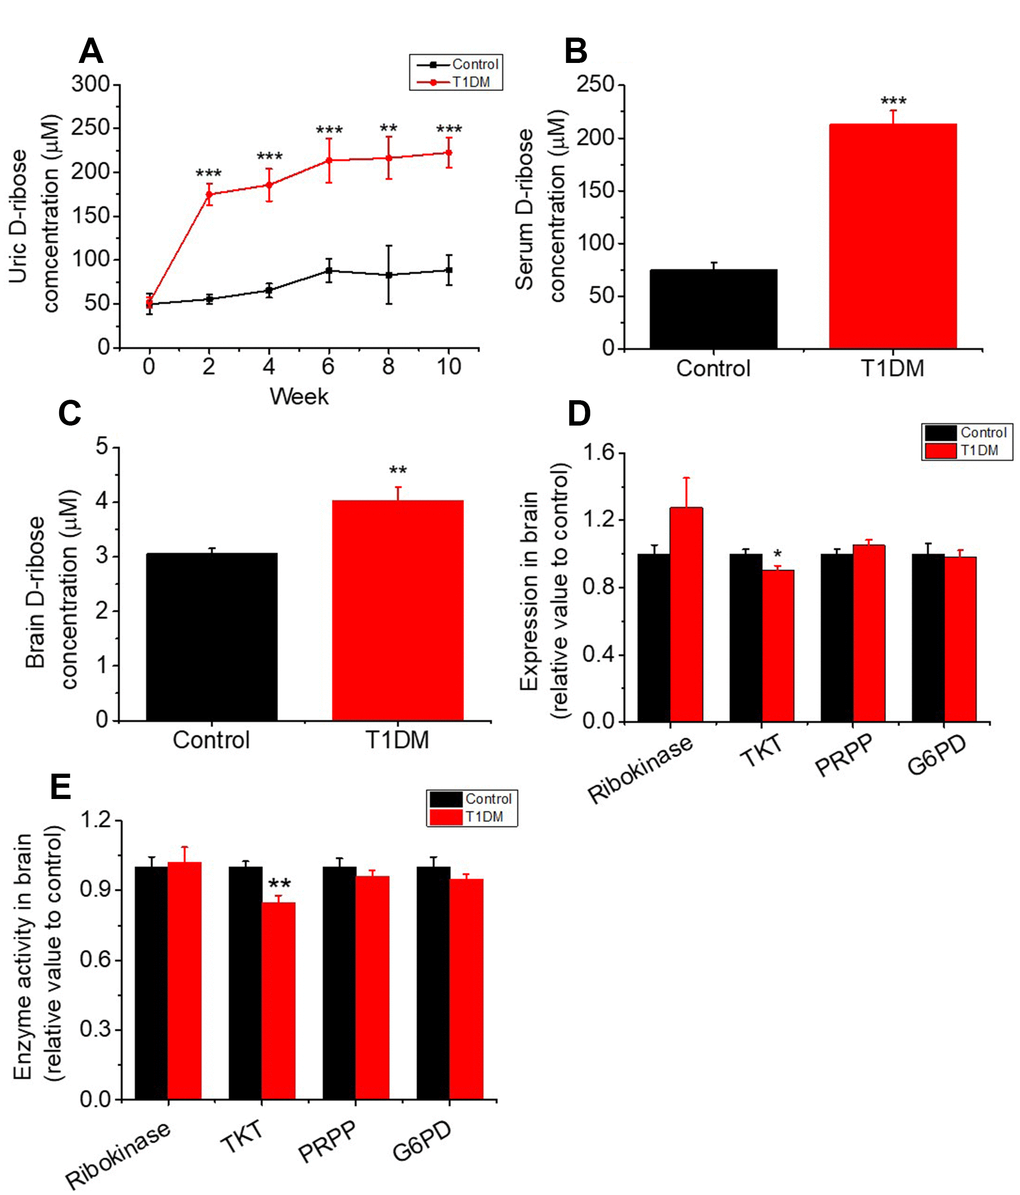
Figure 1. Increase in the levels of D-ribose and related enzymes in type 1 diabetic rats. Male SD rats (6–8 weeks) were intraperitoneally injected with STZ (70 mg/kg bw, n=30) and maintained for 10 weeks. Rats injected with saline were used as controls (n=10). Levels of D-ribose in urine were measured at different time intervals (panel A). D-ribose levels in serum (panel B) and the brain (panel C) were determined within 3 days after dissection. The expression and activity levels of ribokinase, transketolase (TKT), 5-phosphoribosyl 1-pyrophosphate (PRPP) and glucose-6 phosphate dehydrogenase (G6PD) in the brain were measured with ELISA kits (panel D and E). All values are expressed as the mean ± S.E.M. *, P < 0.05; **, P < 0.01; ***, P < 0.001.
Increase in D-ribose attributed to the inactivation of TKT in T1DM
TKT is a key enzyme in the nonoxidative branch of the pentose phosphate pathway (PPP) that is involved in the metabolism of D-ribose derivatives [33, 34]. To investigate the mechanism of the D-ribose metabolic disorder in T1DM, we measured TKT expression and activity by ELISA. As shown in Figure 1D and 1E, the expression and activity level of TKT were decreased remarkably in T1DM brain tissue. Other kinases, such as ribokinase, D-glucose-6-phosphate dehydrogenase (G6PD) and ribose phosphate pyrophosphokinase (PRPP), which also play roles in regulating D-ribose metabolism, did not show significant changes in expression or activity level in T1DM rats compared to control rats.
To demonstrate that TKT is linked to D-ribose dysmetabolism, we used BTMP to rescue the TKT change in T1DM rats since BTMP can increase the level of thiamine diphosphate and enhances TKT activity [35]. Diabetic rats (n = 20) were gavaged with BTMP, while the control rats (n = 10) were gavaged with carboxymethylcellulose (CMC) as described previously [17]. The results of the liver and kidney assays after BTMP treatment are shown in Supplementary Table 1. As shown in Figure 2A, administration of BTMP increased brain TKT levels in both normal rats (P < 0.05) and diabetic rats (P < 0.05). As expected, a similar result showing that BTMP rescued the expression of TKT was observed in the liver in T1DM rats compared with that in control rats (Figure 2B). Both the activity and expression (Western blots) of TKT in the liver and brain were significantly rescued after BTMP administration (Supplementary Figure 2). By contrast, D-ribose levels in both serum and brain were significantly decreased after BTMP administration (Figure 2C, 2D). However, brain D-glucose levels showed no marked differences (P > 0.05) between T1DM rats and BTMP-gavaged T1DM rats (Figure 2E). Under the experimental conditions, BTMP did not rescue or decrease FBG levels in T1DM rats (Figure 2F). However, BTMP could partially rescue the body weights of T1DM rats but not the forepaw tension or insulin levels in the brain and serum (Supplementary Figure 3). That is, administration of BTMP can regulate the metabolism of D-ribose rather than D-glucose in rats via activation of TKT.
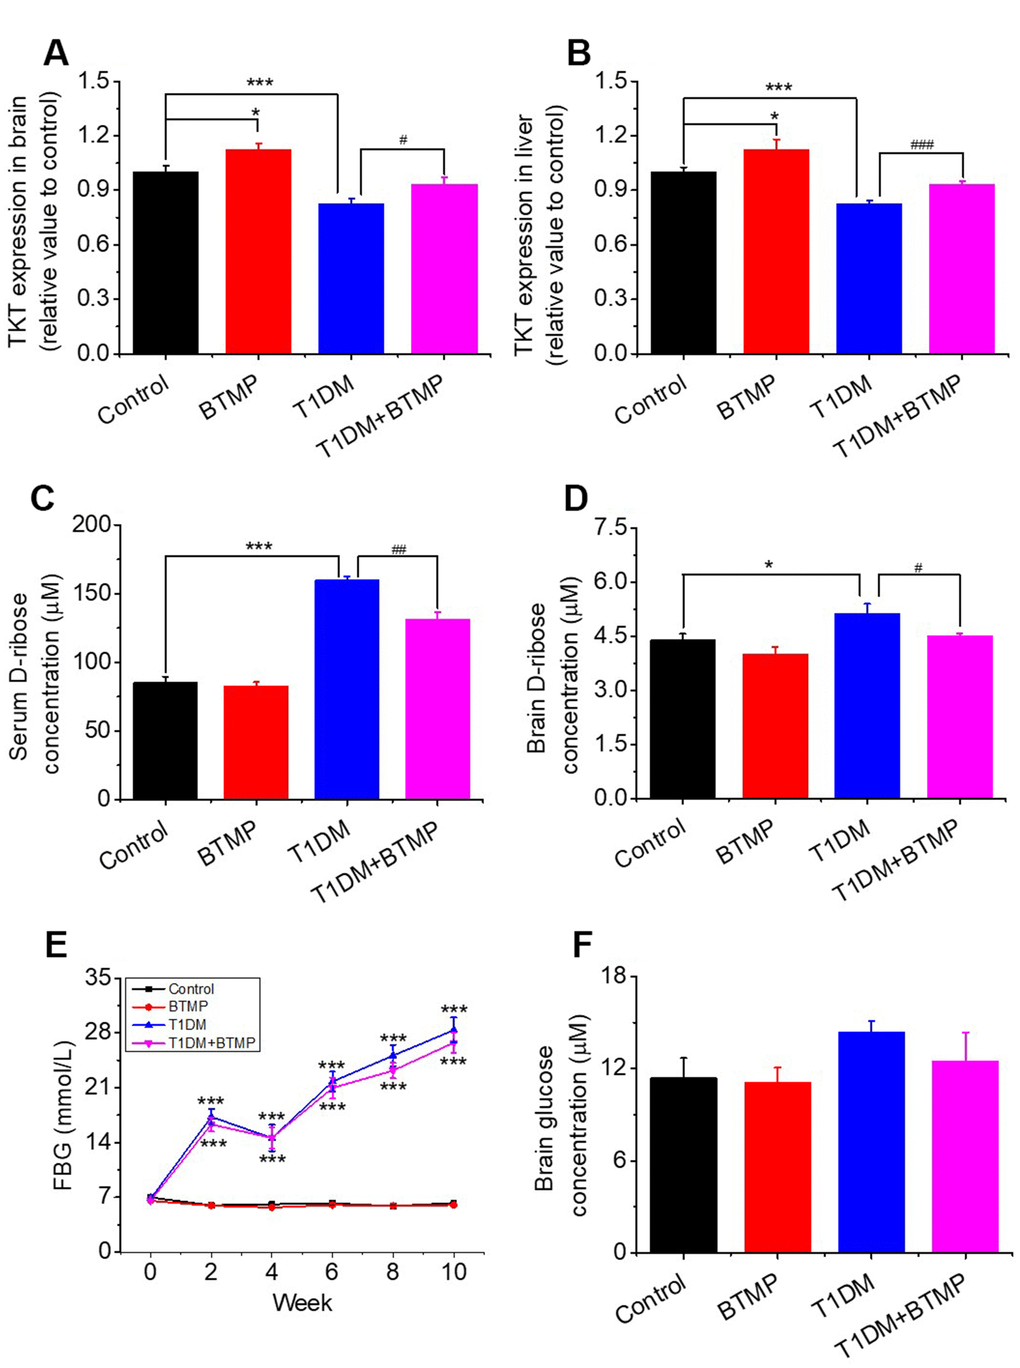
Figure 2. Effect of benfotiamine (BTMP) on the levels of D-ribose, D-glucose and TKT in T1DM rats. Conditions for the preparation of T1DM rats are shown in Figure 1. Male rats (6-8 weeks) were divided into four groups as follows: T1DM rats were gavaged with benfotiamine (BTMP, 300 mg/kg bw, once daily) dissolved in carboxymethylcellulose (CMC) (90) (T1DM+BTMP, n=20); T1DM rats were gavaged with CMC (T1DM, n=20); normal SD rats were gavaged with CMC (Control, n=10) and BTMP (n=10) as negative and positive controls, respectively. The expression levels of transketolase (TKT) in the brain (panel A) and liver (panel B) were measured with ELISA kits. After 10 weeks of domestication, D-ribose levels in the serum (panel C) and brain (panel D) of rats were measured, and D-glucose levels were measured in the brain (panel F). Fasting blood glucose (FBG) was measured every other week (panel E). “*” compared to the control group. “#” represents the difference between the T1DM and T1DM+BTMP groups. All values are expressed as the mean ± S.E.M. *, P < 0.05; ***, P < 0.001; #, P < 0.05; ##, P < 0.01; ###, P < 0.001.
Gavage of BTMP ameliorates cognitive impairment in T1DM rats
According to McCrimmon and colleagues, both T1DM and T2DM are related to cognitive dysfunction [36]. Here, we investigated whether T1DM rats experienced cognitive impairment. First, compared with control rats, T1DM rats showed significantly fewer correct alterations in the Y maze test (Supplementary Figure 4A). In the Morris water maze test, the escape latency in the training session was significantly longer among T1DM rats (Supplementary Figure 4B), and the percentage of time spent in the target quadrant in the probe trial was markedly lower for T1DM rats (Supplementary Figure 4C). T1DM rats also showed fewer platform crossings than did control rats, but the difference was nonsignificant (Supplementary Figure 4D). Representative images of the performance path of the rats are shown in Supplementary Figure 4E. These results indicated that T1DM rats exhibited cognitive impairment, which was regarded as type 1 diabetic encephalopathy. In addition, rats with type 1 diabetic encephalopathy also showed anxiety behavior based on open field and elevated plus maze assays (Supplementary Figure 5).
To demonstrate whether cognitive impairment in T1DM rats was linked to D-ribose dysmetabolism, we tested the cognitive ability of T1DM rats with BTMP gavage. In the Y maze test, BTMP-gavaged T1DM rats exhibited significantly more correct alterations than in T1DM rats without BTMP gavage (Figure 3A). In the Morris water maze test, T1DM rats gavaged with BTMP spent less time searching for the platform than did T1DM rats without BTMP gavage (Figure 3B). After platform withdrawal, the time spent in the target quadrant and the number of platform crossings were significantly higher in the T1DM group gavaged with BTMP than in that without BTMP gavage (Figure 3C, 3D). Representative images of the rats’ performance paths are shown in Figure 3E. These data suggested that the alleviation of cognitive impairment by treatment with BTMP is related to a decrease in D-ribose in STZ-induced T1DM rats.
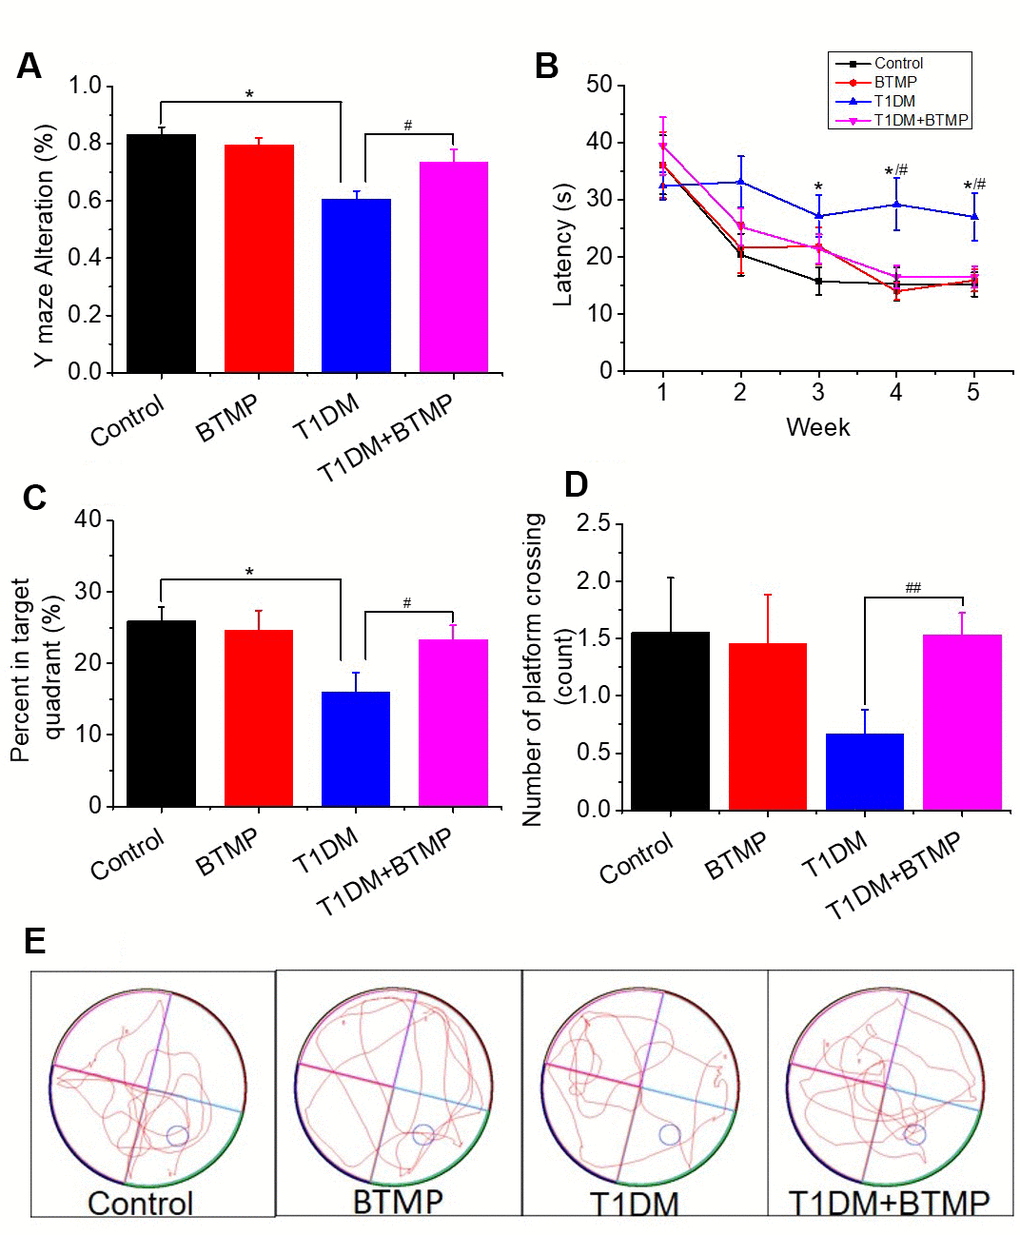
Figure 3. Rescue of spatial learning and memory abilities in T1DM rats with BTMP. Animal groups and treatments were as described in Figure 2 except that rats were subjected to Y maze and Morris water maze tests. The accuracy of Y maze alternation was detected (panel A). The escape latency (panel B), percentage of time spent in the target quadrant (panel C) and number of platform crossings (panel D) were recorded. Representative images of the performance path are shown (panel E). “*” represents the difference between the Control and T1DM groups. “#” represents the difference between the T1DM and T1DM+benfotiamine (BTMP) groups. The number of those groups are control (n=10), BTMP (n=9), T1DM (n=15) and T1DM+BTMP (n=15). All values are expressed as the mean ± S.E.M. *, P < 0.05; #, P < 0.05; ##, P < 0.01.
D-ribose is linked to AGE, Tau hyperphosphorylation and neuronal death
As hyperphosphorylated Tau and the resultant neurofibrillary tangles and AGE are closely related to cognitive impairment [37, 38], and high dose D-ribose treatment resulted in AGE aggregation and Tau hyperphosphrylation [39]. We wondered whether cognition-impaired T1DM rats exhibit Tau hyperphosphorylation and AGE accumulation along with a decrease in D-ribose. As shown, Tau was remarkably hyperphosphorylated at Ser396, AT8 (Ser199 and Ser202), while nonphosphorylated Tau (recognized by anti-Tau-1 antibody) was decreased in both the cortex (Supplementary Figure 6A, a’) and hippocampus (Supplementary Figure 6B, b’) in T1DM rats. At the same time, markedly high AGE levels were detected in both the cortex and hippocampus. These data suggest that T1DM rats suffer from Tau hyperphosphorylation as well as AGE accumulation in the brain.
To investigate whether D-ribose dysmetabolism is linked to Tau hyperphosphorylation and AGE accumulation, we gavaged T1DM rats with BTMP and measured Tau phosphorylation and AGE levels. As shown in Supplementary Figure 7, AGE in both the cortex and hippocampus in BTMP-gavaged T1DM rats were significantly decreased compared with those without BTMP gavage. Furthermore, the results from the glycated serum protein (GSP) assay showed a marked decrease in GSP in T1DM rats after treatment with BTMP (Supplementary Figure 7C). These data demonstrated that D-ribose plays a role in AGE accumulation in T1DM rats.
Along with the distinct decrease in AGE accumulation, Tau hyperphosphorylation was also reduced by BTMP administration. Tau phosphorylation levels (AT8 and pSer396) in the cortex and hippocampus were significantly reduced, while nonphosphorylated Tau levels (Tau-1) were increased in T1DM rats treated with BTMP compared with control rats (Supplementary Figure 7). That is, Tau hyperphosphorylation is related to the D-ribose dysmetabolism in T1DM rats.
Neuronal loss is regarded as the most important pathological feature of age-related cognitive impairment. We performed immunochemical experiments to determine neuronal death in the brains of T1DM rats. As shown in Figure 4A, neuronal death was distinctly observed in the hippocampal CA4/DG area of T1DM rats. However, neuronal death in the brains of T1DM rats was greatly reduced by treatment with BTMP (Figure 4A, 4B). The decrease in D-ribose induced by BTMP occurred with the amelioration of pathological features, such as AGE accumulation, Tau hyperphosphorylation and neuronal death. These data suggested that D-ribose dysmetabolism is closely related to cognitive impairment and that BTMP can be used as a potential medicine to rescue cognitive impairment via a decrease in D-ribose levels. Additionally, the anxious behavior was observably improved after BTMP administration in the open field and elevated plus maze assays (Supplementary Figure 8).
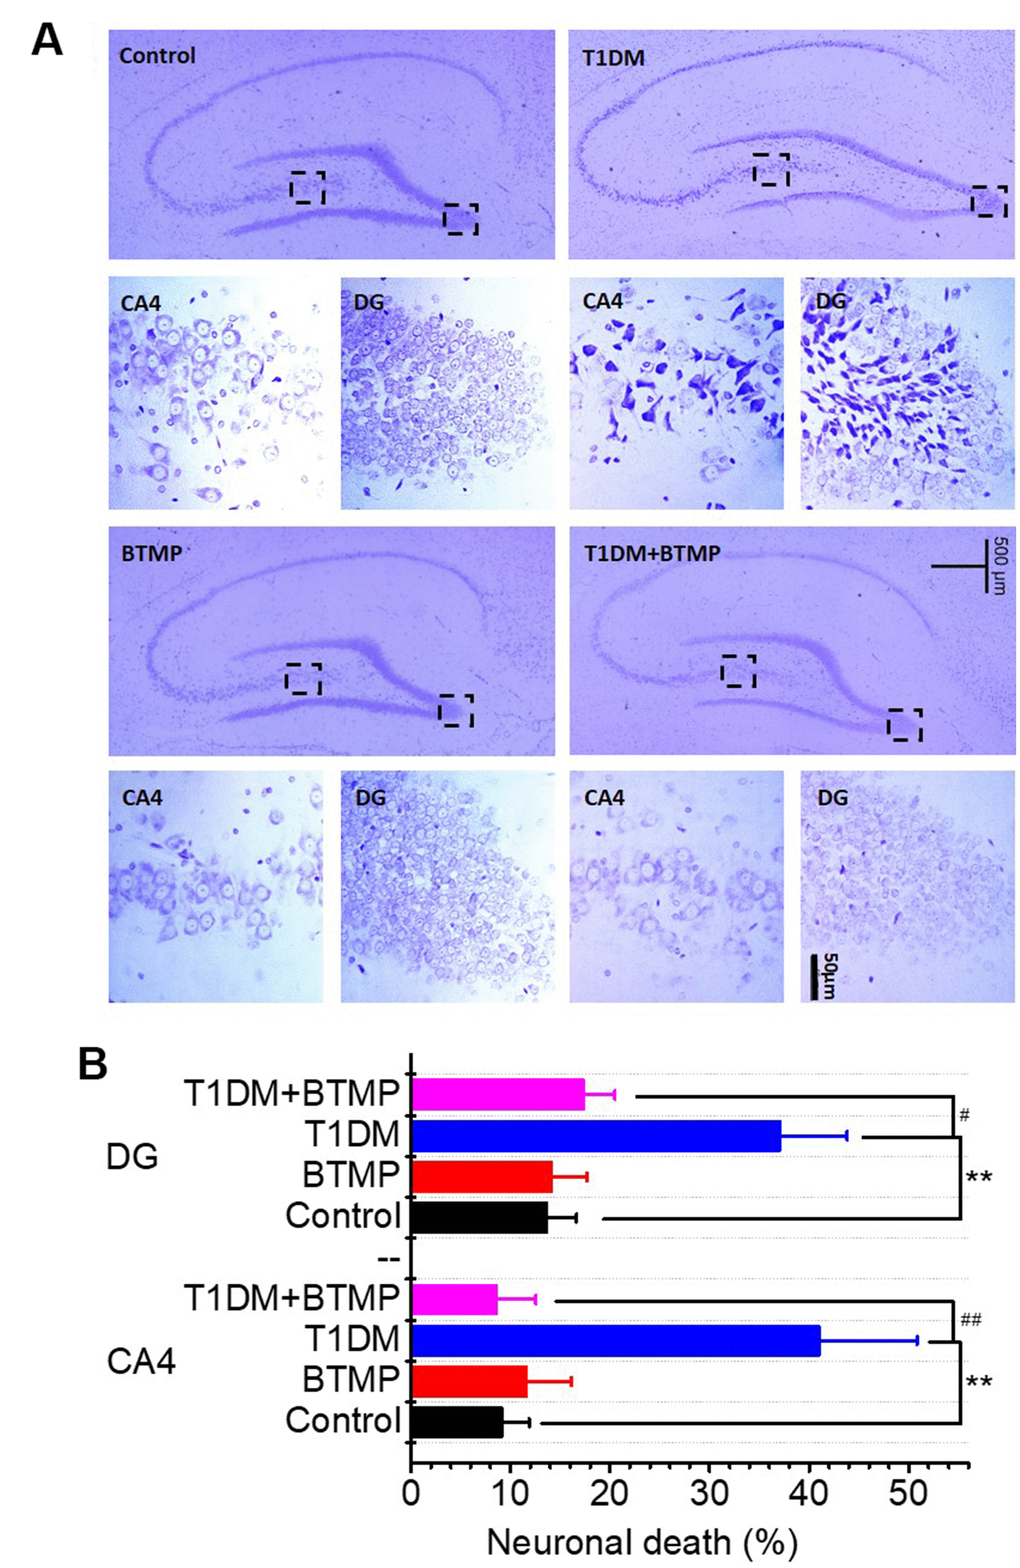
Figure 4. Nissl staining of hippocampal neurons of rats treated with BTMP. Animal groups and treatment were as described in Figure 2 except that hippocampal slices were prepared and stained with cresyl violet (panel A). Numbers of necrotic neurons were counted under a microscope as described in the Materials and Methods (panel B). The number of those groups are control (n=10), BTMP (n=9), T1DM (n=10) and T1DM+BTMP (n=10). All values are expressed as the mean ± S.E.M. “*” compared to the control group. “#” represents the difference between the T1DM and T1DM+BTMP groups. All values are expressed as the mean ± S.E.M. **, P < 0.01; #, P < 0.05; ##, P < 0.01.
Increased D-ribose levels in T1DM patients
To detect the D-ribose level in T1DM patients, twenty-four participants (8 T1DM patients and 16 age-matched participants without diabetes mellitus) were recruited for collection of fasting blood and morning urine. The summarized characteristics of the participants are shown in Supplementary Table 2. No differences were found in the age distributions between the T1DM and control groups (P = 0.8842), while FBG, HbA1c levels and BMI were significantly different between the two groups (P < 0.0001, P < 0.0001 and P = 0.0164, respectively). We measured the concentrations of D-ribose in urine and serum by high-performance liquid chromatography (HPLC). Both the serum and urine D-ribose levels of T1DM patients were significantly higher than those of controls (P = 0.0005 and P = 0.0285, respectively, Figure 5A, 5B), exhibiting the dysmetabolism of D-ribose in T1DM patients.
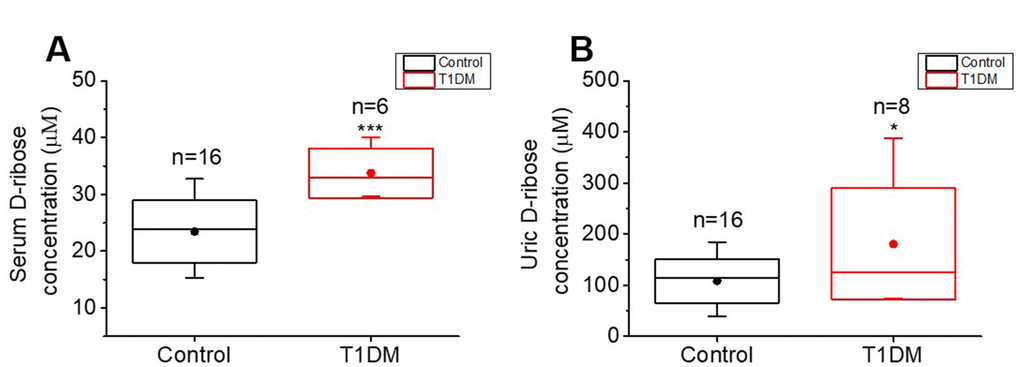
Figure 5. Comparison of D-ribose levels between T1DM patients and normal participants. Patients with T1DM (T1DM group) and age-matched normal participants (control group, n=16) were enrolled for determination of their D-ribose concentrations. D-ribose levels in serum (panel A) and urine (panel B) were measured by HPLC as previously described [17]. All values are shown as the mean ± S.E.M. *, P < 0.05; ***, P < 0.001.
Discussion
T1DM results in long-term complications in the central nervous system, causing brain cellular dysfunction and cognitive deficits [40]. As reported in a recent study, T2DM patients suffer from D-ribose and D-glucose dysmetabolism [16]. In the present study, in addition to D-glucose, endogenous D-ribose was markedly increased in T1DM patients and STZ-induced T1DM rats, which also exhibited AGE accumulation and cognitive impairment accompanied with Tau hyperphosphorylation and neuronal death. Administration of BTMP decreased D-ribose levels and AGE accumulation and improved cognitive ability in T1DM rats. BTMP also reduced Tau hyperphosphorylation, and neuronal death. All these data indicated that D-ribose dysmetabolism is associated with cognitive impairment in T1DM rat and that the administration of BTMP can ameliorate the loss of neurons and cognitive impairment via regulation of D-ribose.
As a very active aldose, D-ribose exists in urine [16], serum [41] and cerebrospinal fluid (0.01 ~ 0.1 mM) [42]. D-Ribose increases AGE levels more significantly and rapidly than D-glucose does when the concentration ratio [D-ribose]/[D-glucose] is 1/50 [23]. AGE accumulation is one of the most important features in diabetes and its complications due to the high sugars levels [43]. According to the suggestion of the European Food Safety Authority, the maximum proposed levels is 10 g/day of D-ribose in food supplements for human adults and 3.6 g/kg bw per day of derived D-ribose for rat experiments [25]. The Panel considers that the effects observed in a subchronic toxicity study in Wistar rats could be the consequence of nutritional imbalances but that toxicological effects could not be ruled out [25]. In accordance with the Guidance for Industry, Center for Drug Evaluation and Research, U.S., the Conversion of Animal Doses to Human Equivalent Doses for rat and mouse in mg/kg are divided by a factor of 6.2 and 12.3, respectively. Administration of an approximate dose (3.2g/kg bw, once daily) of D-ribose has significant effects on mouse cognitive ability [27, 44]. D-ribose can also give rise to Tau hyperphosphorylation and Aβ-like deposition in brain tissue and cause endoplasmic reticulum stress, which is toxic to cells and results in apoptosis [27, 39, 45]. Administration of D-ribose can increase hepatic triglyceride and water intake and decrease body weight in SD rats [24]. Furthermore, formaldehyde was regarded as a risk factor for age-related cognitive impairment [46]. Intraperitoneal injection with D-ribose (3.2g/kg bw, once daily) leads to an increase in formaldehyde in the mouse brain [47]. These finding suggest that high dose D-ribose intake induces toxicity. A high level of D-ribose was also found in the urine of T2DM patients, suggesting the dysmetabolism of D-ribose in T2DM [16]. Therefore, speculation that D-ribose dysmetabolism is involved in type 1 diabetic encephalopathy and its pathogenesis is reasonable.
T1DM rats showed a low level of TKT in brain tissue accompanied by a high level of D-ribose and pathological features of diabetic encephalopathy. Because D-ribose can be converted from D-glucose through the PPP [48, 49], we measured G6PD and ribokinase. However, G6PD and ribokinase did not show a marked change in T1DM rats except for TKT. These results indicated that STZ-induced T1DM rats did not suffer from dysfunction in G6PD, a key enzyme in the D-glycolytic pathway. Many studies have shown that G6PD is upregulated [50] or downregulated [51] in STZ-induced DM rats. Epel demonstrated that the level of G6PD can be regulated by NADP, the critical factor in oxidative stress [52, 53]. Many studies have also shown that the expression of G6PD regulates the generation of NADPH to alleviate oxidative stress [54], suggesting that G6PD would induce dynamic changes in DM. Mendez et al. showed that neurons maintain the oxidation of G6PD through the PPP to sustain their antioxidant status [55]. In DM, apart from G6PD, TKT is also an important shunt key enzyme in the PPP [34]; thus, it makes sense that supplementation with BTMP, acting as a TKT activator [56], causes a reduction in oxidative stress and affects several anabolic reactions, which might also reduce the level of AGEs [57, 58]. BTMP regulates the level of TKT that is directly involved in D-ribose metabolism [59, 60]. In this studies, BTMP treatment upregulated TKT, decreased D-ribose levels and simultaneously rescued T1DM rats from diabetic-related encephalopathy but did not decrease D-glucose levels. These data indicated that dysmetabolism of D-ribose with a decline in TKT function was involved in cognitive impairment in T1DM rats under the experimental conditions. Other laboratories also observed dynamic changes of TKT activity in different tissues in diabetes [61, 62]. Consequently, TKT may be used as a potential drug target in the treatment of diabetic-related encephalopathy with high D-ribose levels.
BTMP gives a relatively wide range of actions on a number of cellular targets [58] such as treatment of inflammatory [63], peritoneal dialysis [64] and Tauopathy [65]. BTMP also plays a role in the metabolism of D-glucose [66]. BTMP also decreased oxidative stress and phosphorylation/activation of vascular endothelial growth receptor-2 [67] and Akt signaling [68]. According to Hammes and colleagues, BTMP activates TKT and prevents the activation of multiple pathways of hyperglycemic damage, such as the hexosamine pathway, the AGE formation pathway and the diacylglycerol-protein kinase C pathway, in diabetic animals [56]. Though activation of TKT through BTMP is downstream of the D-ribose pathway, which may not be direct evidence, the current work at least showed that a decrease in D-ribose levels could help the amelioration of cognitive impairment.
In clinical investigations, BTMP significantly improved the cognitive abilities of mild-to-moderate Alzheimer’s disease patients independently of brain amyloid accumulation [69]. In fact, BTMP is closely related to D-ribose metabolism. BTMP markedly ameliorates the impaired spatial cognitive ability of T1DM rats in the Y maze and Morris water maze. Administration of BTMP decreases D-ribose levels in the brain, blood and urine of T1DM rats. Chen and coworkers have indicated the correlation between D-ribose and the administration of BTMP in a ZDF rat animal model for diabetes [17]. Interestingly, urine D-ribose is negatively correlated with mini-mental state examination (MMSE) scores of patients with Alzheimer’s disease [70]. Currently, a clinical trial on the treatment of cognitive impairment in Alzheimer's disease (a pilot study) with BTMP has been started and performed by Gibson and Jordan in the Burke Neurological Institute (clinicaltrials.gov). Here, we would like to suggest that changes in D-ribose in blood and urine should be monitored and analysed in their clinical trials because BTMP can reduce D-ribose levels and ameliorate cognitive impairment in T1DM rats.
As mentioned above, neuronal death was observed in the hippocampal CA4/DG region of T1DM rats. Neuronal loss may deteriorate cognitive ability. CA4 is a subfield of the hippocampus that is adjacent to the DG subfield [71, 72]. The DG region, which is involved in long-term potentiation (LTP) and long-term memory, is associated with cognitive ability [73, 74]. Furthermore, the CA4/DG region in the brain controls anxiety-like behaviour and hippocampal neurogenesis and plasticity [75, 76]. Here, we also found that T1DM rats showed anxiety-like behaviour (Supplementary Figure 8). In previous studies, BTMP was also shown to counteract anxiety-like behaviour [77, 78]. Thus, determining whether there is anxiety in D-ribose-treated animals and whether D-ribose preferentially affects the CA4/DG region in the brain is worthwhile. Why the hippocampal CA4/DG region is more vulnerable to D-ribose dysmetabolism is also an important question. The connection of D-ribose with CA4/DG neuronal death and anxiety and the underlying mechanism need further investigation.
The current work suggests that dysregulated D-ribose acts as a novel metabolite in cognitive impairment in T1DM rats by triggering protein glycation, Tau hyperphosphorylation and neuronal loss. This viewpoint is based on the following observations. First, T1DM rats demonstrated high levels of D-ribose in the serum, urine and brain. Second, T1DM patients also showed high levels of D-ribose in the urine and serum. Third, the expression and activity levels of TKT in the brain and liver of T1DM rats were reduced, which affected D-ribose metabolism [60]. Fourth, gavage of BTMP as the activator upregulated the expression of TKT in the brain and liver and decreased the levels of D-ribose but not those of D-glucose. Fifth, administration of BTMP suppressed D-ribose levels and rescued cognitive impairment in T1DM rats in both the Y maze and Morris water maze assays, which confirmed the influence of D-ribose dysmetabolism. Sixth, in T1DM rats with cognitive impairment, AGE accumulation and Tau hyperphosphorylation in the hippocampus and cortex were closely related to D-ribose dysmetabolism. Seventh, amelioration of neuronal loss in hippocampal CA4/DG regions occurred with decreased D-ribose levels. Finally, on the basis of previous work in this laboratory, AGE accumulation, Tau hyperphosphorylation and cognitive impairment were observed in a D-ribose-induced mouse model [27, 79]. As described by other studies, both AGE [80] and Tau hyperphosphorylation [81] are associated with neuronal death [82] or loss [83, 84], which can cause hippocampal atrophy [85] and result in cognitive impairment [86, 87]. Therefore, D-ribose-induced neuronal loss may be an important contributor to cognitive impairment in T1DM rats.
In conclusion, STZ-induced T1DM rats had high levels of D-ribose in their brain, serum and urine in addition to D-glucose. TKT controlled D-ribose metabolism, and activation of TKT with BTMP decreased D-ribose levels, followed by a reduction in AGE formation, Tau hyperphosphorylation, neuronal death and cognitive impairment. Thus, dysmetabolism of D-ribose is considered a novel pathological features in rats with T1DM and its complications. T1DM patients also show high levels of D-ribose. However, further investigations should be conducted on T1DM pathologies and complications related to D-ribose.
Materials and Methods
Animal treatments
Male SD rats (~8 weeks, weighing 180~200 g) were provided by Vital River Laboratory Animal Technology Co. Ltd. (China). The animals were housed in plastic cages measuring 45×30×26 cm (4 rats in each cage). Rats were maintained under standard laboratory conditions, i.e., a well-aerated room with alternating light and dark cycles of 12 h, and had access to food and water ad libitum. The handling of rats and experimental procedures were approved by the Animal Welfare and Research Ethics Committee of the Institute of Biophysics, Chinese Academy of Sciences (Permit Number: SYXK2016-32).
STZ (70 mg/kg bw, Sigma Aldrich, USA) was intraperitoneally injected into rats to induce hyperglycaemic conditions, as observed in diabetic patients (n = 30) [88]. Rats in the control group (n = 10) were injected with equivalent volumes of citrate buffer (pH 4.2-4.5). Diabetes was diagnosed when the FBG level of rats was higher than 11.1 mmol/L 3 days after STZ injection [89]. Behavioral tests were carried out, and rats were sacrificed in the 10th week.
For BTMP administration, all rats were randomly divided into four groups: Control (n = 10), BTMP (n = 10), T1DM (n = 20), and T1DM+BTMP (n = 20). BTMP was dissolved in CMC (1% m/v) and administered at 300 mg/kg bw via gavage daily [90]. Rats in the control group received a single intraperitoneal injection of citrate buffer and daily CMC gavage. Rats in the BTMP group received a single intraperitoneal injection of saline solution and daily BTMP gavage. Rats in the T1DM group received a single intraperitoneal injection of STZ and daily CMC gavage. Rats in the T1DM+BTMP group received a single intraperitoneal injection of STZ and daily BTMP gavage. Behavioural tests were carried out, and rats were sacrificed in the 10th week.
Y maze
The Y maze we used was composed of three equally spaced arms (120°; 47 cm long × 46 cm wide × 16 cm high, Beijing ZSdichuang Science and Technology Development Co., Ltd, China). Activity in the Y maze was used to measure spontaneous alternation performance (working memory) and locomotor activity. The rats were placed in one of the arm compartments and allowed to move freely for 5 min. The sequence of arm entries was manually recorded. Alternation was defined as an entry into all three arms in consecutive choices. Spontaneous alternation percentage (alternation %) was defined as the ratio of the arm entry choices that differed from the previous two choices to the total choices. Then, the number of maximum spontaneous correct alternations was calculated as the total number of arms entered minus 2, and the percentage was calculated as correct alternations/maximum alternations × 100% [27, 91].
Morris water maze
The Morris water maze (Beijing ZSdichuang Science and Technology Development Co., Ltd, China) test was performed as previously described [92]. The apparatus consisted of a circular water tank (150 cm in diameter and 60 cm in height) containing water (22 ± 2 °C) to a depth of 40 cm that was rendered opaque by adding black food dye. A platform (12 cm in diameter and 38 cm in height) was submerged 2 cm below the water surface and placed at the midpoint of one quadrant. Rats were exposed to a visual platform before they were exposed to a hidden platform. The visual platform was the same as the hidden platform, but a ‘flag’ that extends above the water surface by approximately 15 cm was mounted on the platform. Each rat had four trials per day with the visual platform test for four consecutive days. For the hidden platform test, each rat received four periods of training per day for five consecutive days. The latency to escape from the water maze (that is, finding the submerged escape platform based on the four different markers pasted on the middle of the cylinder wall of the four quadrants) was calculated for each trial. On day 6, a probe test was carried out by removing the platform and allowing each rat to swim freely for 60 sec. The time that rats spent swimming in the target quadrant (where the platform had been located during the hidden platform training) was measured. All data were recorded with a computerized video system [92].
Open field test and elevated-plus maze
We performed elevated plus maze and open field tests as described [27, 93]. In the elevated plus maze, the percentage (%) of the time spent in the open arms, the number of open arm entries and head-dipping within 5 min was recorded. In the open field test, the percentage (%) of time spent in the center square, the number of center square entries, the number of stands and the number of grooming behaviors were considered indices of anxiety.
Sample collection from animals
Urine samples were collected for D-ribose detection (every other week) when the experiment started. After completing the behavioral tests on week 10, all the rats were fully anaesthetized by using 10% chloral hydrate solution before being sacrificed. Then, the blood was collected as previously described [94] and centrifuged (4,000 rpm, 15 min, 20 °C). Serum was stored at -80 °C for different measurements. The hippocampus and cortex were also quickly dissected for subsequent Western blotting and D-ribose or fixed in 4% paraformaldehyde for Nissl staining. Liver was collected as described previously [95] for TKT assay.
Grip strength measurement
A tension metre (Bioseb, France) was used to test the forelimb grip strength in rats as described by Tilson and colleagues [96]. Rats were held by their tails, and their front paws grasped the grid. Five grip force measurements were made, and the LCD screen of the tension metre automatically displayed the maximum tensile strength each time. The average of five measurements was taken to represent the forelimb grip strength.
Measurements of body weight, FBG and physiological and biochemical indexes
The body weight and FBG concentration of each rat were recorded every other week when the experiment started. FBG was tested using a Roche ACCU-CHEK blood D-Glucose meter (Roche, USA). The levels of physiological and biochemical indexes (ALT, AST, CREA-J, BUM, TC, TG, insulin and C-peptide) were measured and supplied by the Fred Clinical Inspection Institution (China).
Measurement of D-ribose by HPLC
D-ribose in the urine and serum was measured as previously described [16, 17]. Urine samples were centrifuged (12,000 rpm, 4 °C, 10 min), and serum samples were centrifuged (12,000 rpm, 4 °C, 10 min) after the precipitation of serum proteins by the addition of three volumes of acetonitrile. A 0.4 mL aliquot of the supernatant was mixed with 0.6 mL 4-(3-methyl-5-oxo-2-pyrazolin-1-yl) benzoic acid (MOPBA, final concentration 150 mM in 250 mM NaOH in 50% methanol-water solution, Sigma Aldrich, USA) and then heated in a 70 °C water bath for 90 min, followed by additional centrifugation (12,000 rpm, 4 °C, 10 min). The mixture was acidified by the addition of 150 μL 2 M HCl solution to precipitate the excess MOPBA, centrifuged (12,000 rpm, 4 °C, 10 min), and ultimately filtered through 0.22 μm membranes. Next, 20 μL of the solution was subjected to HPLC (LC-20A, Shimadzu, Japan) with an ultraviolet detector. Mobile phase A was 10 mM sodium 1-hexanesulfonate (Tokyo Chemical Industry, Japan), and mobile phase B was a 50% acetonitrile solution. The reference concentrations of D-ribose and D-glucose were determined according to the standard curves.
Glycated serum protein (GSP) detection
The nitroblue tetrazolium (NBT) assay was used to detect GSP formation in serum samples [97]. The samples were mixed with NBT dye, and the absorbance of the samples was measured at 540 nm. The final content was calculated according to the manufacturer’s instructions (Nanjing Jiancheng, China). More details are provided in the instructions for specific experimental descriptions.
Gel electrophoresis and Western blotting
The levels of AGE in the hippocampus and cortex were determined by Western blotting following standard protocols. The same method was used to analyse the expression of phosphorylated Tau at Ser396 (pS396) and AT8 (Ser199/202), nonphosphorylated Tau (Tau-1), and total Tau protein (Tau-5). The levels of TKT in the liver and brain were detected by Western blotting. β-Actin was used as a loading control. The antibodies used were as follows: anti-AGE monoclonal antibody (TransGenic, Japan), anti-Tau pSer396 polyclonal antibody (Invitrogen, USA), anti-Tau AT8 polyclonal antibody (Invitrogen, USA), anti-Tau-1 monoclonal antibody (Millipore, USA), anti-Tau-5 monoclonal antibody (Millipore, USA), anti-TKT antibody (Sigma, USA) and anti-β-actin monoclonal antibody (Sigma, USA).
ELISA
The expression and activity levels of TKT, G6PD, PRPP and ribokinase in rat brains were quantified using ELISA kits in accordance with the manufacturer’s instructions. The ELISA kits used were as follows: TKT, G6PD, PRPP, and ribokinase expression kit (JiNingshiye, China), and TKT, G6PD, PRPP, and ribokinase enzyme activity kit (JiNingshiye, China).
Nissl staining
Rat brains were processed for Nissl immunohistochemistry using standard protocols. Rat tissues were immersed in 4% paraformaldehyde for 48 h immediately after dissection. After fixation, the tissues were embedded in paraffin blocks. Sections (5 μm thick) were processed for Nissl staining according to the manufacturer’s instructions (Beyotime, China) [98]. The results were from ten independent samples for each group.
Subject enrolment and sample collection
T1DM patients (n = 8) and normal subjects without diabetes (n = 16) were recruited from the Health Examination Center of the Affiliated Hospital of Southwest Medical University. The exclusion criteria for normal participators included diabetes, use of D-ribose as an energy supplement, or nephropathy or any other serious systemic diseases. None of the subjects had not undergone any surgery within 3 months. Their background characteristics are shown in Supplementary Table 2.
Morning urine and fasting blood samples were collected from the enrolled participants and stored in separate sealed sterile containers at -80 °C before measurements. The process strictly followed the regulations of the ethics committee of the Affiliated Hospital of Southwest Medical University (No. KY2017011), and written informed consent was obtained from all participants.
Data analysis
We analysed all data using Origin 9.0 software (Originlab, USA). Significance differences between the T1DM group and the control group were calculated with two-sided unpaired Student’s t-tests. P values less than 0.05 were considered significant. All rescue experiments were performed using one-way ANOVA with a post hoc test. Differences with a probability level of 95% (P < 0.05) were considered significant.
Author Contributions
L.Y. performed the experiments, designed and analysed the data and wrote the manuscript. Y.C. performed the clinical sample collection, a part of experiments and participated in writing this manuscript. Y. X. and T. H. supervised and performed the clinical sample collection. Y.W. performed the experiments, designed and supervised this study and participated in writing this manuscript. R.H. designed and supervised this study and participated in writing the manuscript.
Acknowledgments
We thanks Chunhong Feng (the Affiliated Hospital of Southwest Medical University) for their supports in clinical sample collection and thanks all those who participated in the enrolment and contributed samples in this study. Thanks for Dr. Beibei Wu for her suggestions in the experimental design. Thanks for Ms. Xiang Shi and Mr. Lei Zhou (Institute of Biophysics, Chinese Academy of Sciences) for providing veterinary care, breeding, the management of laboratory animals and technical support.
Conflicts of Interest
All authors declared no competing interests in this study.
Funding
This work was supported by grants from Natural Scientific Foundation of China NSFC (31670805, 81573763), National Key Research and Development Program of China (2016YFC1305900; 2016YFC1306300), Beijing Municipal Science and Technology Project (Z161100000217141 and Z161100000216137), and Youth Innovation Promotion Association CAS (2017132).
References
- 1. Gregory JM, Moore DJ, Simmons JH. Type 1 diabetes mellitus. Pediatr Rev. 2013; 34:203–15. https://doi.org/10.1542/pir.34-5-203 [PubMed]
- 2. Biessels GJ, editor. Diabetes and the Brain. Humana Press; 2009.
- 3. Miles WR, Root HF. Psychologic tests applied to diabetic patients. Arch Intern Med (Chic). 1922; 30:767–77. https://doi.org/10.1001/archinte.1922.00110120086003
- 4. Sima AA. Encephalopathies: the emerging diabetic complications. Acta Diabetol. 2010; 47:279–93. https://doi.org/10.1007/s00592-010-0218-0 [PubMed]
- 5. Brands AM, Biessels GJ, de Haan EH, Kappelle LJ, Kessels RP. The effects of type 1 diabetes on cognitive performance: a meta-analysis. Diabetes Care. 2005; 28:726–35. https://doi.org/10.2337/diacare.28.3.726 [PubMed]
- 6. Zhu F, Jiang B, Ren R, Yang L. Amplitude of peroneal compound motor action potential increases in type 2 diabetes with thyroid autoimmunity. Sci China Life Sci. 2018; 61:988–91. https://doi.org/10.1007/s11427-017-9316-x [PubMed]
- 7. Harris JA, Murphy JA. Lacosamide: an adjunctive agent for partial-onset seizures and potential therapy for neuropathic pain. Ann Pharmacother. 2009; 43:1809–17. https://doi.org/10.1345/aph.1M303 [PubMed]
- 8. Arvanitakis Z, Wilson RS, Bienias JL, Evans DA, Bennett DA. Diabetes mellitus and risk of Alzheimer disease and decline in cognitive function. Arch Neurol. 2004; 61:661–66. https://doi.org/10.1001/archneur.61.5.661 [PubMed]
- 9. Gispen WH, Biessels GJ. Cognition and synaptic plasticity in diabetes mellitus. Trends Neurosci. 2000; 23:542–49. https://doi.org/10.1016/S0166-2236(00)01656-8 [PubMed]
- 10. Strachan MW, Reynolds RM, Marioni RE, Price JF. Cognitive function, dementia and type 2 diabetes mellitus in the elderly. Nat Rev Endocrinol. 2011; 7:108–14. https://doi.org/10.1038/nrendo.2010.228 [PubMed]
- 11. Wysocki T, Harris MA, Mauras N, Fox L, Taylor A, Jackson SC, White NH. Absence of adverse effects of severe hypoglycemia on cognitive function in school-aged children with diabetes over 18 months. Diabetes Care. 2003; 26:1100–05. https://doi.org/10.2337/diacare.26.4.1100 [PubMed]
- 12. Nunley KA, Ryan CM, Orchard TJ, Aizenstein HJ, Jennings JR, Ryan J, Zgibor JC, Boudreau RM, Costacou T, Maynard JD, Miller RG, Rosano C. White matter hyperintensities in middle-aged adults with childhood-onset type 1 diabetes. Neurology. 2015; 84:2062–69. https://doi.org/10.1212/WNL.0000000000001582 [PubMed]
- 13. van Duinkerken E, Steenwijk MD, Klein M, Barkhof F, Mograbi DC, Diamant M, Snoek FJ, Ijzerman RG. Accelerated executive functions decline and gray matter structural changes in middle-aged type 1 diabetes mellitus patients with proliferative retinopathy. J Diabetes. 2018; 10:835–46. https://doi.org/10.1111/1753-0407.12773 [PubMed]
- 14. Xia W, Chen YC, Luo Y, Zhang DF, Chen H, Ma JA, Yin X. Decreased Spontaneous Brain Activity and Functional Connectivity in Type 1 Diabetic Patients Without Microvascular Complications. Cell Physiol Biochem. 2018; 51:2694–2703. https://doi.org/10.1159/000495960 [PubMed]
- 15. Chaytor NS, Barbosa-Leiker C, Ryan CM, Germine LT, Hirsch IB, Weinstock RS. Clinically significant cognitive impairment in older adults with type 1 diabetes. J Diabetes Complications. 2019; 33:91–97. https://doi.org/10.1016/j.jdiacomp.2018.04.003 [PubMed]
- 16. Su T, Xin L, He Y-G, Wei Y, Song Y-X , Li W-W, Wang X-M, He R-Q. The Abnormally High Level of Uric D-Ribose for Type-2 Diabetics. Progress in Biochemistry and Biophysics. 2013; 40:816–25. https://doi.org/10.3724/SP.J.1206.2013.00341
- 17. Chen X, Su T, Chen Y, He Y, Liu Y, Xu Y, Wei Y, Li J, He R. d-Ribose as a Contributor to Glycated Haemoglobin. EBioMedicine. 2017; 25:143–53. https://doi.org/10.1016/j.ebiom.2017.10.001 [PubMed]
- 18. Broom AD, Townsend LB, Jones JW, Robins RK. Purine Nucleosides. Vi. Further Methylation Studies of Naturally Occurring Purine Nucleosides. Biochemistry. 1964; 3:494–500. https://doi.org/10.1021/bi00892a005 [PubMed]
- 19. Keller PJ, Le Van Q, Kim SU, Bown DH, Chen HC, Kohnle A, Bacher A, Floss HG. Biosynthesis of riboflavin: mechanism of formation of the ribitylamino linkage. Biochemistry. 1988; 27:1117–20. https://doi.org/10.1021/bi00404a006 [PubMed]
- 20. Mauser M, Hoffmeister HM, Nienaber C, Schaper W. Influence of ribose, adenosine, and “AICAR” on the rate of myocardial adenosine triphosphate synthesis during reperfusion after coronary artery occlusion in the dog. Circ Res. 1985; 56:220–30. https://doi.org/10.1161/01.RES.56.2.220 [PubMed]
- 21. Chen L, Wei Y, Wang X, He R. Ribosylation rapidly induces alpha-synuclein to form highly cytotoxic molten globules of advanced glycation end products. PLoS One. 2010; 5:e9052. https://doi.org/10.1371/journal.pone.0009052 [PubMed]
- 22. Wei Y, Han CS, Zhou J, Liu Y, Chen L, He RQ. D-ribose in glycation and protein aggregation. Biochim Biophys Acta. 2012; 1820:488–94. https://doi.org/10.1016/j.bbagen.2012.01.005 [PubMed]
- 23. Chen Y, Yu L, Wang Y, Wei Y, Xu Y, He T, He R. d-Ribose contributes to the glycation of serum protein. Biochim Biophys Acta Mol Basis Dis. 2019; 1865:2285–92. https://doi.org/10.1016/j.bbadis.2019.05.005 [PubMed]
- 24. Chen Y, Yu L, Wei Y, Long Y, Xu Y, He T, He R. D-ribose increases triglyceride via upregulation of DGAT in the liver. Sci China Life Sci. 2019; 62:858–61. https://doi.org/10.1007/s11427-019-9542-2 [PubMed]
- 25. EFSA Panel on Dietetic Products N. Safety of d-ribose as a novel food pursuant to Regulation (EU) 2015/2283. EFSA J. 2018; 16:e05265. https://doi.org/10.2903/j.efsa.2018.5363
- 26. Chen L, Wei Y, Wang X, He R. D-Ribosylated Tau forms globular aggregates with high cytotoxicity. Cell Mol Life Sci. 2009; 66:2559–71. https://doi.org/10.1007/s00018-009-0058-7 [PubMed]
- 27. Wu B, Wei Y, Wang Y, Su T, Zhou L, Liu Y, He R. Gavage of D-Ribose induces Aβ-like deposits, Tau hyperphosphorylation as well as memory loss and anxiety-like behavior in mice. Oncotarget. 2015; 6:34128–42. https://doi.org/10.18632/oncotarget.6021 [PubMed]
- 28. Lenzen S. The mechanisms of alloxan- and streptozotocin-induced diabetes. Diabetologia. 2008; 51:216–26. https://doi.org/10.1007/s00125-007-0886-7 [PubMed]
- 29. Wang B, Zhong Y, Li Q, Cui L, Huang G. Autophagy of macrophages is regulated by PI3k/Akt/mTOR signalling in the development of diabetic encephalopathy. Aging (Albany NY). 2018; 10:2772–82. https://doi.org/10.18632/aging.101586 [PubMed]
- 30. de Senna PN, Ilha J, Baptista PP, do Nascimento PS, Leite MC, Paim MF, Gonçalves CA, Achaval M, Xavier LL. Effects of physical exercise on spatial memory and astroglial alterations in the hippocampus of diabetic rats. Metab Brain Dis. 2011; 26:269–79. https://doi.org/10.1007/s11011-011-9262-x [PubMed]
- 31. Zhou Y, Lian S, Zhang J, Lin D, Huang C, Liu L, Chen Z. Mitochondrial Perturbation Contributing to Cognitive Decline in Streptozotocin-Induced Type 1 Diabetic Rats. Cell Physiol Biochem. 2018; 46:1668–1682. https://doi.org/10.1159/000489243 [PubMed]
- 32. Zhang Y, McClain SA, Lee HM, Elburki MS, Yu H, Gu Y, Zhang Y, Wolff M, Johnson F, Golub LM. A Novel Chemically Modified Curcumin “Normalizes” Wound-Healing in Rats with Experimentally Induced Type I Diabetes: initial Studies. J Diabetes Res. 2016; 2016:5782904. https://doi.org/10.1155/2016/5782904 [PubMed]
- 33. Salamon C, Chervenak M, Piatigorsky J, Sax CM. The mouse transketolase (TKT) gene: cloning, characterization, and functional promoter analysis. Genomics. 1998; 48:209–20. https://doi.org/10.1006/geno.1997.5187 [PubMed]
- 34. Kim Y, Kim EY, Seo YM, Yoon TK, Lee WS, Lee KA. Function of the pentose phosphate pathway and its key enzyme, transketolase, in the regulation of the meiotic cell cycle in oocytes. Clin Exp Reprod Med. 2012; 39:58–67. https://doi.org/10.5653/cerm.2012.39.2.58 [PubMed]
- 35. Cameron NE, Gibson TM, Nangle MR, Cotter MA. Inhibitors of advanced glycation end product formation and neurovascular dysfunction in experimental diabetes. Ann N Y Acad Sci. 2005; 1043:784–92. https://doi.org/10.1196/annals.1333.091 [PubMed]
- 36. McCrimmon RJ, Ryan CM, Frier BM. Diabetes and cognitive dysfunction. Lancet. 2012; 379:2291–99. https://doi.org/10.1016/S0140-6736(12)60360-2 [PubMed]
- 37. Tai XY, Koepp M, Duncan JS, Fox N, Thompson P, Baxendale S, Liu JY, Reeves C, Michalak Z, Thom M. Hyperphosphorylated tau in patients with refractory epilepsy correlates with cognitive decline: a study of temporal lobe resections. Brain. 2016; 139:2441–55. https://doi.org/10.1093/brain/aww187 [PubMed]
- 38. Tan X, Gu J, Zhao B, Wang S, Yuan J, Wang C, Chen J, Liu J, Feng L, Jia X. Ginseng improves cognitive deficit via the RAGE/NF-κB pathway in advanced glycation end product-induced rats. J Ginseng Res. 2015; 39:116–24. https://doi.org/10.1016/j.jgr.2014.09.002 [PubMed]
- 39. Wei Y, Chen L, Chen J, Ge L, He RQ. Rapid glycation with D-ribose induces globular amyloid-like aggregations of BSA with high cytotoxicity to SH-SY5Y cells. BMC Cell Biol. 2009; 10:10. https://doi.org/10.1186/1471-2121-10-10 [PubMed]
- 40. Piazza FV, Segabinazi E, Centenaro LA, do Nascimento PS, Achaval M, Marcuzzo S. Enriched environment induces beneficial effects on memory deficits and microglial activation in the hippocampus of type 1 diabetic rats. Metab Brain Dis. 2014; 29:93–104. https://doi.org/10.1007/s11011-013-9467-2 [PubMed]
- 41. Cai Y, Liu J, Shi Y, Liang L, Mou S. Determination of several sugars in serum by high-performance anion-exchange chromatography with pulsed amperometric detection. J Chromatogr A. 2005; 1085:98–103. https://doi.org/10.1016/j.chroma.2004.11.100 [PubMed]
- 42. Seuffer R. [A new method for the determination of sugars in cerebrospinal fluid (author’s transl)]. J Clin Chem Clin Biochem. 1977; 15:663–68. [PubMed]
- 43. Singh R, Barden A, Mori T, Beilin L. Advanced glycation end-products: a review. Diabetologia. 2001; 44:129–46. https://doi.org/10.1007/s001250051591 [PubMed]
- 44. Han C, Lu Y, Wei Y, Wu B, Liu Y, He R. D-ribosylation induces cognitive impairment through RAGE-dependent astrocytic inflammation. Cell Death Dis. 2014; 5:e1117. https://doi.org/10.1038/cddis.2014.89 [PubMed]
- 45. Wu B, Yu L, Hu P, Lu Y, Li J, Wei Y, He R. GRP78 protects CHO cells from ribosylation. Biochim Biophys Acta Mol Cell Res. 2018; 1865:629–37. https://doi.org/10.1016/j.bbamcr.2018.02.001 [PubMed]
- 46. Liu KL, He YG, Yu LX, He RQ. Elevated formaldehyde in the cecum of APP/PS1 mouse. Microbiology China. 2017; 44:1761–66.
- 47. Wang Y, Shi C, Chen Y, Yu L, Li Y, Wei Y, Li W, He R. Formaldehyde produced from d-ribose under neutral and alkaline conditions. Toxicol Rep. 2019; 6:298–304. https://doi.org/10.1016/j.toxrep.2019.02.005 [PubMed]
- 48. Wood T. Physiological functions of the pentose phosphate pathway. Cell Biochem Funct. 1986; 4:241–47. https://doi.org/10.1002/cbf.290040403 [PubMed]
- 49. Maugeri DA, Cazzulo JJ, Burchmore RJ, Barrett MP, Ogbunude PO. Pentose phosphate metabolism in Leishmania mexicana. Mol Biochem Parasitol. 2003; 130:117–25. https://doi.org/10.1016/S0166-6851(03)00173-7 [PubMed]
- 50. Ulusu NN, Sahilli M, Avci A, Canbolat O, Ozansoy G, Ari N, Bali M, Stefek M, Stolc S, Gajdosik A, Karasu C. Pentose phosphate pathway, glutathione-dependent enzymes and antioxidant defense during oxidative stress in diabetic rodent brain and peripheral organs: effects of stobadine and vitamin E. Neurochem Res. 2003; 28:815–23. https://doi.org/10.1023/A:1023202805255 [PubMed]
- 51. Wu J, Jin Z, Yan LJ. Redox imbalance and mitochondrial abnormalities in the diabetic lung. Redox Biol. 2017; 11:51–59. https://doi.org/10.1016/j.redox.2016.11.003 [PubMed]
- 52. Epel D. The initiation of development at fertilization. The initiation of development at fertilization. Cell Differ Dev. 1990; 29:1–12. [PubMed]
- 53. Rosa AP, Jacques CE, de Souza LO, Bitencourt F, Mazzola PN, Coelho JG, Mescka CP, Dutra-Filho CS. Neonatal hyperglycemia induces oxidative stress in the rat brain: the role of pentose phosphate pathway enzymes and NADPH oxidase. Mol Cell Biochem. 2015; 403:159–67. https://doi.org/10.1007/s11010-015-2346-x [PubMed]
- 54. Pessôa BS, Peixoto EB, Papadimitriou A, Lopes de Faria JM, Lopes de Faria JB. Spironolactone improves nephropathy by enhancing glucose-6-phosphate dehydrogenase activity and reducing oxidative stress in diabetic hypertensive rat. J Renin Angiotensin Aldosterone Syst. 2012; 13:56–66. https://doi.org/10.1177/1470320311422581 [PubMed]
- 55. Herrero-Mendez A, Almeida A, Fernández E, Maestre C, Moncada S, Bolaños JP. The bioenergetic and antioxidant status of neurons is controlled by continuous degradation of a key glycolytic enzyme by APC/C-Cdh1. Nat Cell Biol. 2009; 11:747–52. https://doi.org/10.1038/ncb1881 [PubMed]
- 56. Hammes HP, Du X, Edelstein D, Taguchi T, Matsumura T, Ju Q, Lin J, Bierhaus A, Nawroth P, Hannak D, Neumaier M, Bergfeld R, Giardino I, Brownlee M. Benfotiamine blocks three major pathways of hyperglycemic damage and prevents experimental diabetic retinopathy. Nat Med. 2003; 9:294–99. https://doi.org/10.1038/nm834 [PubMed]
- 57. Katare RG, Caporali A, Oikawa A, Meloni M, Emanueli C, Madeddu P. Vitamin B1 analog benfotiamine prevents diabetes-induced diastolic dysfunction and heart failure through Akt/Pim-1-mediated survival pathway. Circ Heart Fail. 2010; 3:294–305. https://doi.org/10.1161/CIRCHEARTFAILURE.109.903450 [PubMed]
- 58. Balakumar P, Rohilla A, Krishan P, Solairaj P, Thangathirupathi A. The multifaceted therapeutic potential of benfotiamine. Pharmacol Res. 2010; 61:482–88. https://doi.org/10.1016/j.phrs.2010.02.008 [PubMed]
- 59. Zhao J, Zhong CJ. A review on research progress of transketolase. Neurosci Bull. 2009; 25:94–99. https://doi.org/10.1007/s12264-009-1113-y [PubMed]
- 60. Dong Y, Wang M. Knockdown of TKTL1 additively complements cisplatin-induced cytotoxicity in nasopharyngeal carcinoma cells by regulating the levels of NADPH and ribose-5-phosphate. Biomed Pharmacother. 2017; 85:672–78. https://doi.org/10.1016/j.biopha.2016.11.078 [PubMed]
- 61. Babaei-Jadidi R, Karachalias N, Ahmed N, Battah S, Thornalley PJ. Prevention of incipient diabetic nephropathy by high-dose thiamine and benfotiamine. Diabetes. 2003; 52:2110–20. https://doi.org/10.2337/diabetes.52.8.2110 [PubMed]
- 62. Thornalley PJ, Babaei-Jadidi R, Al Ali H, Rabbani N, Antonysunil A, Larkin J, Ahmed A, Rayman G, Bodmer CW. High prevalence of low plasma thiamine concentration in diabetes linked to a marker of vascular disease. Diabetologia. 2007; 50:2164–70. https://doi.org/10.1007/s00125-007-0771-4 [PubMed]
- 63. Yadav UC, Kalariya NM, Srivastava SK, Ramana KV. Protective role of benfotiamine, a fat-soluble vitamin B1 analogue, in lipopolysaccharide-induced cytotoxic signals in murine macrophages. Free Radic Biol Med. 2010; 48:1423–34. https://doi.org/10.1016/j.freeradbiomed.2010.02.031 [PubMed]
- 64. Kihm LP, Müller-Krebs S, Klein J, Ehrlich G, Mertes L, Gross ML, Adaikalakoteswari A, Thornalley PJ, Hammes HP, Nawroth PP, Zeier M, Schwenger V. Benfotiamine protects against peritoneal and kidney damage in peritoneal dialysis. J Am Soc Nephrol. 2011; 22:914–26. https://doi.org/10.1681/ASN.2010070750 [PubMed]
- 65. Tapias V, Jainuddin S, Ahuja M, Stack C, Elipenahli C, Vignisse J, Gerges M, Starkova N, Xu H, Starkov AA, Bettendorff L, Hushpulian DM, Smirnova NA, et al. Benfotiamine treatment activates the Nrf2/ARE pathway and is neuroprotective in a transgenic mouse model of tauopathy. Hum Mol Genet. 2018; 27:2874–92. https://doi.org/10.1093/hmg/ddy201 [PubMed]
- 66. Katare R, Oikawa A, Cesselli D, Beltrami AP, Avolio E, Muthukrishnan D, Munasinghe PE, Angelini G, Emanueli C, Madeddu P. Boosting the pentose phosphate pathway restores cardiac progenitor cell availability in diabetes. Cardiovasc Res. 2013; 97:55–65. https://doi.org/10.1093/cvr/cvs291 [PubMed]
- 67. Tuncer S, Atilgan R, Pala Ş, Kuloğlu T, Artaş G, Aydın S. N-Acetylcysteine and Benfotiamine Protect Autotransplanted Ovarian Tissue From Ischemia-Reperfusion Injury: An Experimental Study. Exp Clin Transplant. 2018. [Epub ahead of print]. https://doi.org/10.6002/ect.2017.0320 [PubMed]
- 68. Marchetti V, Menghini R, Rizza S, Vivanti A, Feccia T, Lauro D, Fukamizu A, Lauro R, Federici M. Benfotiamine counteracts glucose toxicity effects on endothelial progenitor cell differentiation via Akt/FoxO signaling. Diabetes. 2006; 55:2231–37. https://doi.org/10.2337/db06-0369 [PubMed]
- 69. Pan X, Chen Z, Fei G, Pan S, Bao W, Ren S, Guan Y, Zhong C. Long-Term Cognitive Improvement After Benfotiamine Administration in Patients with Alzheimer’s Disease. Neurosci Bull. 2016; 32:591–96. https://doi.org/10.1007/s12264-016-0067-0 [PubMed]
- 70. Lyu J YL, He YG, Wei Y, Dong LL, Zhang SZ, Ma Y, Rong-Qiao He. A Brief Study of the Correlation of Urine D-ribose with MMSE Scores of Patients with Alzheimer’s Disease and Cognitively Normal Participants. Am J Urol Res. 2019; 4:018–023.
- 71. Planche V, Koubiyr I, Romero JE, Manjon JV, Coupé P, Deloire M, Dousset V, Brochet B, Ruet A, Tourdias T. Regional hippocampal vulnerability in early multiple sclerosis: dynamic pathological spreading from dentate gyrus to CA1. Hum Brain Mapp. 2018; 39:1814–24. https://doi.org/10.1002/hbm.23970 [PubMed]
- 72. Boccella S, Cristiano C, Romano R, Iannotta M, Belardo C, Farina A, Guida F, Piscitelli F, Palazzo E, Mazzitelli M, Imperatore R, Tunisi L, de Novellis V, et al. Ultra-micronized palmitoylethanolamide rescues the cognitive decline-associated loss of neural plasticity in the neuropathic mouse entorhinal cortex-dentate gyrus pathway. Neurobiol Dis. 2019; 121:106–19. https://doi.org/10.1016/j.nbd.2018.09.023 [PubMed]
- 73. Zhang BL, Fan YS, Wang JW, Zhou ZW, Wu YG, Yang MC, Sun DD, Zhang JN. Cognitive impairment after traumatic brain injury is associated with reduced long-term depression of excitatory postsynaptic potential in the rat hippocampal dentate gyrus. Neural Regen Res. 2018; 13:1753–58. https://doi.org/10.4103/1673-5374.238618 [PubMed]
- 74. Roy DS, Arons A, Mitchell TI, Pignatelli M, Ryan TJ, Tonegawa S. Memory retrieval by activating engram cells in mouse models of early Alzheimer’s disease. Nature. 2016; 531:508–12. https://doi.org/10.1038/nature17172 [PubMed]
- 75. Feng S, Shi T, Qiu J, Yang H, Wu Y, Zhou W, Wang W, Wu H. Notch1 deficiency in postnatal neural progenitor cells in the dentate gyrus leads to emotional and cognitive impairment. FASEB J. 2017; 31:4347–58. https://doi.org/10.1096/fj.201700216RR [PubMed]
- 76. Kheirbek MA, Drew LJ, Burghardt NS, Costantini DO, Tannenholz L, Ahmari SE, Zeng H, Fenton AA, Hen R. Differential control of learning and anxiety along the dorsoventral axis of the dentate gyrus. Neuron. 2013; 77:955–68. https://doi.org/10.1016/j.neuron.2012.12.038 [PubMed]
- 77. Vignisse J, Sambon M, Gorlova A, Pavlov D, Caron N, Malgrange B, Shevtsova E, Svistunov A, Anthony DC, Markova N, Bazhenova N, Coumans B, Lakaye B, et al. Thiamine and benfotiamine prevent stress-induced suppression of hippocampal neurogenesis in mice exposed to predation without affecting brain thiamine diphosphate levels. Mol Cell Neurosci. 2017; 82:126–36. https://doi.org/10.1016/j.mcn.2017.05.005 [PubMed]
- 78. Markova N, Bazhenova N, Anthony DC, Vignisse J, Svistunov A, Lesch KP, Bettendorff L, Strekalova T. Thiamine and benfotiamine improve cognition and ameliorate GSK-3β-associated stress-induced behaviours in mice. Prog Neuropsychopharmacol Biol Psychiatry. 2017; 75:148–56. https://doi.org/10.1016/j.pnpbp.2016.11.001 [PubMed]
- 79. Han C, Lu Y, Wei Y, Liu Y, He R. D-ribose induces cellular protein glycation and impairs mouse spatial cognition. PLoS One. 2011; 6:e24623. https://doi.org/10.1371/journal.pone.0024623 [PubMed]
- 80. Bikbova G, Oshitari T, Yamamoto S. Neuronal cell death and regeneration in diseases associated with advanced glycation end-products accumulation. Neural Regen Res. 2014; 9:701–02. https://doi.org/10.4103/1673-5374.131569 [PubMed]
- 81. Frost B, Götz J, Feany MB. Connecting the dots between tau dysfunction and neurodegeneration. Trends Cell Biol. 2015; 25:46–53. https://doi.org/10.1016/j.tcb.2014.07.005 [PubMed]
- 82. Jang JY, Lee HK, Yoo HS, Seong YH. Phytoceramide ameliorates ß-amyloid protein-induced memory impairment and neuronal death in mice. Arch Pharm Res. 2017; 40:760–71. https://doi.org/10.1007/s12272-017-0893-2 [PubMed]
- 83. Di J, Cohen LS, Corbo CP, Phillips GR, El Idrissi A, Alonso AD. Abnormal tau induces cognitive impairment through two different mechanisms: synaptic dysfunction and neuronal loss. Sci Rep. 2016; 6:20833. https://doi.org/10.1038/srep20833 [PubMed]
- 84. Verma N, Manna SK. Advanced glycation end products (AGE) potentiates cell death in p53 negative cells via upregulaion of NF-kappa B and impairment of autophagy. J Cell Physiol. 2017; 232:3598–610. https://doi.org/10.1002/jcp.25828 [PubMed]
- 85. Li X, Li D, Li Q, Li Y, Li K, Li S, Han Y. Hippocampal subfield volumetry in patients with subcortical vascular mild cognitive impairment. Sci Rep. 2016; 6:20873. https://doi.org/10.1038/srep20873 [PubMed]
- 86. Engvig A, Fjell AM, Westlye LT, Skaane NV, Sundseth Ø, Walhovd KB. Hippocampal subfield volumes correlate with memory training benefit in subjective memory impairment. Neuroimage. 2012; 61:188–94. https://doi.org/10.1016/j.neuroimage.2012.02.072 [PubMed]
- 87. Bloom GS. Amyloid-β and tau: the trigger and bullet in Alzheimer disease pathogenesis. JAMA Neurol. 2014; 71:505–08. https://doi.org/10.1001/jamaneurol.2013.5847 [PubMed]
- 88. Maciel RM, Carvalho FB, Olabiyi AA, Schmatz R, Gutierres JM, Stefanello N, Zanini D, Rosa MM, Andrade CM, Rubin MA, Schetinger MR, Morsch VM, et al. Neuroprotective effects of quercetin on memory and anxiogenic-like behavior in diabetic rats: Role of ectonucleotidases and acetylcholinesterase activities. Biomed Pharmacother. 2016; 84:559–568. https://doi.org/10.1016/j.biopha.2016.09.069 [PubMed]
- 89. Masiello P, Broca C, Gross R, Roye M, Manteghetti M, Hillaire-Buys D, Novelli M, Ribes G. Experimental NIDDM: development of a new model in adult rats administered streptozotocin and nicotinamide. Diabetes. 1998; 47:224–29. https://doi.org/10.2337/diab.47.2.224 [PubMed]
- 90. Pan X, Gong N, Zhao J, Yu Z, Gu F, Chen J, Sun X, Zhao L, Yu M, Xu Z, Dong W, Qin Y, Fei G, et al. Powerful beneficial effects of benfotiamine on cognitive impairment and beta-amyloid deposition in amyloid precursor protein/presenilin-1 transgenic mice. Brain. 2010; 133:1342–51. https://doi.org/10.1093/brain/awq069 [PubMed]
- 91. Akanmu MA, Nwabudike NL, Ilesanmi OR. Analgesic, learning and memory and anxiolytic effects of insulin in mice. Behav Brain Res. 2009; 196:237–41. https://doi.org/10.1016/j.bbr.2008.09.008 [PubMed]
- 92. Vorhees CV, Williams MT. Morris water maze: procedures for assessing spatial and related forms of learning and memory. Nat Protoc. 2006; 1:848–58. https://doi.org/10.1038/nprot.2006.116 [PubMed]
- 93. Guo M, Lu Y, Garza JC, Li Y, Chua SC, Zhang W, Lu B, Lu XY. Forebrain glutamatergic neurons mediate leptin action on depression-like behaviors and synaptic depression. Transl Psychiatry. 2012; 2:e83. https://doi.org/10.1038/tp.2012.9 [PubMed]
- 94. Weng D, Lu Y, Wei Y, Liu Y, Shen P. The role of ROS in microcystin-LR-induced hepatocyte apoptosis and liver injury in mice. Toxicology. 2007; 232:15–23. https://doi.org/10.1016/j.tox.2006.12.010 [PubMed]
- 95. Zhou Y, Wang X, Fan S, He R. A lumbrokinase isozyme targets hepatitis B e-antigen. Sci China Life Sci. 2018; 61:1596–98. https://doi.org/10.1007/s11427-018-9441-9 [PubMed]
- 96. Tilson HA, Mitchell CL, Cabe PA. Screening for neurobehavioral toxicity: the need for and examples of validation of testing procedures. Neurobehav Toxicol. 1979; 1:137–48. [PubMed]
- 97. Xu YJ, Wu XQ, Liu W, Lin XH, Chen JW, He RQ. A convenient assay of glycoserum by nitroblue tetrazolium with iodoacetamide. Clin Chim Acta. 2002; 325:127–31. https://doi.org/10.1016/S0009-8981(02)00277-2 [PubMed]
- 98. Vo MN,Terrey M, Lee JW, Roy B, Moresco JJ, Sun L, Fu H, Liu Q, Weber TG, Yates JR 3rd, Fredrick K, Schimmel P, Ackerman SL. ANKRD16 prevents neuron loss caused by an editing-defective tRNA synthetase (vol 557, pg 510, 2018). Nature. 2018; 560:E35–35. https://doi.org/10.1038/s41586-018-0271-3 [PubMed]