


Introduction
Globally bladder cancer is the tenth most common malignant tumor in women and the fourth most common in men [1, 2]. The main histological type of bladder cancer is transitional cell carcinoma (TCC), which accounts for more than 90% of bladder cancer cases [3]. Many factors are involved in the carcinogenesis and progression of bladder cancer, including chromosomal aberrations, genetic polymer phisms, as well as genetic and epigenetic alterations [4]. Bladder cancer can be subdivided into three subtypes: superficial, invasive, and metastatic [5]. At diagnosis, 75% of cases are classified as superficial tumors, 20% are invasive cancers, and 5% already involve metastasis [6, 7]. The current gold-standard treatment of bladder cancer is a surgical operation followed by radio-chemotherapy and biological therapy [8]. Surgical resection is the key modality, and adjuvant therapy is considered an effective supplementary treatment for preventing recurrence and metastasis [9]. Nonetheless, more than 30% of patients either fail to respond to treatment or experience recurrent disease within five years, and 50% of patients die of metastatic disease [10]. Improving our understanding of the molecular mechanisms underlying the carcinogenesis and progression of bladder cancer may help identify new therapeutic strategies against bladder cancer.
Long noncoding RNAs (lncRNAs) have recently emerged as a novel hot area of research into anticancer therapies [11]. LncRNAs are a family of RNA transcripts that are > 200 nucleotides long [12]. They lack protein-coding ability yet participate in the control of a variety of cellular processes, including epigenetic, transcriptional, and post-transcriptional regulation [13]. Increasing evidence has shown involvement of lncRNAs in the malignant characteristics of human cancers, including bladder cancer [14–16]. Numerous lncRNAs are differentially expressed in bladder cancer, including PART1 [17], HCG22 [18], and TUC338 [19]. The dysregulated lncRNAs exert crucial effects on bladder carcinogenesis and cancer progression through various mechanisms [20–22]. They can function as guides, scaffolds, and molecular sponges in interactions with proteins, microRNAs (miRNAs), and mRNAs, thereby resulting in the formation of a complex signal-regulating network [23, 24].
MiRNAs belong to a large group of single-stranded noncoding short RNAs 17–24 nucleotides in length [25]. MiRNAs directly interact with the 3′-untranslated region (3′-UTR) of their target mRNAs, thus degrading these mRNAs and/or inhibiting translation [26]. Studies have revealed changes in miRNA expression in bladder cancer, suggesting that miRNAs take part in the initiation and progression of this disease [27–29]. MiRNAs can exert tumor-suppressive or oncogenic actions in bladder cancer and participate in the modulation of a wide range of pathological conditions [30–32]. Therefore, clarifying the associations among lncRNAs, miRNAs, and bladder cancer may facilitate the development of novel techniques for the prevention, diagnosis, and treatment of this condition.
An lncRNA called nicotinamide nucleotide transhydrogenase antisense RNA 1 (NNT-AS1) is abnormally expressed in a variety of human cancers and functions as a key regulator of cancer progression [33–42]. Nevertheless, the expression profile, clinical significance, and biological functions of NNT-AS1 in bladder cancer and the underlying mechanisms remain unknown. In the present study, we first measured the expression of NNT-AS1 in bladder cancer tissues and cell lines. Next, we examined the clinical value of NNT-AS1 among patients with bladder cancer. Furthermore, the specific roles and mechanisms underlying the oncogenic activities of NNT-AS1 in bladder cancer were explored in detail.
Results
NNT-AS1 is overexpressed in bladder cancer
To determine the expression profile of NNT-AS1 in bladder cancer, we measured its expression in 47 pairs of bladder cancer tissue specimens and matched adjacent normal tissues (ANTs) by reverse-transcription quantitative PCR (RT-qPCR). NNT-AS1 was found to be overexpressed in bladder cancer tissues relative to ANTs (Figure 1A, P < 0.05). In addition, obviously higher expression of NNT-AS1 was detected in all four bladder cancer cell lines (T24, 5637, UM-UC-3, and TCC-SUP) when compared with a normal bladder immortalized epithelial cell line (SV-HUC-1; Figure 1B, P < 0.05).
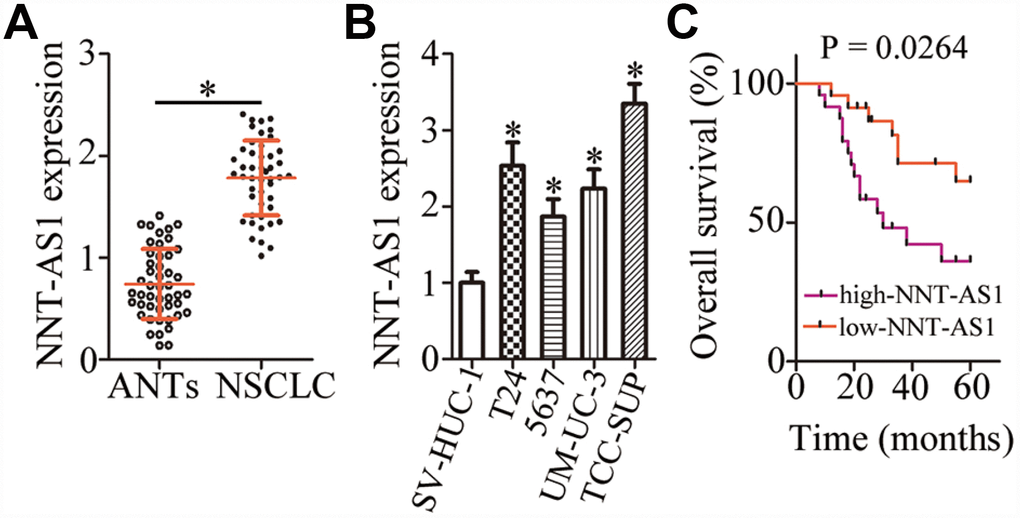
Figure 1. NNT-AS1 is overexpressed in bladder cancer and is associated with poor clinical outcomes. (A) The expression of NNT-AS1 in the 47 pairs of bladder cancer tissue specimens and matched adjacent normal tissues (ANTs) was determined by RT-qPCR. *P < 0.05 vs. the ANTs group. (B) NNT-AS1 levels were measured in four bladder cancer cell lines and a normal bladder immortalized epithelial cell line (SV-HUC-1) by RT-qPCR. *P < 0.05 vs. group SV-HUC-1. (C) Kaplan–Meier plot demonstrating the association between NNT-AS1 expression and overall survival of the patients with bladder cancer. P = 0.0264.
We next determined the clinical significance of NNT-AS1 in patients with bladder cancer. All these patients (n = 47) were distributed into two groups: either “high-NNT-AS1” (n = 24) or “low-NNT-AS1” (n = 23), based on the median value of NNT-AS1 expression in the bladder cancer tissue specimens. Evaluation of the correlation between NNT-AS1 expression and clinical parameters revealed that high NNT-AS1 expression significantly correlated with lymphatic invasion (P = 0.017) and TNM stage (P = 0.015) in patients with bladder cancer (Table 1). Furthermore, patients in the high-NNT-AS1 group demonstrated shorter overall survival in comparison with the patients in the low-NNT-AS1 group (Figure 1C, P = 0.0264). Taken together, these results indicated that NNT-AS1 was overexpressed in bladder cancer and correlated with poor clinical outcomes, suggesting that this lncRNA may be closely related to the malignancy of bladder cancer.
Table 1. Correlation between NNT-AS1 expression and clinical parameters of patients with bladder cancer.
| Clinical parameters | NNT-AS1 expression | P | |
| High | Low | ||
| Age (years) | 0.461 | ||
| < 60 | 18 (75.0%) | 20 (87.0%) | |
| ≥ 60 | 6 (25.0%) | 3 (13.0%) | |
| Gender | 0.534 | ||
| Male | 15 (62.5%) | 17 (73.9%) | |
| Female | 9 (37.5%) | 6 (26.1%) | |
| Histologic grade | 0.212 | ||
| Low grade | 10 (41.7%) | 5 (21.7%) | |
| High grade | 14 (58.3%) | 18 (78.3%) | |
| Lymphatic invasion | 0.017 | ||
| Negative | 14 (58.3%) | 21 (91.3%) | |
| Positive | 10 (41.7%) | 2 (8.7%) | |
| TNM stage | 0.015 | ||
| I-II | 11 (45.8%) | 19 (82.6%) | |
| III-IV | 13 (54.2%) | 4 (17.4%) | |
| Smoking | 0.380 | ||
| Nonsmoking | 12 (50.0%) | 15 (65.2%) | |
| Smoking | 12 (50.0%) | 8 (34.8%) | |
Knockdown of NNT-AS1 restricts bladder cancer cell proliferation, migration, and invasion but induces apoptosis
T24 and TCC-SUP showed the highest expression of NNT-AS1 among the four bladder cancer cell lines; accordingly, they were chosen for further experiments. To investigate whether NNT-AS1 is functionally implicated in the aggressiveness of bladder cancer, either small interfering RNAs (siRNAs) specific to NNT-AS1 (siNNT-AS1) or a negative control (NC) siRNA (siNC) were transfected into T24 and TCC-SUP cells, and the efficiency of siRNA transfection was assessed by RT-qPCR. The siNNT-AS1 transfection dramatically reduced the expression of NNT-AS1 in both T24 and TCC-SUP (Figure 2A, P < 0.05). The impact of NNT-AS1 knockdown on the proliferation of bladder cancer cells was determined using a Cell Counting Kit-8 (CCK-8) assay. NNT-AS1 knockdown significantly hindered the proliferation of T24 and TCC-SUP cells compared with the siNC group (Figure 2B, P < 0.05). Next, flow cytometry was utilized to test whether the influence of NNT-AS1 on bladder cancer cell proliferation is related to apoptosis. Transfection with siNNT-AS1 clearly raised the proportion of apoptotic T24 and TCC-SUP cells (Figure 2C, P < 0.05), indicating that the inhibition of bladder cancer cell proliferation by NNT-AS1 knockdown could be attributed to the promotion of apoptosis. Using transwell cell migration and invasion assays, we evaluated the migratory (Figure 2D, P < 0.05) and invasive (Figure 2E, P < 0.05) abilities of NNT-AS1–depleted T24 and TCC-SUP cells. Upon knockdown of NNT-AS1, the migration and invasiveness of T24 and TCC-SUP cells significantly decreased as compared with the siNC group. Overall, these data suggested that NNT-AS1 may promote bladder cancer progression.
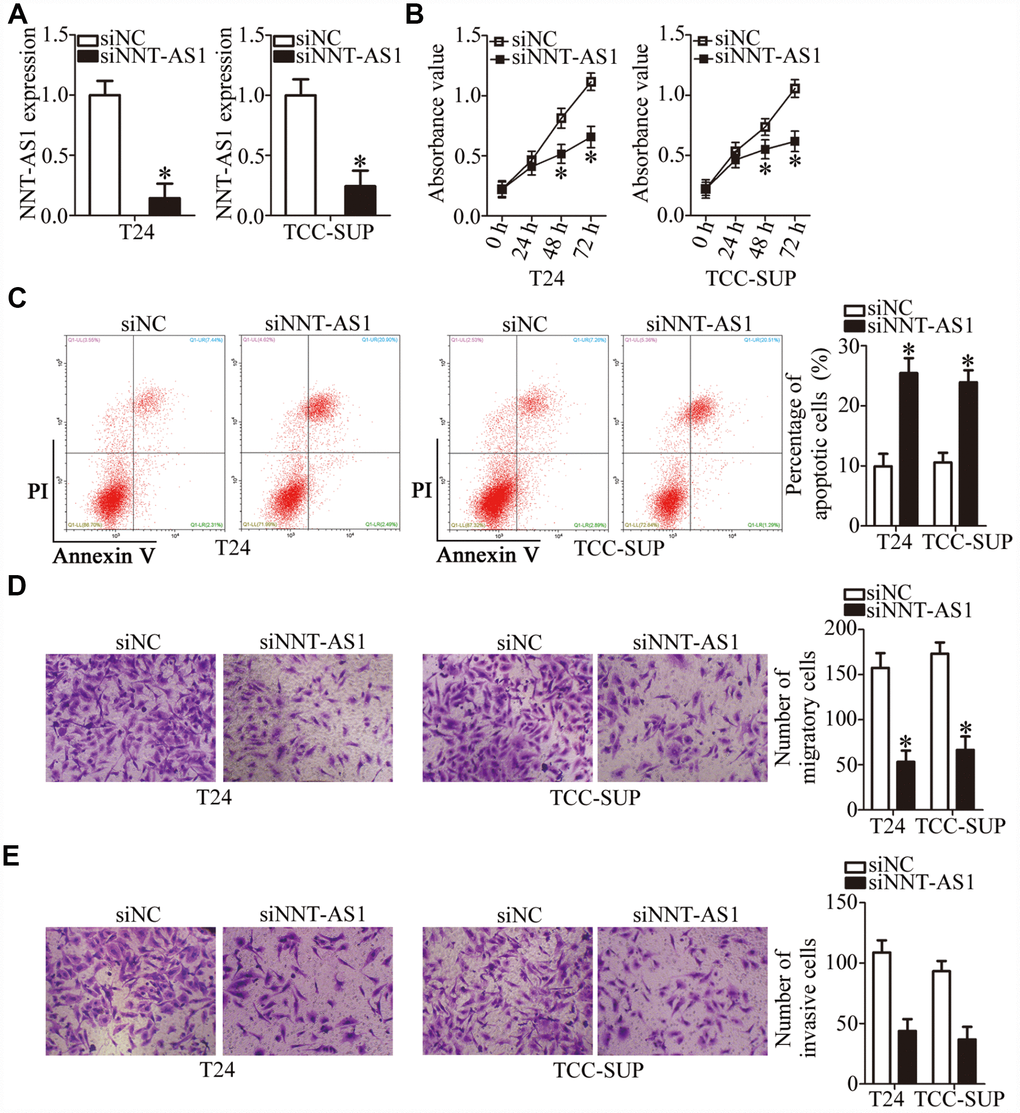
Figure 2. Downregulation of NNT-AS1 inhibits the malignant characteristics of bladder cancer cells in vitro. (A) RT-qPCR was carried out to determine the expression of NNT-AS1 in T24 and TCC-SUP cells after either siNNT-AS1 or siNC transfection. *P < 0.05 vs. group siNC. (B, C) The proliferation and apoptosis status of NNT-AS1–depleted T24 and TCC-SUP cells were tested via the CCK-8 assay and flow cytometry. *P < 0.05 vs. group siNC. (D, E) The migration and invasion abilities of T24 and TCC-SUP cells after NNT-AS1 knockdown were evaluated using transwell cell migration and invasion assays. *P < 0.05 vs. the siNC group.
NNT-AS1 acts as a competing endogenous RNA (ceRNA) on miR-496 in bladder cancer cells
To investigate the mechanisms by which NNT-AS1 promotes the malignant behaviors of bladder cancer cells, we first analyzed the subcellular localization of NNT-AS1 in these cells. We found that NNT-AS1 is mainly located in the cytoplasm of T24 and TCC-SUP cells (Figure 3A). Growing evidence suggests that cytoplasmic lncRNAs can function as ceRNAs by competitively interacting with specific miRNAs [43–45]. A bioinformatic algorithm, starBase 3.0, was executed to search for a potential miRNA target of NNT-AS1. MiR-496 (Figure 3B) was predicted to contain (with high probability) a binding site for NNT-AS1 and was selected for validation as it has been reported to participate in tumorigenesis and tumor progression [46–49]. A luciferase reporter assay was performed on bladder cancer cells to test the miR-496–binding site in NNT-AS1. Either miR-496 mimics or miR-NC and either plasmid wt-NNT-AS1 (containing wild-type miR-496–binding site 1 or site 2; Figure 3B) or plasmid mut-NNT-AS1 (containing mutant miR-496–binding site 1 or site 2; Figure 3B) were cotransfected into T24 and TCC-SUP cells. The miR-496 mimics’ dramatic transfection–mediated overexpression of miR-496 (Figure 3C, P < 0.05) decreased the luciferase activity generated by the reporter plasmid wt-NNT-AS1 (carrying site 1 or site 2) in T24 and TCC-SUP cells (P < 0.05; Figure 3D). By contrast, miR-496 upregulation did not reduce the luciferase activity generated by mut-NNT-AS1 (carrying site 1 or site 2; Figure 3D). In addition, an RNA immunoprecipitation (RIP) assay was carried out to determine the interaction between miR-496 and NNT-AS1 in bladder cancer cells. MiR-496 and NNT-AS1 were specifically enriched in an Argonaute 2 (AGO2) immunoprecipitate from the lysates of T24 and TCC-SUP cells as compared with the IgG control group (Figure 3E, P < 0.05).
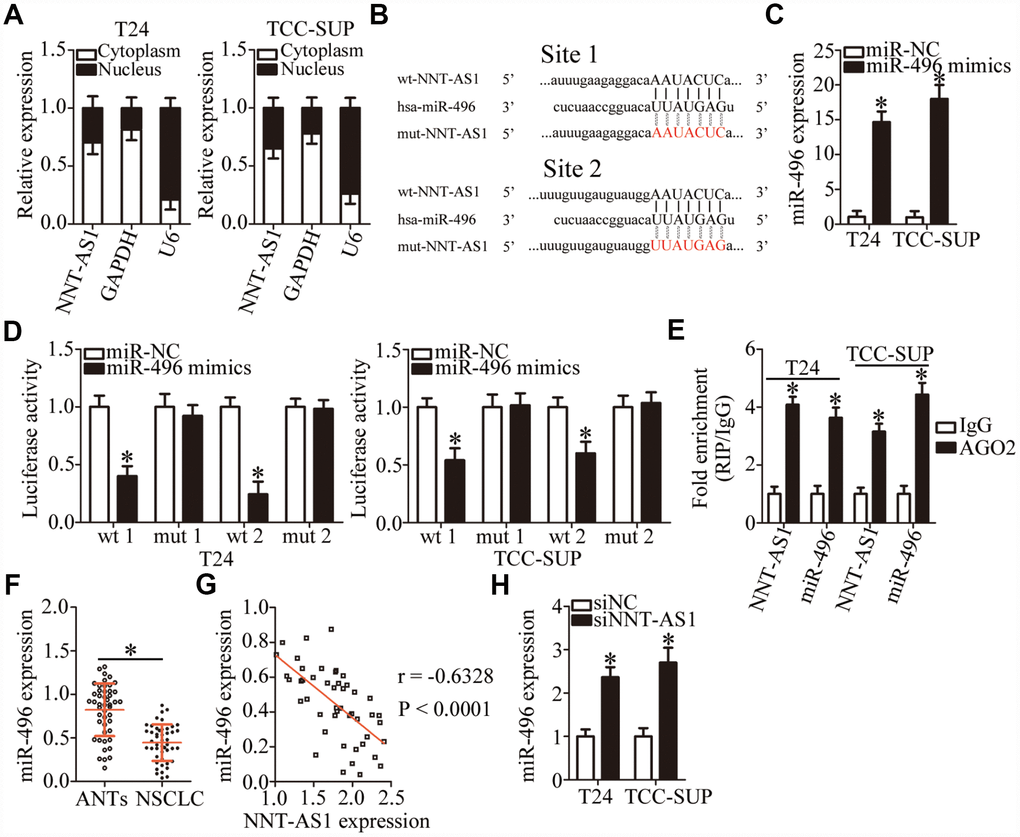
Figure 3. NNT-AS1 serves as a competing endogenous RNA (ceRNA) for miR-496 in bladder cancer cells. (A) Relative NNT-AS1 expression in nuclear and cytoplasmic fractions of T24 and TCC-SUP cells. (B) Bioinformatics prediction via starBase 3.0 uncovered two possible binding sites for miR-496 in NNT-AS1. (C) RT-qPCR was conducted to analyze miR-496 expression in T24 and TCC-SUP cells after introduction of either the miR-496 mimics or miR-NC. *P < 0.05 vs. group miR-NC. (D) Either plasmid wt-NNT-AS1 or mut-NNT-AS1 was cotransfected into T24 and TCC-SUP cells with either the miR-496 mimics or miR-NC for the measurement of luciferase activity. *P < 0.05 vs. the miR-NC group. (E) A RIP assay was carried out to determine the interaction between miR-496 and NNT-AS1 in T24 and TCC-SUP cells. *P < 0.05 vs. group IgG. (F) MiR-496 expression in 47 pairs of bladder cancer tissues and ANTs was assessed via RT-qPCR. *P < 0.05 vs. group ANTs. (G) The correlation between miR-496 and NNT-AS1 expression levels in the 47 bladder cancer tissue specimens was examined by Spearman’s correlation analysis. r = -0.6328, P < 0.0001. (H) The expression of miR-496 in NNT-AS1–depleted T24 and TCC-SUP cells was quantified by RT-qPCR. *P < 0.05 vs. siNC.
MiR-496 expression was then quantified in the 47 pairs of bladder cancer tissue specimens and matched ANTs. The results of RT-qPCR analysis revealed that miR-496 expression was significantly lower in bladder cancer tissues compared with that in ANTs (Figure 3F, P < 0.05) was inversely correlated with NNT-AS1 expression (Figure 3G; r = -0.6328, P < 0.0001). Finally, RT-qPCR analysis was performed to determine whether NNT-AS1 can sponge miR-496 in bladder cancer cells. The expression of miR-496 was substantially higher in the NNT-AS1–depleted T24 and TCC-SUP cells (Figure 3H, P < 0.05). Altogether, these results suggested that NNT-AS1 acts as a ceRNA and sponges miR-496 in bladder cancer cells.
HMGB1 is a direct target gene of miR-496 in bladder cancer cells
We then explored the biological functions of miR-496 in bladder cancer cells. T24 and TCC-SUP cells were transfected with either the miR-496 mimics or miR-NC, and then a series of functional experiments were carried out with the transfected cells. The CCK-8 assay and flow cytometry revealed that miR-496 upregulation significantly decreased proliferation (Figure 4A, P < 0.05) and increased apoptosis (Figure 4B, P < 0.05) of T24 and TCC-SUP cells. Additionally, ectopic miR-496 expression markedly decreased the number of migratory and invasive T24 and TCC-SUP cells, suggesting that miR-496 impaired the migration (Figure 4C, P < 0.05) and invasiveness (Figure 4D, P < 0.05) of bladder cancer cells. These findings suggested that miR-496 performs tumor-suppressive activities in bladder cancer cells by inhibiting cell proliferation, migration, and invasion and by promoting apoptosis.
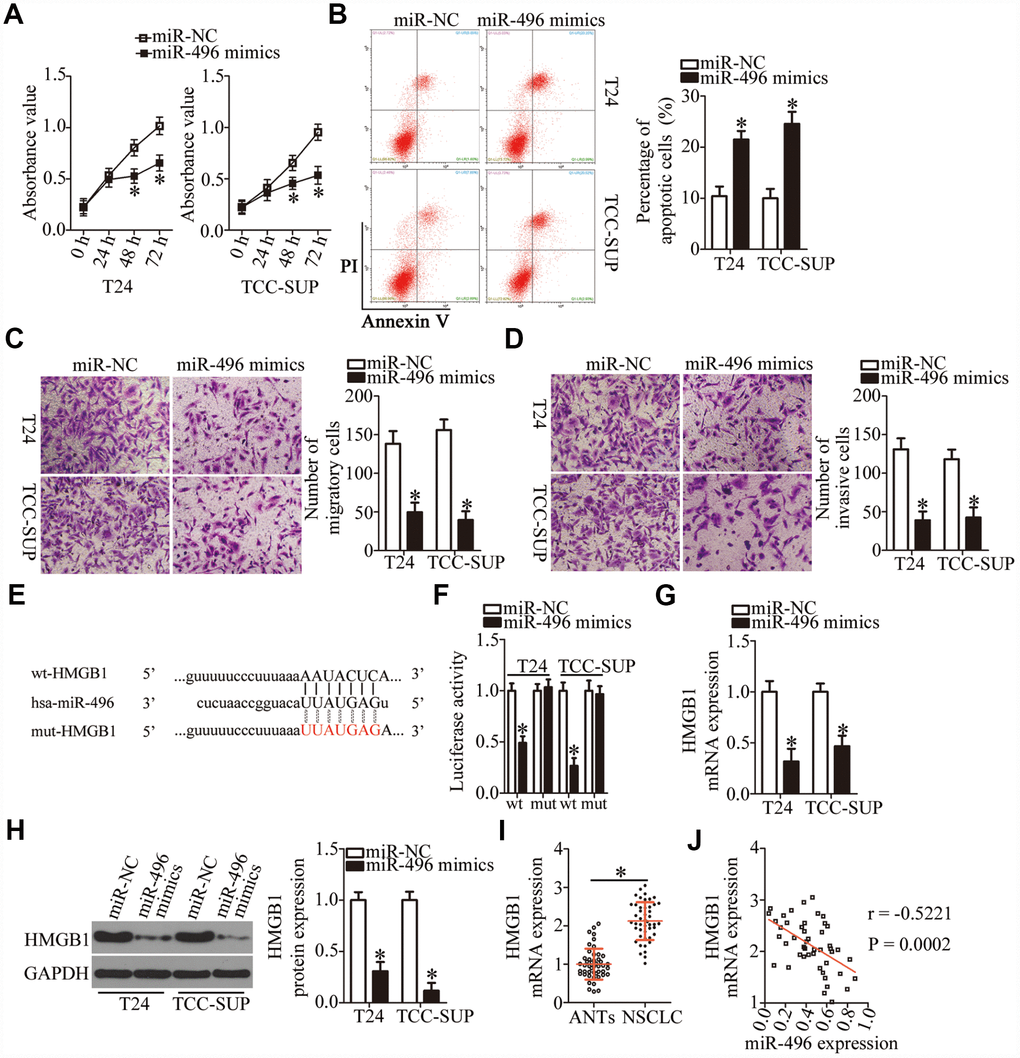
Figure 4. HMGB1 mRNA is a direct target of miR-496 in bladder cancer cells. (A) CCK-8 assay of the proliferation of T24 and TCC-SUP cells transfected with either the miR-496 mimics or miR-NC. *P < 0.05 vs. miR-NC. (B) The proportion of apoptotic miR-496–overexpressing T24 and TCC-SUP cells was detected by flow-cytometric analysis. *P < 0.05 vs. group miR-NC. (C, D) The migratory and invasive abilities were examined in transwell migration and invasion assays involving T24 and TCC-SUP cells transfected with either the miR-496 mimics or miR-NC. *P < 0.05 vs. the miR-NC group. (E) The predicted wild-type and mutant miR-496–binding sequences in the 3′-UTR of HMGB1. (F) A reporter plasmid containing either a wild-type or mutant HMGB1 3′-UTR fragment was cotransfected in combination with either the miR-496 mimics or miR-NC into T24 and TCC-SUP cells, and luciferase activity was quantified. *P < 0.05 vs. the miR-NC group. (G, H) Detection of HMGB1 mRNA and protein expression levels in miR-496–overexpressing T24 and TCC-SUP cells by RT-qPCR and western blot analysis, respectively. *P < 0.05 vs. group miR-NC. (I) HMGB1 mRNA expression was analyzed by RT-qPCR in the 47 pairs of bladder cancer tissue specimens and ANTs. *P < 0.05 vs. group ANTs. (J) Assessment of the correlation between miR-496 expression and HMGB1 mRNA expression among the 47 bladder cancer tissue specimens was performed via Spearman’s correlation analysis. r = -0.5221, P = 0.0002.
To elucidate the mechanisms behind miR-496–mediated inhibition of bladder cancer progression, three miRNA target prediction databases were searched to predict functionally relevant targets of miR-496. The bioinformatics prediction showed that the 3′-UTR of HMGB1 mRNA matches the “seed sequence” of miR-496 (Figure 4E). To evaluate the possibility of binding between miR-496 and the 3′-UTR of HMGB1 mRNA, a luciferase reporter assay was performed on T24 and TCC-SUP cells after cotransfection with either the miR-496 mimics or miR-NC and either plasmid wt-HMGB1 (expressing luciferase mRNA containing the wild-type miR-496–binding site in the 3′-UTR of HMGB1) or the plasmid mut-HMGB1 (expressing luciferase mRNA containing a mutant miR-496–binding site in the 3′-UTR of HMGB1). The luciferase activity generated by the wt-HMGB1 reporter plasmid in T24 and TCC-SUP cells was strikingly decreased by miR-496 upregulation (P < 0.05), whereas the luciferase activity generated by the plasmid mut-HMGB1 was unaltered by cotransfection of miR-496 mimics (Figure 4F). In addition, resumption of miR-496 expression notably decreased HMGB1 expression at both mRNA (Figure 4G, P < 0.05) and protein (Figure 4H, P < 0.05) levels in T24 and TCC-SUP cells, as evidenced by RT-qPCR and western blotting. Furthermore, we found that HMGB1 mRNA was more strongly expressed in bladder cancer tissues than in ANTs (Figure 4I, P < 0.05). The high expression of HMGB1 showed a negative correlation with miR-496 expression among the 47 bladder cancer tissue specimens (Figure 4J; r = -0.5221, P = 0.0002). Collectively, these data suggested that HMGB1 mRNA is a direct target of miR-496 in bladder cancer cells.
Tumor-suppressive effects of miR-496 in bladder cancer cells are mediated by downregulation of HMGB1
To investigate whether the miR-496–driven suppression of bladder cancer progression was mediated via direct targeting of HMGB1 mRNA, rescue experiments were conducted with T24 and TCC-SUP cells cotransfected with the miR-496 mimics and either the HMGB1-overexpressing plasmid pcDNA3.1-HMGB1 (hereafter: pc-HMGB1) or the empty pcDNA3.1 vector. The decrease in HMGB1 expression caused by miR-496 overexpression was reversed in T24 and TCC-SUP cells after cotransfection with pc-HMGB1 (Figure 5A, P < 0.05), as revealed by western blotting. Furthermore, functional experiments showed that miR-496 overexpression attenuated T24 and TCC-SUP cell proliferation (Figure 5B, P < 0.05), promoted apoptosis (Figure 5C, P < 0.05), and reduced cell migration (Figure 5D, P < 0.05) and invasion (Figure 5E, P < 0.05). These phenomena were abrogated by reintroduction of HMGB1 expression. Thus, miR-496 was confirmed as a tumor-suppressive miRNA inhibiting the malignant characteristics of bladder cancer cells at least partly by decreasing HMGB1 expression.
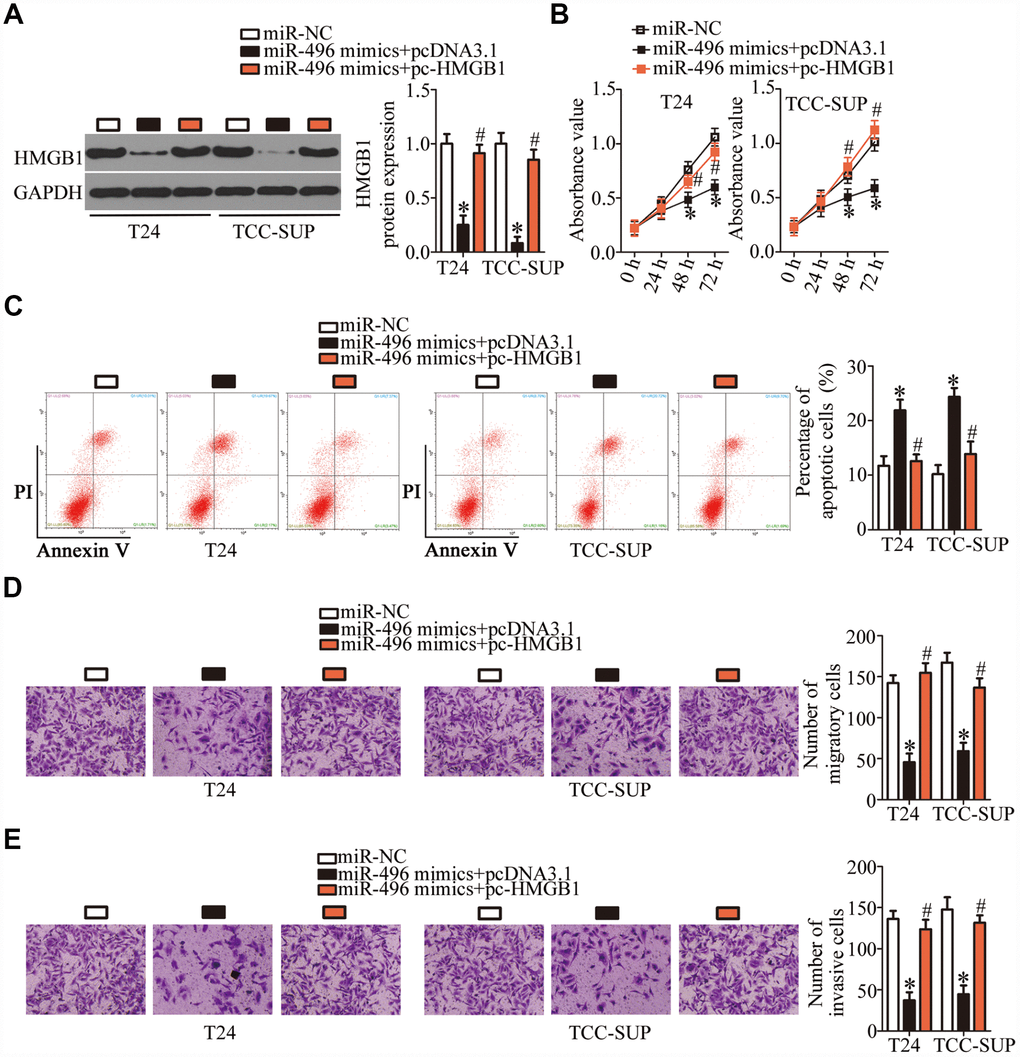
Figure 5. MiR-496 performs its tumor-suppressive actions in bladder cancer cells by decreasing HMGB1 expression. (A) The miR-496 mimics in combination with either the HMGB1-overexpressing plasmid pc-HMGB1 or the empty pcDNA3.1 vector was cotransfected into T24 and TCC-SUP cells. At 72 h post-transfection, western blotting was performed to analyze HMGB1 expression. *P < 0.05 vs. the miR-NC group. #P < 0.05 vs. the miR-496 mimics+pcDNA3.1 group. (B, C) The proliferative and apoptotic activities of T24 and TCC-SUP cells after cotransfection with the miR-496 mimics and either pc-HMGB1 or pcDNA3.1 were evaluated through the CCK-8 assay and flow-cytometric analysis, respectively. *P < 0.05 vs. the miR-NC group. #P < 0.05 vs. group miR-496 mimics+pcDNA3.1. (D, E) Transwell migration and invasion assays were conducted to examine the migratory and invasive abilities of T24 and TCC-SUP cells after cotransfection with the miR-496 mimics and either pc-HMGB1 or pcDNA3.1. *P < 0.05 vs. group miR-NC. #P < 0.05 vs. the miR-496 mimics+pcDNA3.1 group.
A reduction in NNT-AS1 expression suppresses the malignant phenotype of bladder cancer cells by inhibiting miR-496–HMGB1 axis output
A series of rescue experiments were conducted to determine whether the oncogenic roles of NNT-AS1 in bladder cancer progression were mediated by the miR-496–HMGB1 pathway. First, the transfection efficiency of the miR-496 inhibitor was assessed by RT-qPCR (Figure 6A, P < 0.05). After that, siNNT-AS1 in combination with either the miR-496 inhibitor or NC inhibitor was introduced into T24 and TCC-SUP cells. As shown by RT-qPCR, miR-496 inhibitor cotransfection reversed the stimulatory effect of NNT-AS1 knockdown on miR-496 expression in T24 and TCC-SUP cells (Figure 6B, P < 0.05). Similarly, the decrease in HMGB1 protein expression caused by siNNT-AS1 was reversed in T24 and TCC-SUP cells after cotransfection with the miR-496 inhibitor (Figure 6C, P < 0.05). Furthermore, the effects of NNT-AS1 knockdown on the proliferation (Figure 6D, P < 0.05), apoptosis (Figure 6E, P < 0.05), migration (Figure 6F, P < 0.05), and invasiveness (Figure 6G, P < 0.05) of T24 and TCC-SUP cells were neutralized by the miR-496 inhibitor. Thus, these findings revealed that the miR-496–HMGB1 axis was essential for the effects of NNT-AS1 on the malignant characteristics of bladder cancer cells.
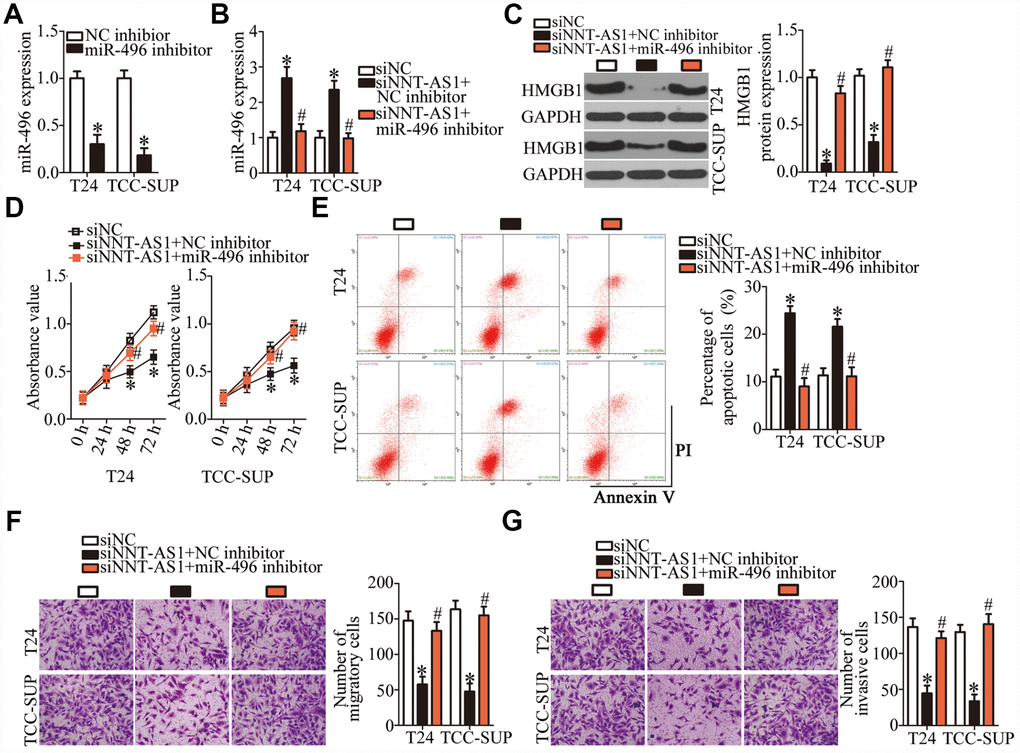
Figure 6. The oncogenic functions of NNT-AS1 in bladder cancer cells are mediated by stimulation of the miR-496–HMGB1 axis output. (A) T24 and TCC-SUP cells were transfected with either the miR-496 inhibitor or NC inhibitor. After 48 h, the transfection efficiency was assessed by RT-qPCR. *P < 0.05 vs. NC inhibitor. (B, C) siNNT-AS1 plus either the miR-496 inhibitor or NC inhibitor were cotransfected into T24 and TCC-SUP cells. The miR-496 and HMGB1 protein levels were measured by RT-qPCR and western blotting, respectively. *P < 0.05 vs. group siNC. #P < 0.05 vs. group siNNT-AS1+NC inhibitor. (D–G) CCK-8 assay, flow-cytometric analysis, and transwell migration and invasion assays were performed to determine the status of proliferation, apoptosis, migration, and invasiveness of T24 and TCC-SUP cells that were cotransfected with siNNT-AS1 and either the miR-496 inhibitor or NC inhibitor. *P < 0.05 vs. the siNC group. #P < 0.05 vs. group siNNT-AS1+NC inhibitor.
NNT-AS1 knockdown decreases the tumor growth of bladder cancer cells in vivo
A tumor xenograft assay was carried out to test the influence of NNT-AS1 on the tumor growth of bladder cancer cells in vivo. All nude mice were randomly subdivided into two groups: One group was inoculated with siNNT-AS1–transfected T24 cells; T24 cells transfected with siNC were injected into the mice in the other group. On day 28, all the mice were euthanized, and the tumor xenografts were resected and weighed. Representative images are presented in Figure 7A. The volume of tumor xenografts in the siNNT-AS1 group was notably smaller in comparison with the siNC group (Figure 7B, P < 0.05). The weight of the tumor xenografts was significantly lower in the siNNT-AS1 group compared with the siNC group (Figure 7C, P < 0.05). Total RNA and protein were then extracted from tumor xenografts, and NNT-AS1, miR-496, and HMGB1 protein expression were measured. This analysis indicated that tumor xenografts derived from siNNT-AS1–transfected T24 cells featured lower NNT-AS1 (Figure 7D, P < 0.05) and HMGB1 protein expression (Figure 7E, P < 0.05) as well as higher miR-496 expression (Figure 7F, P < 0.05) compared with the siNC group. Overall, these data indicated that the NNT-AS1 knockdown restricted the growth of bladder cancer cells in vivo through the miR-496–HMGB1 axis.
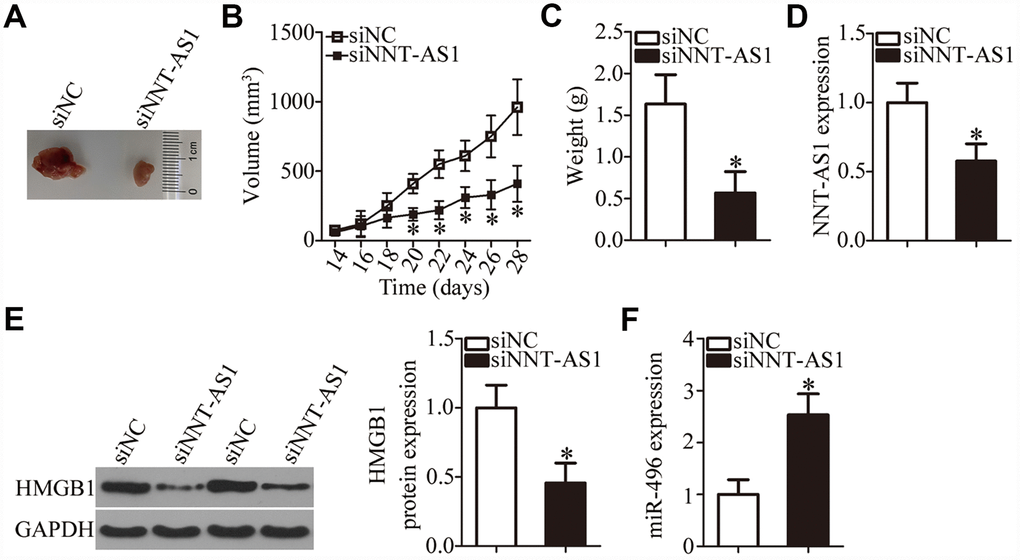
Figure 7. Knockdown of NNT-AS1 impairs bladder cancer cell growth in vivo. All the mice were injected with T24 cells that were transfected with either siNNT-AS1 or siNC. (A) Representative images of tumor xenografts collected from groups siNNT-AS1 and siNC. (B) The growth curves of subcutaneous tumor xenografts in groups siNNT-AS1 and siNC. *P < 0.05 vs. the siNC group. (C) The weights of tumor xenografts derived from either siNNT-AS1–transfected or siNC-transfected T24 cells were measured at 4 weeks post-inoculation. *P < 0.05 vs. group siNC. (D) NNT-AS1 expression in tumor xenografts obtained from groups siNNT-AS1 and siNC was evaluated via RT-qPCR. *P < 0.05 vs. the siNC group. (E) Western-blotting assessment of HMGB1 expression in the tumor xenografts derived from either siNNT-AS1–transfected or siNC-transfected T24 cells. *P < 0.05 vs. the siNC group. (F) MiR-496 expression in tumor xenografts obtained from both groups was evaluated via RT-qPCR. *P < 0.05 vs. the siNC group.
Discussion
LncRNAs have been attracting increasing attention in recent years [50, 51]. Abnormal expression of lncRNAs has been discovered in bladder cancer, and their aberrant functions play a key part in the genesis and progression of this cancer, with lncRNAs functioning as tumor suppressors or oncogenic RNA [52, 53]. Hence, investigation of the activities of lncRNAs in bladder cancer may help to identify effective targets for anticancer therapies. Nevertheless, only a handful of lncRNAs have been studied in detail. In this work, we first tested whether NNT-AS1 is dysregulated in bladder cancer and assessed its clinical value among patients with bladder cancer. Second, we applied siRNA to silence endogenous NNT-AS1 expression in bladder cancer cells in order to investigate the biological effects of NNT-AS1 on the aggressive characteristics of these cells in vitro and in vivo. Third, the mechanisms underlying the activities of NNT-AS1 in bladder cancer cells were explored.
NNT-AS1 is upregulated in osteosarcoma, and this upregulation significantly correlates with tumor size, Enneking stage, and tumor metastasis [33, 34]. Remarkably, NNT-AS1 is known as an independent and significant risk factor predicting survival among patients with osteosarcoma [33]. NNT-AS1 is also overexpressed in gastric cancer [35, 36]. Increased expression of NNT-AS1 is closely associated with the tumor stage, lymph node metastasis, and TNM stage [35]. Patients with gastric cancer featuring high NNT-AS1 expression manifest shorter overall survival than do the patients with low NNT-AS1 expression [35]. NNT-AS1 is also highly expressed in non–small cell lung cancer [37, 38], ovarian cancer [39], breast cancer [40], hepatocellular carcinoma [41], and cervical cancer [42]. Nevertheless, whether NNT-AS1 is dysregulated in bladder cancer has remained unknown. Our results indicated that the expression of NNT-AS1 is high in bladder cancer tissues and cell lines. The high NNT-AS1 expression correlated with the clinical stage and lymph node metastasis among our bladder cancer patients. Patients with bladder cancer in the high-NNT-AS1 group had a worse prognosis than those in the low-NNT-AS1 group. Our findings suggest that NNT-AS1 may be a promising biomarker for the diagnosis and prognosis of bladder cancer.
NNT-AS1 performs an oncogenic function in osteosarcoma by promoting cell proliferation, migration, and invasion and by suppressing cell cycle arrest and apoptosis [33, 34]. NNT-AS1 knockdown attenuates gastric cancer cell proliferation and invasion in vitro, promotes cell cycle arrest, and hinders in vivo tumor growth [35, 36]. In non–small cell lung cancer, knockdown of NNT-AS1 inhibits cell proliferation, colony formation, and invasion and induces apoptosis, cell cycle arrest, and cisplatin chemoresistance [37, 38]. Nevertheless, the influence of NNT-AS1 on the biological functions of bladder cancer has been unclear. In this study, a series of functional experiments revealed that NNT-AS1 knockdown restricts cell proliferation, migration, and invasion and facilitates apoptosis in vitro as well as slows tumor growth in vivo.
One of the main roles of lncRNAs is functioning as a ceRNA in a regulatory network involving lncRNA, miRNA, and target mRNA [54]. Here, the underlying mechanisms of NNT-AS1 activity in the malignancy of bladder cancer cells were explored. We demonstrated that NNT-AS1 can raise HMGB1 expression by functioning as a ceRNA for miR-496. The latter is known to be downregulated in colorectal cancer [46], non–small cell lung cancer [47], glioma [48], and osteosarcoma [49]. MiR-496 exerts tumor-suppressive actions on these human cancer types [46–49]. In our study, for the first time, miR-496 was found to be downregulated in bladder cancer and to directly target HMGB1 mRNA to restrain the aggressive phenotype of bladder cancer. Moreover, we found that miR-496 can be sponged by NNT-AS1, and the miR-496–HMGB1 axis is responsible for the oncogenic roles of NNT-AS1.
HMGB1, encoded within chromosomal region 8q22, is a highly conserved DNA-binding protein. It can relocate from the cytoplasm to the nucleus and interact with transcription factors, nucleosomes, and histones [55]. HMGB1 is upregulated in bladder cancer and is closely associated with the tumor grade and tumor stage [56, 57]. Patients with bladder cancer featuring high HMGB1 expression have shorter disease-free survival and overall survival [56]. In addition, HMGB1 has been confirmed as an independent prognostic factor in bladder cancer [56]. HMGB1 exerts oncogenic effects on the formation and progression of bladder cancer and participates in the modulation of tumor cell proliferation, apoptosis, cell cycle, metastasis, radioresistance, and tumorigenesis [58]. In this study, we illustrated a novel upstream mechanism regulating the expression of HMGB1 in bladder cancer cells in vitro and in vivo. NNT-AS1, which contains an miR-496–binding site, was found to function as a ceRNA and to sponge miR-496, thereby increasing HMGB1 expression.
A weakness of the manuscript was that the bladder cancer samples have been studied from the same discovery cohort of patients as those assessed for survival and clinical behavior. A separate cohort of patients independent of the discovery cohort would have been studied as a validation cohort. We will resolve this weakness in our further investigations.
In summary, our results revealed that knockdown of NNT-AS1 suppresses the malignant phenotype of bladder cancer cells in vitro and in vivo. In terms of the mechanism, NNT-AS1 acts as a ceRNA on miR-496, thereby reversing the tumor-suppressive influence of miR-496 on HMGB1 expression. Thus, the NNT-AS1–miR-496–HMGB1 pathway is an important player in the malignancy of bladder cancer, suggesting that this pathway may be an effective target for anticancer therapies.
Materials and Methods
Ethics statement
This investigation was conducted in accordance with the ethical standards of the Declaration of Helsinki and national and international guidelines and was approved by the authors' institutional review board. This study was approved by the Ethics Committee of the Fourth Affiliated Hospital of Nantong Medical College. Informed consent was obtained. The experimental procedures involving animals were approved by the Animal Ethics Committee of the Fourth Affiliated Hospital of Nantong Medical College. Every effort was made to minimize the suffering of the mice.
Clinical specimens
Sample were collected from consenting patients. Forty-seven pairs of bladder cancer tissue specimens and matched ANTs were obtained from the hospital between May 2013 to June 2014. Patients who were treated with preoperative radiotherapy, chemotherapy, or other anticancer modalities were excluded from this study. All tumor specimens were immediately frozen and stored in liquid nitrogen until RNA isolation.
Cell culture
Four human bladder cancer cell lines (T24, 5637, UM-UC-3, and TCC-SUP) and a normal bladder immortalized epithelial cell line (SV-HUC-1) were used in this study. These cell lines were bought from the Shanghai Institute of Biochemistry and Cell Biology (Shanghai, China) and were maintained in Dulbecco’s modified Eagle’s medium (DMEM) containing 10% of fetal bovine serum (FBS), 100 U/ml penicillin, and 100 μg/ml streptomycin (all from Gibco; Thermo Fisher Scientific, Inc., Waltham, MA, USA). All the cells were kept in a humidified incubator with 5% circulating CO2 at 37°C.
Transient transfection
The siRNAs specific to NNT-AS1 (siNNT-AS1) and negative control (NC) siRNA (siNC) were purchased from Guangzhou Ribobio Technology (Guangzhou, China). The miR-496 mimics, NC miRNA mimics (miR-NC), miR-496 inhibitor, and NC inhibitor were chemically synthesized by Shanghai GenePharma Technology (Shanghai, China). The HMGB1-overexpressing plasmid (pc-HMGB1) and the empty pcDNA3.1 vector were acquired from Shanghai Sangon Biotech Co., Ltd. (Shanghai, China). All transient transfection procedures were carried out using Lipofectamine® 2000 (Invitrogen; Thermo Fisher Scientific, Inc.). The transfected cells were collected after different periods of incubation and were subjected to the subsequent experiments.
RT-qPCR
RNA isolation from the tissue specimens and cultured cells was performed using TRIzol® reagent (Invitrogen; Thermo Fisher Scientific, Inc.). The concentration of total RNA was determined on a NanoDrop 2000/2000C spectrophotometer (Invitrogen; Thermo Fisher Scientific, Inc.). To quantify miR-496 expression, reverse transcription was conducted to prepare first-strand complementary DNA (cDNA) using the miScript Reverse Transcription Kit (Qiagen GmbH, Hilden, Germany). Next, the miScript SYBR Green PCR Kit (Qiagen GmbH) was utilized for quantitative PCR on an ABI PRISM™ 7900 HT Sequence Detection System (Applied Biosystems, USA). The thermocycling conditions for qPCR were as follows: 95°C for 2 min, 95°C for 10 sec, 55°C for 30 sec and 72°C for 30 sec, for 40 cycles. The expression level of miR-496 was normalized to that of U6 small nuclear RNA.
For the measurement of NNT-AS1 and HMGB1 mRNA expression, cDNA was produced using the Prime-Script RT Reagent Kit (Takara Biotechnology Co., Ltd., Dalian, China). The synthesized cDNA was then subjected to PCR amplification with SYBR Premix Ex Taq (Takara Biotechnology Co., Ltd). The thermocycling conditions for qPCR were as follows: 5 min at 95°C, followed by 40 cycles of 95°C for 30 sec and 65°C for 45 sec. Glyceraldehyde-3-phosphate dehydrogenase (GAPDH) served as the normalization control for NNT-AS1 and HMGB1. Relative gene expression was analyzed by the 2−ΔΔCq method.
The primers for PCR were as follows: miR-496: forward, 5′-ACACTCCAGCTGGGAATGGAGGTTG TCCATGGTG-3′; reverse, 5′-CTCAACTGGTGTCGT GGAGTCGGCAATTCAGTTGAGGAGTACCG-3′; U6 forward, 5′-CGTTTTACTTCCTCATACAGCAC-3′; reverse, 5′-GCACCAAGAGACCTGTGACA-3′; NNT-AS1: forward, 5′- AGTTCCACCAAGTTTCTTCA-3′; reverse, 5′-AGGTTTTGCCAGCATAGAC-3′; HMGB1 forward, 5′-GCTCAGAGAGGTGGAAGACCA-3′; reverse, 5′-GGTGCATTGGGATCCTTGAA-3′; GAPDH forward, 5′-TGCACCACCAACTGCTTA-3′; reverse, 5′-GGATGCAGGGATGATGTTC-3′.
CCK-8 assay
Transfected cells were collected 24 h after incubation, and a single-cell suspension was prepared with DMEM containing 10% of FBS to a final concentration of 2 × 10⁴ cells/ml. A total of 100 μl of the cell suspension was seeded in each well. Then, the cells were incubated at 37°C for 0, 24, 48, or 72 h, after which 100 μl of the CCK-8 solution (Sigma-Aldrich; Merck KGaA) was added into each well. After additional 2 h of incubation at 37°C and 5% CO2, absorbance was detected at an excitation wavelength of 450 nm on a microplate reader (Molecular Devices, Sunnyvale, CA, USA).
Detection of apoptosis via flow-cytometric analysis
After 48 h of cultivation, transfected cells were detached using 0.25% trypsin without EDTA, washed with ice-cold PBS, and centrifuged at 4°C for 10 min. The proportion of apoptotic cells was determined with an Annexin V-Fluorescein Isothiocyanate (FITC) Apoptosis Detection Kit (Biolegend, San Diego, CA, USA). Briefly, cells were resuspended in 100 μl of binding buffer, and the suspension was then mixed with 5 μl of Annexin V-FITC and 5 μl of a propidium iodide solution, followed by 15 min incubation at room temperature in darkness. A FACScan flow cytometer (BD Biosciences, San Jose, CA, USA) was used to detect apoptotic cells.
Transwell migration and invasion assays
Transwell chambers (8.0 μm pore size; BD Biosciences) precoated with Matrigel (BD Biosciences) were employed to evaluate the capacity of cells to invade. Transfected cells were harvested at 48 h post-transfection, and a cell suspension was prepared in FBS-free DMEM. The suspension concentration was adjusted to 2.5 × 10⁵ cells/ml. In total, 200 μl of the cell suspension was added into the upper compartments, while the lower compartments were covered with 800 μl of DMEM containing 20% of FBS. After 24 h of incubation, the noninvasive cells remaining on the upper surface were wiped off with a cotton swab. The cells that went through the pores and were located on the lower surface were fixed in 4% paraformaldehyde, stained with 0.1% crystal violet, and extensively washed. After drying, the invasive cells were imaged and subsequently counted under an inverted light microscope (Leica, Wetzlar, Germany). The average number of invasive cells was determined from five randomly selected visual fields and used to represent the invasive ability. The transwell migration assay was carried out in accordance with the same experimental procedures, but the chambers were not coated with Matrigel.
Tumor xenograft assay
Female 6-week-old BALB/c nude mice were purchased from Shanghai Pharmaceutical Research Institute (Shanghai, China) and were subcutaneously injected with T24 cells harboring either siNNT-AS1 or siNC. Each group contained four nude mice. The animals were maintained under specific pathogen-free conditions (25°C, 50% humidity, 10-h light/14-h dark cycle) and libitum food/water access. Measurement of tumor volumes was started two weeks after the injection and carried out every 2 days. The volume of tumor xenografts was calculated using the following formula: tumor volume (mm3) = 0.5 × width2 (mm2) × length (mm). All the mice were euthanized via cervical dislocation at 4 weeks post injection, and the tumor xenografts were resected. After weighing, the tumor xenografts were stored in liquid nitrogen for further use.
Subcellular fractionation
A PARIS Kit (Invitrogen; Thermo Fisher Scientific, Inc.) was utilized to separate the cytoplasmic and nuclear fractions of T24 and TCC-SUP cells. Total RNA was then isolated separately and subjected to RT-qPCR analysis for the determination of the intracellular distribution of NNT-AS1.
RIP assay
A Magna RNA-binding Protein Immunoprecipitation Kit (Millipore, Billerica, MA, USA) was used to conduct a RIP assay to evaluate the binding interaction between NNT-AS1 and miR-496 in bladder cancer cells. Cells were treated with RIP Lysis Buffer (Shanghai Haoran Biotechnology Co., Ltd., Shanghai, China). After 10 min of incubation followed by centrifugation at 4°C, the obtained cell extract was incubated with magnetic beads that were conjugated with either an anti–Argonaute 2 antibody (AGO2) or anti-IgG antibody (Millipore). Proteinase K was chosen to digest proteins prior to the isolation of immunoprecipitated RNA. The expression of NNT-AS1 and miR-496 in the immunoprecipitated RNA was measured by RT-qPCR as described above.
Bioinformatics analysis
A bioinformatic algorithm, starBase 3.0 (http://starbase.sysu.edu.cn/), was used to predict the miRNA interacting with NNT-AS1.
The putative target genes of miR-496 were predicted via three bioinformatic algorithms, including starBase 3.0, TargetScan (http://www.targetscan.org/), and miRDB (http://mirdb.org/).
Luciferase reporter assay
The fragment of NNT-AS1 containing either the wild-type (wt) or mutant (mut) miR-496–binding sequence (one of two versions) was chemically synthesized by Shanghai GenePharma Technology and inserted into the pmirGLO luciferase reporter plasmid, resulting in the plasmids wt-NNT-AS1 and mut-NNT-AS1, respectively. The reporter plasmids wt-HMGB1 and mut-HMGB1 were constructed in the same way. For the reporter assay, the miR-496 mimics or miR-NC plus wt or mut reporter plasmid was introduced into cells using Lipofectamine® 2000. The firefly luciferase activity was detected via a Dual-Luciferase® Reporter Assay System (Promega, Madison, WI, USA) and was normalized to Renilla luciferase activity.
Western blot analysis
Total protein was extracted from tissues or cells using RIP Lysis Buffer, after which protein concentration was quantified with the BCA Protein Assay Kit (Beyotime Institute of Biotechnology, Shanghai, China). Equal amounts of protein were separated by gel electrophoresis using an SDS–polyacrylamide 10% gel and transferred to polyvinylidene difluoride (PVDF) membranes. The membranes were then blocked with 5% fat-free milk in Tris-buffered saline containing 0.1% Tween 20 (TBST) at room temperature for 2 h, followed by overnight incubation at 4°C with a primary antibody against either HMGB1 (ab79823; 1:1000 dilution; Abcam, Cambridge, MA, USA) or GAPDH (ab181602; 1:1000 dilution; Abcam). After three rinses with TBST, a horseradish peroxidase–conjugated goat anti-rabbit IgG secondary antibody (ab205718; 1:5000 dilution; Abcam) was added to the membrane and incubated for another 2 h at room temperature. The protein signals were detected using Pierce™ ECL Western Blotting Substrate (Pierce Biotechnology, Inc., Rockford, IL, USA). GAPDH served as the loading control.
Statistical analysis
Each assay was repeated at least three times. All the data are presented as the mean ± standard deviation (SD) and were analyzed with SPSS 21.0 software (IBM Corp., Armonk, NY, USA). The correlations between NNT-AS1 levels and clinical characteristics of the patients with bladder cancer were determined using the chi-square (χ2) test. Spearman's correlation analysis was employed to test the expression correlation between NNT-AS1 and miR-496 in bladder cancer tissues. Student’s t test was carried out for evaluating the differences between two groups. Comparisons among multiple groups were conducted via one-way analysis of variance followed by Tukey’s test. The association of NNT-AS1 with the overall survival of patients with bladder cancer was tested by the Kaplan–Meier method and log rank test. Data with a P value < 0.05 were considered statistically significant.
Conflicts of Interest
The authors declare that they have no conflicts of interests.
Funding
This study was not funded by any commercial or not-for-profit agencies.
References
- 1. Ferlay J, Shin HR, Bray F, Forman D, Mathers C, Parkin DM. Estimates of worldwide burden of cancer in 2008: GLOBOCAN 2008. Int J Cancer. 2010; 127:2893–917. https://doi.org/10.1002/ijc.25516 [PubMed]
- 2. Torre LA, Bray F, Siegel RL, Ferlay J, Lortet-Tieulent J, Jemal A. Global cancer statistics, 2012. CA Cancer J Clin. 2015; 65:87–108. https://doi.org/10.3322/caac.21262 [PubMed]
- 3. Knowles MA. Molecular subtypes of bladder cancer: jekyll and Hyde or chalk and cheese? Carcinogenesis. 2006; 27:361–73. https://doi.org/10.1093/carcin/bgi310 [PubMed]
- 4. Kim WJ, Bae SC. Molecular biomarkers in urothelial bladder cancer. Cancer Sci. 2008; 99:646–52. https://doi.org/10.1111/j.1349-7006.2008.00735.x [PubMed]
- 5. Amit D, Tamir S, Birman T, Gofrit ON, Hochberg A. Development of targeted therapy for bladder cancer mediated by a double promoter plasmid expressing diphtheria toxin under the control of IGF2-P3 and IGF2-P4 regulatory sequences. Int J Clin Exp Med. 2011; 4:91–102. https://doi.org/10.1186/1479-5876-8-134 [PubMed]
- 6. Miñana B, Cózar JM, Palou J, Unda Urzaiz M, Medina-Lopez RA, Subirá Ríos J, de la Rosa-Kehrmann F, Chantada-Abal V, Lozano F, Ribal MJ, Rodríguez Fernández E, Castiñeiras Fernández J, Concepción Masip T, et al. Bladder cancer in Spain 2011: population based study. J Urol. 2014; 191:323–28. https://doi.org/10.1016/j.juro.2013.08.049 [PubMed]
- 7. Martínez-Fernández M, Feber A, Dueñas M, Segovia C, Rubio C, Fernandez M, Villacampa F, Duarte J, López-Calderón FF, Gómez-Rodriguez MJ, Castellano D, Rodriguez-Peralto JL, de la Rosa F, et al. Analysis of the Polycomb-related lncRNAs HOTAIR and ANRIL in bladder cancer. Clin Epigenetics. 2015; 7:109. https://doi.org/10.1186/s13148-015-0141-x [PubMed]
- 8. Hassen W, Droller MJ. Current concepts in assessment and treatment of bladder cancer. Curr Opin Urol. 2000; 10:291–99. https://doi.org/10.1097/00042307-200007000-00002 [PubMed]
- 9. Stein JP, Lieskovsky G, Cote R, Groshen S, Feng AC, Boyd S, Skinner E, Bochner B, Thangathurai D, Mikhail M, Raghavan D, Skinner DG. Radical cystectomy in the treatment of invasive bladder cancer: long-term results in 1,054 patients. J Clin Oncol. 2001; 19:666–75. https://doi.org/10.1200/JCO.2001.19.3.666 [PubMed]
- 10. Wu D, Zhou Y, Pan H, Zhou J, Fan Y, Qu P. microRNA-99a inhibiting cell proliferation, migration and invasion by targeting fibroblast growth factor receptor 3 in bladder cancer. Oncol Lett. 2014; 7:1219–24. https://doi.org/10.3892/ol.2014.1875 [PubMed]
- 11. Bao Z, Yang Z, Huang Z, Zhou Y, Cui Q, Dong D. LncRNADisease 2.0: an updated database of long non-coding RNA-associated diseases. Nucleic Acids Res. 2019; 47:D1034–37. https://doi.org/10.1093/nar/gky905 [PubMed]
- 12. Chiu HS, Somvanshi S, Patel E, Chen TW, Singh VP, Zorman B, Patil SL, Pan Y, Chatterjee SS; Cancer Genome Atlas Research Network, Sood AK, Gunaratne PH, Sumazin P. Pan-Cancer Analysis of lncRNA Regulation Supports Their Targeting of Cancer Genes in Each Tumor Context. Cell Rep. 2018; 23:297–312.e12. https://doi.org/10.1016/j.celrep.2018.03.064 [PubMed]
- 13. Mercer TR, Dinger ME, Mattick JS. Long non-coding RNAs: insights into functions. Nat Rev Genet. 2009; 10:155–59. https://doi.org/10.1038/nrg2521 [PubMed]
- 14. Martens-Uzunova ES, Böttcher R, Croce CM, Jenster G, Visakorpi T, Calin GA. Long noncoding RNA in prostate, bladder, and kidney cancer. Eur Urol. 2014; 65:1140–51. https://doi.org/10.1016/j.eururo.2013.12.003 [PubMed]
- 15. Xiao H, Tang K, Liu P, Chen K, Hu J, Zeng J, Xiao W, Yu G, Yao W, Zhou H, Li H, Pan Y, Li A, et al. LncRNA MALAT1 functions as a competing endogenous RNA to regulate ZEB2 expression by sponging miR-200s in clear cell kidney carcinoma. Oncotarget. 2015; 6:38005–15. https://doi.org/10.18632/oncotarget.5357 [PubMed]
- 16. Hua Q, Lv X, Gu X, Chen Y, Chu H, Du M, Gong W, Wang M, Zhang Z. Genetic variants in lncRNA H19 are associated with the risk of bladder cancer in a Chinese population. Mutagenesis. 2016; 31:531–38. https://doi.org/10.1093/mutage/gew018 [PubMed]
- 17. Hu X, Feng H, Huang H, Gu W, Fang Q, Xie Y, Qin C, Hu X. Downregulated Long Noncoding RNA PART1 Inhibits Proliferation and Promotes Apoptosis in Bladder Cancer. Technol Cancer Res Treat. 2019; 18:1533033819846638. https://doi.org/10.1177/1533033819846638 [PubMed]
- 18. Jiang D, Zhang Y, Yang L, Lu W, Mai L, Guo H, Liu X. Long noncoding RNA HCG22 suppresses proliferation and metastasis of bladder cancer cells by regulation of PTBP1. J Cell Physiol. 2020; 235:1711–1722. https://doi.org/10.1002/jcp.29090 [PubMed]
- 19. Li G, Zhang Y, Mao J, Hu P, Chen Q, Ding W, Pu R. lncRNA TUC338 is a potential diagnostic biomarker for bladder cancer. J Cell Biochem. 2019; 120:18014–19. https://doi.org/10.1002/jcb.29104 [PubMed]
- 20. Zhao X, Wang D, Ding Y, Zhou J, Liu G, Ji Z. lncRNA ZEB1-AS1 promotes migration and metastasis of bladder cancer cells by post-transcriptional activation of ZEB1. Int J Mol Med. 2019; 44:196–206. https://doi.org/10.3892/ijmm.2019.4187 [PubMed]
- 21. Zhang C, Wang W, Lin J, Xiao J, Tian Y. lncRNA CCAT1 promotes bladder cancer cell proliferation, migration and invasion. Int Braz J Urol. 2019; 45:549–59. https://doi.org/10.1590/s1677-5538.ibju.2018.0450 [PubMed]
- 22. Jiang F, Qi W, Wang Y, Wang W, Fan L. lncRNA PEG10 promotes cell survival, invasion and migration by sponging miR-134 in human bladder cancer. Biomed Pharmacother. 2019; 114:108814. https://doi.org/10.1016/j.biopha.2019.108814 [PubMed]
- 23. Dong P, Xiong Y, Yue J, J B Hanley S, Kobayashi N, Todo Y, Watari H. Exploring lncRNA-Mediated Regulatory Networks in Endometrial Cancer Cells and the Tumor Microenvironment: Advances and Challenges. Cancers (Basel). 2019; 11:234. https://doi.org/10.3390/cancers11020234 [PubMed]
- 24. Flippot R, Beinse G, Boilève A, Vibert J, Malouf GG. Long non-coding RNAs in genitourinary malignancies: a whole new world. Nat Rev Urol. 2019; 16:484–504. https://doi.org/10.1038/s41585-019-0195-1 [PubMed]
- 25. Ambros V. The functions of animal microRNAs. Nature. 2004; 431:350–55. https://doi.org/10.1038/nature02871 [PubMed]
- 26. Lu J, Getz G, Miska EA, Alvarez-Saavedra E, Lamb J, Peck D, Sweet-Cordero A, Ebert BL, Mak RH, Ferrando AA, Downing JR, Jacks T, Horvitz HR, Golub TR. MicroRNA expression profiles classify human cancers. Nature. 2005; 435:834–38. https://doi.org/10.1038/nature03702 [PubMed]
- 27. Wei XC, Lv ZH. MicroRNA-132 inhibits migration, invasion and epithelial-mesenchymal transition via TGFβ1/Smad2 signaling pathway in human bladder cancer. Onco Targets Ther. 2019; 12:5937–45. https://doi.org/10.2147/OTT.S201731 [PubMed]
- 28. Li Q, Wang H, Peng H, Huang Q, Huyan T, Huang Q, Yang H, Shi J. MicroRNAs: Key Players in Bladder Cancer. Mol Diagn Ther. 2019; 23:579–601. https://doi.org/10.1007/s40291-019-00410-4 [PubMed]
- 29. Tian H, Wang X, Lu J, Tian W, Chen P. MicroRNA-621 inhibits cell proliferation and metastasis in bladder cancer by suppressing Wnt/β-catenin signaling. Chem Biol Interact. 2019; 308:244–51. https://doi.org/10.1016/j.cbi.2019.05.042 [PubMed]
- 30. Sun W, Li S, Yu Y, Jin H, Xie Q, Hua X, Wang S, Tian Z, Zhang H, Jiang G, Huang C, Huang H. MicroRNA-3648 Is Upregulated to Suppress TCF21, Resulting in Promotion of Invasion and Metastasis of Human Bladder Cancer. Mol Ther Nucleic Acids. 2019; 16:519–30. https://doi.org/10.1016/j.omtn.2019.04.006 [PubMed]
- 31. Sugita S, Yoshino H, Yonemori M, Miyamoto K, Matsushita R, Sakaguchi T, Itesako T, Tatarano S, Nakagawa M, Enokida H. Tumor-suppressive microRNA-223 targets WDR62 directly in bladder cancer. Int J Oncol. 2019; 54:2222–36. https://doi.org/10.3892/ijo.2019.4762 [PubMed]
- 32. Fu S, Luan T, Jiang C, Huang Y, Li N, Wang H, Wang J. miR-3622a promotes proliferation and invasion of bladder cancer cells by downregulating LASS2. Gene. 2019; 701:23–31. https://doi.org/10.1016/j.gene.2019.02.083 [PubMed]
- 33. Ye H, Lin J, Yao X, Li Y, Lin X, Lu H. Overexpression of Long Non-Coding RNA NNT-AS1 Correlates with Tumor Progression and Poor Prognosis in Osteosarcoma. Cell Physiol Biochem. 2018; 45:1904–14. https://doi.org/10.1159/000487966 [PubMed]
- 34. Li C, Zhang S, Qiu T, Wang Y, Ricketts DM, Qi C. Upregulation of long non-coding RNA NNT-AS1 promotes osteosarcoma progression by inhibiting the tumor suppressive miR-320a. Cancer Biol Ther. 2019; 20:413–22. https://doi.org/10.1080/15384047.2018.1538612 [PubMed]
- 35. Chen B, Zhao Q, Guan L, Lv H, Bie L, Huang J, Chen XB. Long non-coding RNA NNT-AS1 sponges miR-424/E2F1 to promote the tumorigenesis and cell cycle progression of gastric cancer. J Cell Mol Med. 2018; 22:4751–59. https://doi.org/10.1111/jcmm.13726 [PubMed]
- 36. Wang X, Ren M, Li Y, Hu J, Lu G, Ma W, Guo D, Lu X, He S. Long noncoding RNA NNT-AS1 promotes gastric cancer proliferation and invasion by regulating microRNA-363 expression. J Cell Biochem. 2019; 120:5704–12. https://doi.org/10.1002/jcb.27855 [PubMed]
- 37. Shen Q, Jiang Y. LncRNA NNT-AS1 promotes the proliferation, and invasion of lung cancer cells via regulating miR-129-5p expression. Biomed Pharmacother. 2018; 105:176–81. https://doi.org/10.1016/j.biopha.2018.05.123 [PubMed]
- 38. Cai Y, Dong ZY, Wang JY. LncRNA NNT-AS1 is a major mediator of cisplatin chemoresistance in non-small cell lung cancer through MAPK/Slug pathway. Eur Rev Med Pharmacol Sci. 2018; 22:4879–87. https://doi.org/10.26355/eurrev_201808_15624 [PubMed]
- 39. Huang Y, Shi J, Xu Y. Long non-coding RNA NNT-AS1 contributes to cell proliferation, metastasis and apoptosis in human ovarian cancer. Oncol Lett. 2018; 15:9264–70. https://doi.org/10.3892/ol.2018.8492 [PubMed]
- 40. Li Y, Lv M, Song Z, Lou Z, Wang R, Zhuang M. Long non-coding RNA NNT-AS1 affects progression of breast cancer through miR-142-3p/ZEB1 axis. Biomed Pharmacother. 2018; 103:939–46. https://doi.org/10.1016/j.biopha.2018.04.087 [PubMed]
- 41. Lu YB, Jiang Q, Yang MY, Zhou JX, Zhang Q. Long noncoding RNA NNT-AS1 promotes hepatocellular carcinoma progression and metastasis through miR-363/CDK6 axis. Oncotarget. 2017; 8:88804–14. https://doi.org/10.18632/oncotarget.21321 [PubMed]
- 42. Hua F, Liu S, Zhu L, Ma N, Jiang S, Yang J. Highly expressed long non-coding RNA NNT-AS1 promotes cell proliferation and invasion through Wnt/β-catenin signaling pathway in cervical cancer. Biomed Pharmacother. 2017; 92:1128–34. https://doi.org/10.1016/j.biopha.2017.03.057 [PubMed]
- 43. Huang D, Wei Y, Zhu J, Wang F. Long non-coding RNA SNHG1 functions as a competitive endogenous RNA to regulate PDCD4 expression by sponging miR-195-5p in hepatocellular carcinoma. Gene. 2019; 714:143994. https://doi.org/10.1016/j.gene.2019.143994 [PubMed]
- 44. Li G, Liu T, Zhang B, Chen W, Ding Z. Genome-wide identification of a competing endogenous RNA network in cholangiocarcinoma. J Cell Biochem. 2019; 120:18995–9003. https://doi.org/10.1002/jcb.29222 [PubMed]
- 45. Tian YJ, Wang YH, Xiao AJ, Li PL, Guo J, Wang TJ, Zhao DJ. Long noncoding RNA SBF2-AS1 act as a ceRNA to modulate cell proliferation via binding with miR-188-5p in acute myeloid leukemia. Artif Cells Nanomed Biotechnol. 2019; 47:1730–37. https://doi.org/10.1080/21691401.2019.1608221 [PubMed]
- 46. Alqurashi N, Hashimi SM, Alowaidi F, Ivanovski S, Farag A, Wei MQ. miR-496, miR-1185, miR-654, miR-3183 and miR-495 are downregulated in colorectal cancer cells and have putative roles in the mTOR pathway. Oncol Lett. 2019; 18:1657–68. https://doi.org/10.3892/ol.2019.10508 [PubMed]
- 47. Ma R, Zhu P, Liu S, Gao B, Wang W. miR-496 suppress tumorigenesis via targeting BDNF-mediated PI3K/Akt signaling pathway in non-small cell lung cancer. Biochem Biophys Res Commun. 2019; 518:273–77. https://doi.org/10.1016/j.bbrc.2019.08.046 [PubMed]
- 48. Chen Y, Bao C, Zhang X, Lin X, Huang H, Wang Z. Long non-coding RNA HCG11 modulates glioma progression through cooperating with miR-496/CPEB3 axis. Cell Prolif. 2019; 52:e12615. https://doi.org/10.1111/cpr.12615 [PubMed]
- 49. Qi NN, Tian S, Li X, Wang FL, Liu B. Up-regulation of microRNA-496 suppresses proliferation, invasion, migration and in vivo tumorigenicity of human osteosarcoma cells by targeting eIF4E. Biochimie. 2019; 163:1–11. https://doi.org/10.1016/j.biochi.2019.04.017 [PubMed]
- 50. Zhu W, Liu H, Wang X, Lu J, Yang W. Long noncoding RNAs in bladder cancer prognosis: A meta-analysis. Pathol Res Pract. 2019; 215:152429. https://doi.org/10.1016/j.prp.2019.04.021 [PubMed]
- 51. Chi Y, Wang D, Wang J, Yu W, Yang J. Long Non-Coding RNA in the Pathogenesis of Cancers. Cells. 2019; 8:8. https://doi.org/10.3390/cells8091015 [PubMed]
- 52. Quan J, Pan X, Zhao L, Li Z, Dai K, Yan F, Liu S, Ma H, Lai Y. LncRNA as a diagnostic and prognostic biomarker in bladder cancer: a systematic review and meta-analysis. Onco Targets Ther. 2018; 11:6415–24. https://doi.org/10.2147/OTT.S167853 [PubMed]
- 53. Taheri M, Omrani MD, Ghafouri-Fard S. Long non-coding RNA expression in bladder cancer. Biophys Rev. 2018; 10:1205–13. https://doi.org/10.1007/s12551-017-0379-y [PubMed]
- 54. Chan JJ, Tay Y. Noncoding RNA:RNA Regulatory Networks in Cancer. Int J Mol Sci. 2018; 19:19. https://doi.org/10.3390/ijms19051310 [PubMed]
- 55. Bianchi ME, Agresti A. HMG proteins: dynamic players in gene regulation and differentiation. Curr Opin Genet Dev. 2005; 15:496–506. https://doi.org/10.1016/j.gde.2005.08.007 [PubMed]
- 56. Yang GL, Zhang LH, Bo JJ, Huo XJ, Chen HG, Cao M, Liu DM, Huang YR. Increased expression of HMGB1 is associated with poor prognosis in human bladder cancer. J Surg Oncol. 2012; 106:57–61. https://doi.org/10.1002/jso.23040 [PubMed]
- 57. Suren D, Yildirim HT, Atalay I, Sayiner A, Yildirim M, Alikanoglu AS, Sezer C. HMGB1 expression in urothelial carcinoma of the bladder. J BUON. 2018; 23:1882–86. [PubMed]
- 58. Shrivastava S, Mansure JJ, Almajed W, Cury F, Ferbeyre G, Popovic M, Seuntjens J, Kassouf W. The Role of HMGB1 in Radioresistance of Bladder Cancer. Mol Cancer Ther. 2016; 15:471–79. https://doi.org/10.1158/1535-7163.MCT-15-0581 [PubMed]