


Introduction
Cancer stem cells (CSCs) have been identified in PCa as well as a number of other solid tumors [1]. Accumulating evidence indicate that such CSCs account for PCa initiation, progression and resistance to chemotherapies [2]. Therefore, in-depth understanding about the regulatory mechanism unique to CSCs will be essential for getting to the root of cancer initiation / progression, and consequently, designing CSCs-specific therapeutics.
Transforming growth factor-beta (TGF-β) plays a crucial role in cell proliferation and differentiation [3]. TGF-β family members cooperate with membrane receptor serine-threonine protein kinase, leading to the activation of Smad transcription factors (TFs). Emerging evidence show that TGF-β has a complex and paradoxical role in cancer, acting as both a tumor suppressor and a factor that promotes cancer invasion and metastasis by suppressing immune responses [3–5]. TGF-β drives immune evasion in genetically reconstituted colon cancer metastasis by promoting T-cell exclusion and blocking the acquisition of the Th1-effector phenotype [6]. Thus, TGF-β signaling regulates tumorigenesis via different molecular mechanisms. Especially, TGF-β signaling plays an important role in regulating the function of cancer stem cells. As previous studies reported, TGF-β signaling is responsible for maintaining the tumorigenic properties of tumor-initiating cells in multiple tumors such as breast, melanoma, glioma and so on [7–9]. CSCs also take an important part in facilitating cancer metastases [10]. Recent studies reveal that inhibition of TGF-β signaling in PCa cells impedes the PCa progression and corresponding bone metastases [11–13], as well as the discovery that external stimulation with TGF-β converted CD44- non-CSCs into the undifferentiated CD44+ CSCs in human colorectal cancer, leading to the significant increment of CSCs in xenograft models [14]. Meanwhile, Miao Y et al revealed that TGF-β-responding tumor-initiating stem cells (tSCs) are superior at resisting the transfer of T cells and facilitating tumor relapse using single-cell RNA sequencing (RNA-Seq) and lineage tracing [15]. Thus, it raises our enthusiasm regarding the role of TGF-β in maintaining self-renewal of PCa CSCs.
Speckle-type POZ protein (SPOP) is a bric-a-brac-tram track-broad/poxvirus and zinc finger (BTB/POZ) domain protein that functions as an adaptor for the E3 ubiquitin ligase Cullin3 [16]. SPOP can target various substrates including androgen receptor (AR) [17, 18], steroid receptor coactivator 3 (SRC-3) [19], DEK, TRIM24 [20], ERG [21, 22] and EglN2 [23] for degradation and thus control the proliferation and invasion of PCa. In addition, SPOP inhibits the self-renewal and stem-like characteristics of PCa via the ubiquitin-dependent degradation of NANOG [24] in parallel with the fact that the mutation frequency of SPOP gene is up to 15% in PCa with poor prognosis [25]. It has been reported that the expression of SPOP is downregulated in pancreatic cancer, but the underlying mechanism is still unclear [26]. Interestingly, our data by analyzing the TCGA show that expression of SPOP gene is downregulated in human PCa tissues, however, little is known about how the transcriptional level of SPOP is tuned in PCa. In this study, we investigated the regulatory mechanism of SPOP expression in PCa especially in terms of CSCs and found that SPOP expression is negatively regulated by SMAD3-mediated TGF-β signaling through the interaction between SMAD3 and its binding elements (SBEs) in the promoter of SPOP. Thus, our study reveals a novel role of TGF-β signaling in regulating SPOP expression and resultant PCa stemness.
Results
TGF-β signaling is functionally activated in prostate CSCs
TGF-β signaling plays important roles in inducing EMT by enhancing the expression of Snail zinc finger transcription factor family members [27], through which normal or transformed mammary epithelial cells can acquire stem cell-like properties, such as the expression of CD44 and CD133 as well as the capability of forming oncospheres in vitro [28]. Thus, it triggers our interest to determine whether TGF-β signaling is upregulated in PCa CSCs by detecting the mRNA expression of its downstream signaling components like SMAD7, PAI-1 and P21. The results from real-time PCR demonstrated that TGF-β signaling-related genes are significantly increased in first-passage spheres as compared with cells from which spheres derived (Figure 1A and Supplementary Figure 1A). TGF-β is a cytokine that can radiate signals from a heterodimeric receptor complex formed by the type I (TβRI) and the type II (TβRII) receptors to its downstream signal transducer, SMAD transcription factors, whose activation allows oncogenic instructions to be transmitted by deregulated signals in cancers [29]. Based on our results, we conclude that TGF-β signaling contributes to CSCs turnover in PCa cells via detecting CSCs markers such as CD133, NANOG and OCT4 (Figure 1B and Supplementary Figure 1B).
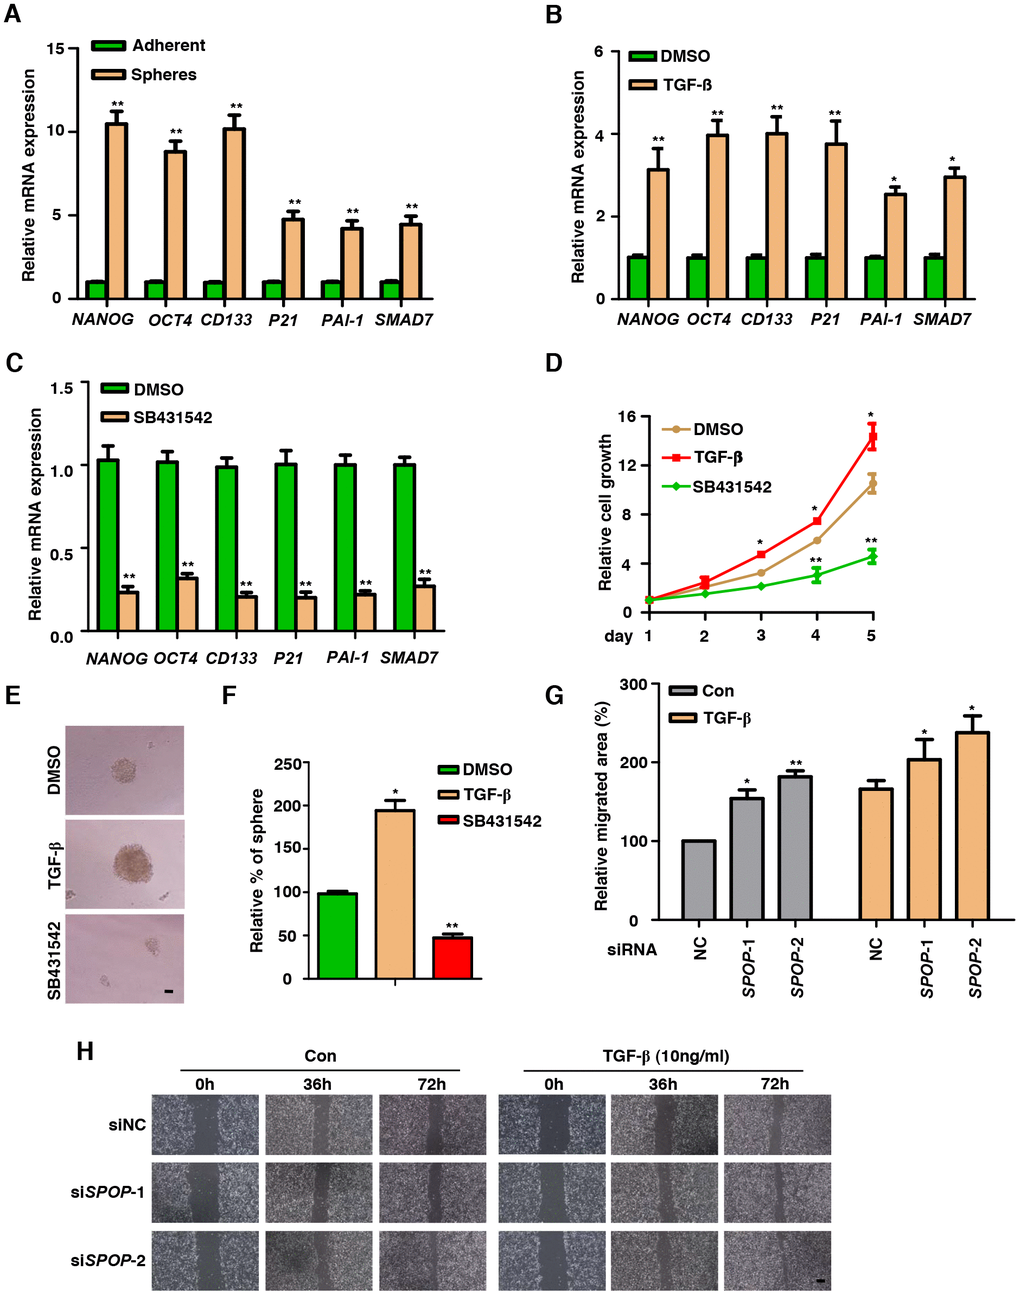
Figure 1. TGF-β Signaling is functionally active in prostate CSCs. (A) Real-Time PCR analysis of TGF-β Signaling-associated genes in adherent cells versus spheres in DU145 cells. Data are normalized to Actin expression and presented as fold change in gene expression relative to adherent cells. Data are means ± SEM (n=3). **P < 0.01 vs Adherent (Student's t-test). (B) Analysis the expression of CSCs markers in the treatment of TGF-β (10ng/ml) in DU145 cells via qPCR. Data are normalized to Actin expression and presented as fold change in gene expression relative to the treatment of DMSO. Data are means ± SEM (n=3). *P < 0.05, **P < 0.01 vs DMSO (Student's t-test). (C) Analysis the expression of CSCs markers in the treatment of SB431542 (10μM) in DU145 cells via qPCR. Data are normalized to Actin expression and presented as fold change in gene expression relative to the treatment of DMSO. Data are means ± SEM (n=3). **P < 0.01 vs DMSO (Student's t-test). (D) MTT assay of DU145 cells treated with TGF-β (10ng/ml) or SB431542 (10μM) in DU145 cells. Data are means ± SEM (n=3). *P<0.05, **P<0.01 vs DMSO (Student's t-test). (E) Representative sphere images from each condition of DU145 cells. Scale bar, 100μm. (F) Frequency of tumor spheres formed from DU145 cells. Sphere counts are normalized to mock treated spheres. Data are means ± SEM (n=3). *P < 0.05, **P < 0.01 vs DMSO (Student's t-test). (G, H) Wound healing assay of SPOP KD PC3 cells. Scale bar, 100μm. Data are means ± SEM (n=3). *P < 0.05, **P < 0.01 vs NC (Student's t-test).
Since SB431542 is a small-molecule inhibitor of ALK5 kinase, a key component in TGF-β signaling axis [30], we explored its role in the induction of CSCs markers of PCa cells such as DU145 and LNCaP. We found that inhibition of TGF-β signaling decreased the expression of CSCs markers (Figure 1C and Supplementary Figure 1C). To test the efficacy of TGF-β on the proliferation of PCa cells, we performed MTT assay upon the treatments of TGF-β and SB431542. Our results showed that TGF-β can promote the proliferation of PCa cells while treatment of TGF-β inhibitor decreased such proliferation in DU145 and LNCaP cells (Figure 1D and Supplementary Figure 1D).
To identify the function of TGF-β on acquiring CSCs properties, we next examined whether TGF-β is capable of enhancing self-renewal capacity of PCa CSCs. In sphere formation assay, the activation of TGF-β signaling resulted in the formation of much larger and more densely populated oncospheres as compared with those of control without TGF-β treatment, which acts in an opposite way that, inhibition of TGF-β impaired the stemness of PCa (Figure 1E and 1F). Furthermore, knockdown of SPOP promoted cell migration demonstrated by wound healing assay (Figure 1G, 1H and Supplementary Figure 1E–1H). These results indicate that TGF-β pathway is activated in PCa CSCs and inhibition of TGF-β signaling decreases the proliferation, migration and stemness of PCa.
SPOP expression is regulated by TGF-β signaling in PCa
Many studies have revealed high-frequency SPOP mutation in its MATH domain and these mutations are closely related to the progression of PCa. Interestingly, the TCGA data also show that the expression level of SPOP is downregulated in PCa (Figure 4B). Thus, it makes us curious to explore the mechanism underlying such phenomenon. First, we detected the expression of SPOP in PCa oncospheres and found that SPOP is downregulated at both mRNA and protein level in DU145, PC3 and LNCaP cells (Figure 2A–2C).
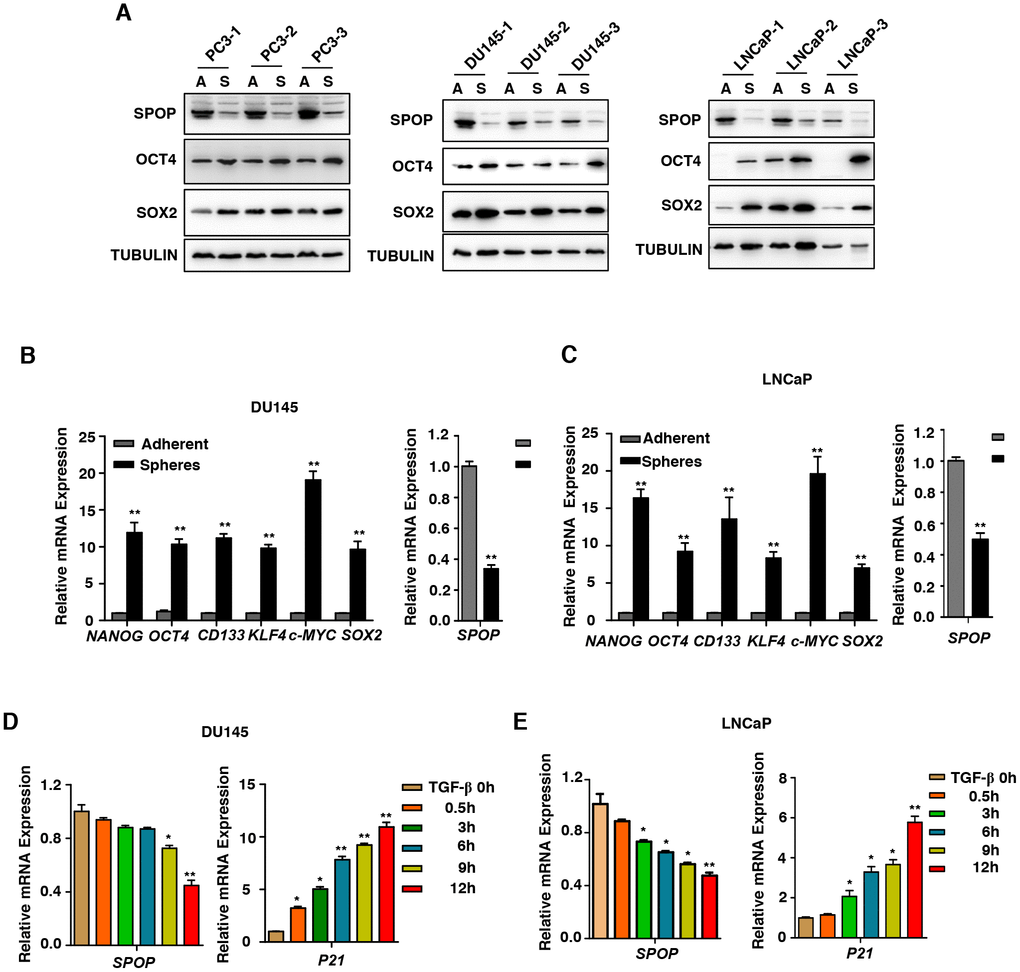
Figure 2. SPOP is regulated by TGF-β Signaling in prostate cancer. (A) Western blot analysis the expression of SPOP in the oncospheres in androgen-independent (DU145, PC3) cell lines and androgen-dependent (LNCaP) cell lines. (B) Real-Time PCR analysis of SPOP and CSCs markers expression in adherent cells versus spheres in DU145 cells. Data are normalized to Actin expression and presented as fold change in gene expression relative to adherent cells. Data are means ± SEM (n=3). **P < 0.01 vs Adherent (Student's t-test). (C) Real-Time PCR analysis of SPOP and CSCs markers expression in adherent cells versus spheres in LNCaP cells. Data are normalized to Actin expression and presented as fold change in gene expression relative to adherent cells. Data are means ± SEM (n=3). **P < 0.01 vs Adherent (Student's t-test). (D) Analysis the expression of SPOP in the treatment of TGF-β (10ng/ml) in DU145 cells. Data are means ± SEM (n=3). *P<0.05, **P < 0.01 vs TGF-β 0h (Student's t-test). (E) Analysis the expression of SPOP in the treatment of TGF-β (10ng/ml) in LNCaP cells. Data are means ± SEM (n=3). *P<0.05, **P < 0.01 vs TGF-β 0h (Student's t-test).
Next, we examined whether TGF-β takes a part in mediation of SPOP expression. We found that under the treatment of TGF-β in PCa cells, the expression level of SPOP decreased (Figures 2D and 2E). Based on these data, we conclude that TGF-β plays a key role in diminishing the expression of SPOP in PCa oncospheres.
TGF-β regulates SPOP expression via SMAD3
Receptor activated SMADs (R-SMADs, i.e. R-SMAD proteins 2 and 3), are important components of canonical TGF-β signaling pathway, which form complex in the nucleus with DNA-binding co-factors such as SP1 together with transcriptional coactivators or corepressors to regulate gene expression [31]. To understand the molecular underpinnings of how SPOP expression is regulated by TGF-β, we analyzed the potential binding sites of transcriptional factors on SPOP promoter using the rVista 2.0 software. We identified three potential SMAD3-binding sites in SPOP promoter (Figure 3A). Next, we examined whether the expression level of SPOP is regulated by SMAD3. Chromatin immunoprecipitation (ChIP) analysis was performed and revealed that SMAD3 was preferentially enriched at the SPOP promoter under the treatment of TGF-β, which was significantly reduced when PCa cells were treated with SB431542 (Figure 3B and 3C). In addition, TGF-β treatment leads to a downregulation of SPOP at the transcriptional level using promoter-driven luciferase reporter gene assay. Our data demonstrated that inhibition of TGF-β signaling increased the mRNA level of SPOP (Figure 3D). Moreover, ectopic expression of TβRI remarkably decreased the mRNA level of SPOP in a dose-dependent manner (Figure 3E) while treatment of TGF-β has no effect on the mRNA expression of SPOP when SMAD3 is knocked down (Figure 3F and 3G, Supplementary Figure 3A and 3B).
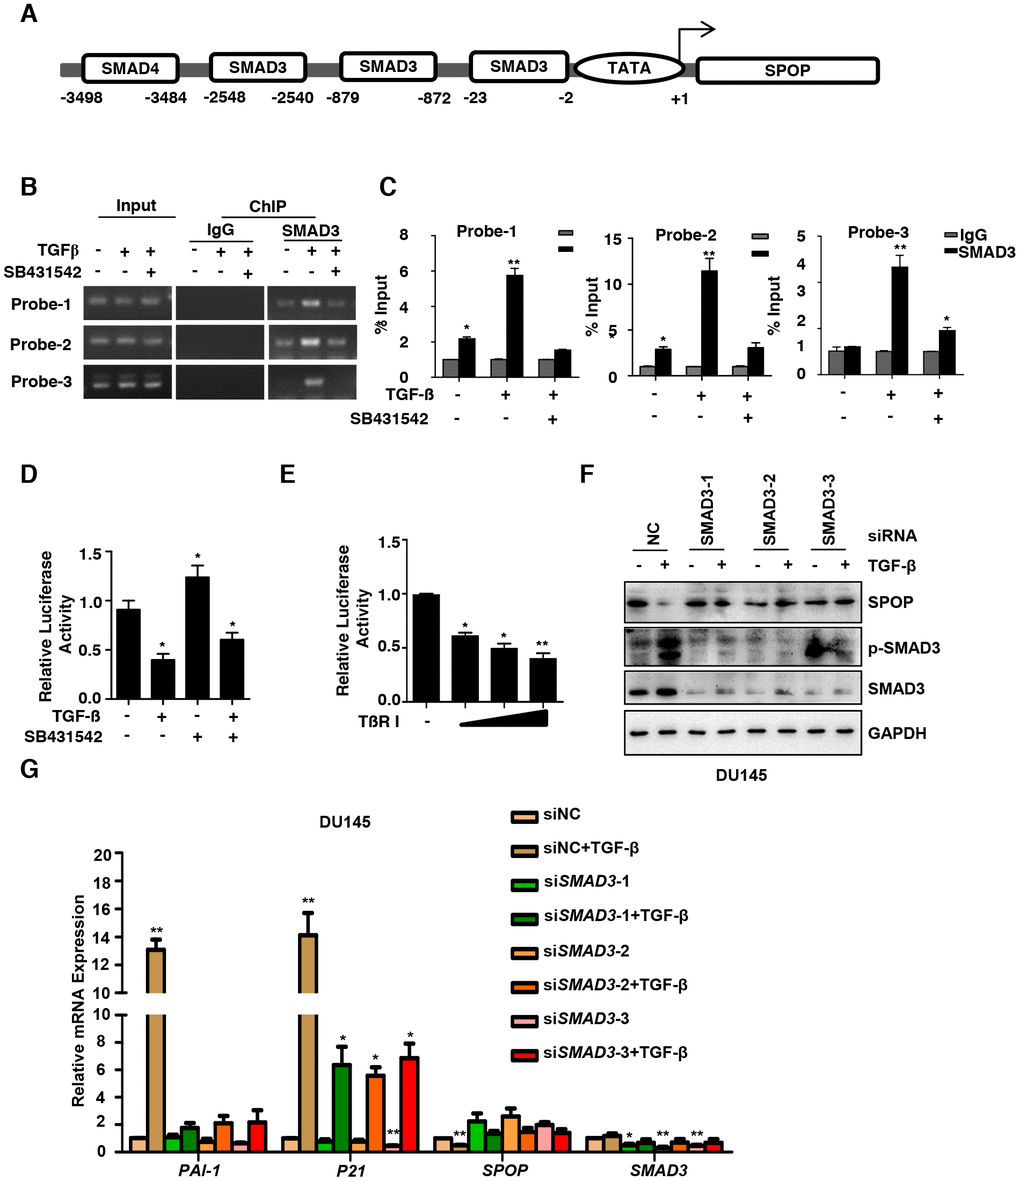
Figure 3. TGF-β regulates SPOP expression through SMAD3. (A) Map of the SPOP promoter and the putative SMAD3-binding sites. (B) ChIP–PCR analysis of DU145 cells cultured with TGF-β (10ng/ml) or SB431542 (10μM) for 8 hours using anti-SMAD3 antibody and PCR primers. IgG was used as a negative control. (C) Enrichment of SMAD3 on the SPOP promoter was calculated. Data are means ± SEM (n=3). *P<0.05, **P < 0.01 vs IgG (Student's t-test). (D) DU145 cells were transfected with SPOP gene basic promoter-Luc reporter. After the treatment with TGF-β (10ng/ml) or SB431542 (10μM) for 8 hours, luciferase activity of SPOP were measured. Data are means ± SEM (n=3). *P<0.05 vs TGF-β (-) and SB431542 (-) (Student's t-test). (E) DU145 cells were transfected with TβRI or vector control, plus the SPOP basic promoter-Luc reporter. Luciferase activity of SPOP were measured. Data are means ± SEM (n=3). *P<0.05, **P<0.01vs TβRI (-) (Student's t-test). (F, G) Western blot analysis the expression of SPOP upon the knockdown of SMAD3 and the treatment with TGF-β (10ng/ml) for 8 hrs in the DU145 cells (F) and the Real-Time PCR analysis of the expression of SPOP and TGF-β signaling-associated genes (G).
SPOP expression is downregulated in PCa.
To investigate the clinic-pathological and prognostic value of SPOP expression in PCa, we detected the difference of SPOP expression between normal tissues and primary tumors. We also analyzed the expression of SMAD3, SPOP and TGFβR II using clinic PCa samples from TCGA data. We noticed an increased expression level of SMAD3 concomitant with a SPOP reduction in those samples (Figure 4A and 4B), which is consistent with our results (Figure 3F, 3G and Supplementary Figure 3A). In accordance with that, we also observed a reduction in SPOP expression together with an upregulation of TGFβR II in PCa oncospheres (Figure 4C and 4D).
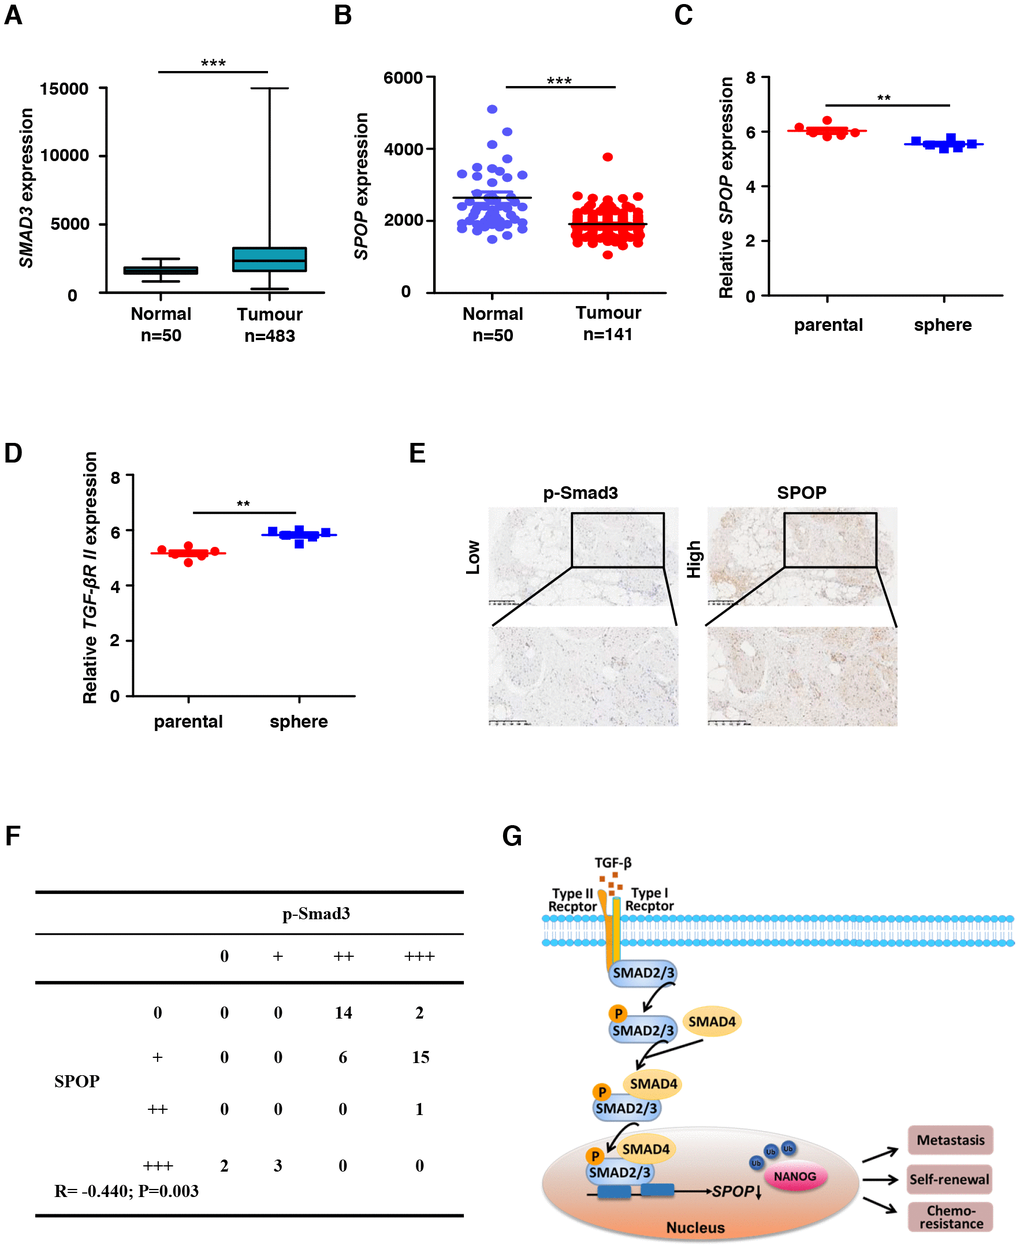
Figure 4. SPOP expression is downregulated in human proatate cancer. (A) SMAD3 expression levels in normal tissue and primary tumor of prostate through the TCGA data. Expression levels are presented as boxplots and were compared using an unpaired Student's t-test, ***P<0.001. (B) SPOP expression levels in normal tissue and primary tumor of prostate through the TCGA data. Expression levels are presented as boxplots and were compared using an unpaired Student's t-test, ***P<0.001. (C) Relative SPOP expression levels in parental sample and sphere sample of prostate cancer through the GEO data GSE19713. Expression levels are presented as boxplots and were compared using an unpaired Student's t-test, **P<0.01. (D) Relative TGFβR II expression levels in parental sample and sphere sample of prostate cancer through the GEO data GSE19713. Expression levels are presented as boxplots and were compared using an unpaired Student's t-test, **P<0.01. (E) Human prostate tumor specimens were stained with p-SMAD3 and SPOP separately using an IHC staining assay. Representative examples are shown. (F) The correlation between SPOP and p-SMAD3 protein levels in the human prostate tumor tissue array is shown. Statistical significance was determined by a χ2 test. R indicates the correlation coefficient. (G) Model for TGF-β signaling negatively regulates SPOP expression.
Next, we examined whether SPOP expression is correlated to the expression levels of p-SMAD3 in PCa using IHC. Our data indicated that SPOP positively correlated with the expressions of p-SMAD3 (Figure 4E), which is statistically significant when their IHC staining was quantified (Figure 4F), highlighting the clinical importance of SPOP expression in PCa.
Discussion
TGF-β has been shown to enrich CD44high populated CSCs via EMT [28, 32]. Recent studies demonstrate that TGF-β regulated genes are tightly associated with PCa bone metastases in parallel with the fact that inhibition of TGF-β signaling minimizes the development of bone metastases [11–13]. Accumulating evidence also indicate an intimate relationship between CSCs and PCa initiation, progression and resistance to chemotherapy [1, 2]. In the present study, we demonstrate that the TGF-β signaling plays a critical tumor-promoting role in PCa. Inhibition of TGF-β signaling reduced the formation of CSC-like oncospheres derived from PCa cells, suggesting a potential role of TGF-β signaling axis in the induction of PCa oncospheres (Figure 1E and 1F). Our data hint an alternative approach of TGF-β signaling that critically influence the acquirement of stem properties in both PCa cells and clinic PCa tissues.
It has been reported that E3 ubiquitin ligase SPOP acts as a tumor suppressor in PCa [24, 33]. Our data indicate that the expression level of SPOP is much lower in PCa. Interestingly, we also found that SPOP is downregulated in PCa CSCs, which is manipulated by TGF-β signaling (Figure 2A–2C). In response to TGF-β-mediated dimerization between TGF-β receptor I (TGF-βRI) and TGF-βRII, receptor-regulated SMADs (SMAD2/3) are phosphorylated, interact with SMAD4, and translocate to the nucleus where they form a complex controlling gene transcription with some DNA-binding partners and transcriptional co-activators or co-repressors [34]. To our surprise, despite the fact that AR has a cross-talk role with TGF-β signaling and plays an important role in the development and progression of PCa and its androgen-independent transformation [35], we confirmed that TGF-β regulates the gene expression of SPOP via SMAD3 in both androgen-independent (DU145, PC3) cell lines and androgen-dependent (LNCaP) cell line (Figures 2D, 2E, Supplementary Figure 2A and 2B). The same effect regardless of androgen-independence and -dependence may be due to the direct interaction between SMAD3 and SPOP promoter, which is separated from AR signaling. However, which transcriptional components that SMAD3 recruits during such process need to be addressed in the future.
Taken together, our study identifies a novel mechanism of TGF-β signaling in tumorigenesis through downregulating the expression of SPOP, a potential tumor suppressor, which may lead to the upregulation of NANOG as we previously reported [24] and consequently enhanced stemness in PCa. We summarized the essence of our findings as a novel model described in Figure 4G. These results suggest that the newly-identified TGF-β / SPOP signaling node may serve as potential therapeutic target for the treatment of cancers by eliminating the stemness of PCa.
Materials and Methods
Plasmids and antibodies
Constructs were generated by standard molecular cloning method. SPOP basic promoter luciferase reporter was cloned into the PGL3 basic vector. TβR I and Renilla were cloned into pCDNA3.1 vector. All the vectors were confirmed using DNA sequencing. The anti-SOX2 (sc-20088, 1:3000) antibody was obtained from Epitomics. The anti-NANOG (AB5731, 1:500) antibody was purchased from Millipore. The anti-Tubullin (2148S, 1:1000), anti-GAPDH (5174S), anti-p-SMAD3 (9520S), anti-SMAD3 (9523S) antibodies were obtained from Cell Signaling Technology. The anti-OCT4 (ab181557) antibody was obtained from Abcam. TGF-β (10ng/ml) was purchased from Sigma, SB431542 (10 μM) was purchase from Selleck.
Cell culture and transfection
Human embryonic kidney 293T cells (HEK293T cells, American Type Culture Collection) was cultured in Dulbecco's modified Eagle's medium (DMEM) (Gibco). DU145 cells (American Type Culture Collection), PC3 cells (American Type Culture Collection) and LNCaP cells (American Type Culture Collection) were cultured in 1640 medium (Gibco), supplemented with 10% heat-inactivated fetal bovine serum (FBS) at 37 °C in 5% CO2. The identity of all the cell lines has been authenticated by the American Type Culture Collection through the STR profiling.
Transfections were performed using calcium phosphate-DNA coprecipitation for 293T cells and SunbioTrans-EZ for DU145 cells and LNCaP cells (Shanghai Sunbio Medical Biotechnology Co., Ltd.). DU145 cells and LNCaP cells were transfected with siRNA oligonucleotides using Lipofectamine2000.
Luciferase reporter assay
HEK293T cells were transiently co-transfected with firefly luciferase reporter vectors, effector vectors and the renilla luciferase vector. After 36 h, cells were collected in lysis buffer (25mM Tris-Cl (pH 7.8), 25mM dithiothreitol (DTT), 2mM 1,2-diaminocyclo-hoxaneN,N,N,N’-tetracetic acid, 10% glycerol and 1% Triton X-100), and luciferase assays were performed using the dual-luciferase reporter assay system (Promega).
Real-time qPCR
Total RNA was Trizol-extracted, column-purified and reverse-transcribed using PrimeScript 1st Strand Cdna Synthesis kit (Takara). All qPCR analyses were performed using Fast SYBR Green (Takara).
Proliferation assay
For MTT assay, DU145cells and LNCaP cells were seeded in a 96-well plate. Cells were harvested every 24hours, the MTT solution was added for 4 hours. The reactions were stopped by addition of dimethyl sulfoxide (DMSO) solution for 20 minutes, and the samples were measured at 490 nm. Three independent experiments were carried out.
Sphere formation assay
Oncospheres were enriched from DU145 cells. Single-cell suspension of DU145 cells (200 cells per well) were plated on 96-well ultra-low Attachment Plates (Corning Incorporated, catalog number: 3474) and cultured in Dulbecco’s Modified Eagle’s Medium/F12 (Gibco) supplemented with 5μg/ml insulin (Sigma), 20ng/ml EGF (Sigma), 1:50 B27 (Gibco), 10ng/ml bFGF, and 0.4% BSA for 10 days alone. Floating spheres that grew in 2 weeks were counted. Tumor spheres were visualized under phase contrast microscope, photographed and counted and represented graphically. Spheres were digested with trypsin 0.05% EDTA and filtered through a 40-mm filter.
TCGA data analysis
Level 3 data for mRNA expression from TCGA were downloaded and processed using standard methods. mRNA expression was measured using the Illumina HiSeq 2000 RNA Sequencing version 2 program. Gene expression was analyzed using two-class unpaired significance analysis of microarrays (SAM) (http://statweb.stanford.edu/~tibs/SAM/) for the indicated tumors versus normal samples. Differences in expression were considered to be statistically significant when the fold change>2 and q<0.05. Kaplan-Meier plot was analyzed from the PrognoScan database (http://www.abren.net/PrognoScan/).
Statistical analysis
Statistical analyses were performed with a two-tailed unpaired Student’s t-test. The data are presented as the means ± SEM. The mean was calculated from truly independent experiments. P-values < 0.05 were considered statistically significant.
IHC staining of human prostate cancer tissues
The human prostate cancer tumor tissue arrays were provided by Changhai hospital (Shanghai, China). The arrays were stained by IHC with SPOP, p-Smad3 and NANOG-specific antibodies using the Histostain-plus IHC Kit (Miao Tong Biological Science and Technology Co., LTD, Shanghai, China). The stained slides were examined under a microscope, and images were acquired.
Supplementary Materials
Author Contributions
Chenchen Jiao, Xin Ge, Qing Wei, Ping Wang and Jiali Jin conceived the project. Chenchen Jiao, Tong Meng, Chenyu Zhou, Xinbo Wang, Jiali Jin, Qing Wei, Xin Ge and Ping Wang designed and performed experiments. Chenchen Jiao, Tong Meng, Meiling Lu, Xiao Tan and Jiali Jin analyzed the data. Xin Ge, Chenchen Jiao, Jiali Jin, and Qing Wei wrote the manuscript.
Conflicts of Interest
The authors declare no conflicts of interest.
Funding
This work was supported by grants from the National Natural Science Foundation of China to J.L. (31801178), P.W. (81625019), X.G. (81874198), Q.W. (81772849), T.M. (81702659), M.L. (81602413) and from the Shanghai Sailing Program to J.L. (18YF1419300) and Fundamental Research Funds for the Central Universities to J.L. (22120180045).
References
- 1. Jeter CR, Liu B, Liu X, Chen X, Liu C, Calhoun-Davis T, Repass J, Zaehres H, Shen JJ, Tang DG. NANOG promotes cancer stem cell characteristics and prostate cancer resistance to androgen deprivation. Oncogene. 2011; 30:3833–45. https://doi.org/10.1038/onc.2011.114 [PubMed]
- 2. Liu T, Xu F, Du X, Lai D, Liu T, Zhao Y, Huang Q, Jiang L, Huang W, Cheng W, Liu Z. Establishment and characterization of multi-drug resistant, prostate carcinoma-initiating stem-like cells from human prostate cancer cell lines 22RV1. Mol Cell Biochem. 2010; 340:265–73. https://doi.org/10.1007/s11010-010-0426-5 [PubMed]
- 3. Massagué J. TGFbeta in Cancer. Cell. 2008; 134:215–30. https://doi.org/10.1016/j.cell.2008.07.001 [PubMed]
- 4. Bierie B, Moses HL. Tumour microenvironment: TGFbeta: the molecular Jekyll and Hyde of cancer. Nat Rev Cancer. 2006; 6:506–20. https://doi.org/10.1038/nrc1926 [PubMed]
- 5. Dumont N, Arteaga CL. Targeting the TGF beta signaling network in human neoplasia. Cancer Cell. 2003; 3:531–36. https://doi.org/10.1016/S1535-6108(03)00135-1 [PubMed]
- 6. Tauriello DV, Palomo-Ponce S, Stork D, Berenguer-Llergo A, Badia-Ramentol J, Iglesias M, Sevillano M, Ibiza S, Cañellas A, Hernando-Momblona X, Byrom D, Matarin JA, Calon A, et al. TGFβ drives immune evasion in genetically reconstituted colon cancer metastasis. Nature. 2018; 554:538–43. https://doi.org/10.1038/nature25492 [PubMed]
- 7. Nishimura EK, Suzuki M, Igras V, Du J, Lonning S, Miyachi Y, Roes J, Beermann F, Fisher DE. Key roles for transforming growth factor beta in melanocyte stem cell maintenance. Cell Stem Cell. 2010; 6:130–40. https://doi.org/10.1016/j.stem.2009.12.010 [PubMed]
- 8. Ikushima H, Todo T, Ino Y, Takahashi M, Miyazawa K, Miyazono K. Autocrine TGF-beta signaling maintains tumorigenicity of glioma-initiating cells through Sry-related HMG-box factors. Cell Stem Cell. 2009; 5:504–14. https://doi.org/10.1016/j.stem.2009.08.018 [PubMed]
- 9. Scheel C, Eaton EN, Li SH, Chaffer CL, Reinhardt F, Kah KJ, Bell G, Guo W, Rubin J, Richardson AL, Weinberg RA. Paracrine and autocrine signals induce and maintain mesenchymal and stem cell states in the breast. Cell. 2011; 145:926–40. https://doi.org/10.1016/j.cell.2011.04.029 [PubMed]
- 10. Magee JA, Piskounova E, Morrison SJ. Cancer stem cells: impact, heterogeneity, and uncertainty. Cancer Cell. 2012; 21:283–96. https://doi.org/10.1016/j.ccr.2012.03.003 [PubMed]
- 11. Hu Z, Gupta J, Zhang Z, Gerseny H, Berg A, Chen YJ, Zhang Z, Du H, Brendler CB, Xiao X, Pienta KJ, Guise T, Lee C, et al. Systemic delivery of oncolytic adenoviruses targeting transforming growth factor-β inhibits established bone metastasis in a prostate cancer mouse model. Hum Gene Ther. 2012; 23:871–82. https://doi.org/10.1089/hum.2012.040 [PubMed]
- 12. Wan X, Li ZG, Yingling JM, Yang J, Starbuck MW, Ravoori MK, Kundra V, Vazquez E, Navone NM. Effect of transforming growth factor beta (TGF-β) receptor I kinase inhibitor on prostate cancer bone growth. Bone. 2012; 50:695–703. https://doi.org/10.1016/j.bone.2011.11.022 [PubMed]
- 13. Fournier PG, Juárez P, Jiang G, Clines GA, Niewolna M, Kim HS, Walton HW, Peng XH, Liu Y, Mohammad KS, Wells CD, Chirgwin JM, Guise TA. The TGF-β Signaling Regulator PMEPA1 Suppresses Prostate Cancer Metastases to Bone. Cancer Cell. 2015; 27:809–21. https://doi.org/10.1016/j.ccell.2015.04.009 [PubMed]
- 14. Nakano M, Kikushige Y, Miyawaki K, Kunisaki Y, Mizuno S, Takenaka K, Tamura S, Okumura Y, Ito M, Ariyama H, Kusaba H, Nakamura M, Maeda T, et al. Dedifferentiation process driven by TGF-beta signaling enhances stem cell properties in human colorectal cancer. Oncogene. 2019; 38:780–93. https://doi.org/10.1038/s41388-018-0480-0 [PubMed]
- 15. Miao Y, Yang H, Levorse J, Yuan S, Polak L, Sribour M, Singh B, Rosenblum MD, Fuchs E. Adaptive Immune Resistance Emerges from Tumor-Initiating Stem Cells. Cell. 2019; 177:1172–1186.e14. https://doi.org/10.1016/j.cell.2019.03.025 [PubMed]
- 16. Zhuang M, Calabrese MF, Liu J, Waddell MB, Nourse A, Hammel M, Miller DJ, Walden H, Duda DM, Seyedin SN, Hoggard T, Harper JW, White KP, Schulman BA. Structures of SPOP-substrate complexes: insights into molecular architectures of BTB-Cul3 ubiquitin ligases. Mol Cell. 2009; 36:39–50. https://doi.org/10.1016/j.molcel.2009.09.022 [PubMed]
- 17. An J, Wang C, Deng Y, Yu L, Huang H. Destruction of full-length androgen receptor by wild-type SPOP, but not prostate-cancer-associated mutants. Cell Rep. 2014; 6:657–69. https://doi.org/10.1016/j.celrep.2014.01.013 [PubMed]
- 18. Geng C, Rajapakshe K, Shah SS, Shou J, Eedunuri VK, Foley C, Fiskus W, Rajendran M, Chew SA, Zimmermann M, Bond R, He B, Coarfa C, Mitsiades N. Androgen receptor is the key transcriptional mediator of the tumor suppressor SPOP in prostate cancer. Cancer Res. 2014; 74:5631–43. https://doi.org/10.1158/0008-5472.CAN-14-0476 [PubMed]
- 19. Li C, Ao J, Fu J, Lee DF, Xu J, Lonard D, O’Malley BW. Tumor-suppressor role for the SPOP ubiquitin ligase in signal-dependent proteolysis of the oncogenic co-activator SRC-3/AIB1. Oncogene. 2011; 30:4350–64. https://doi.org/10.1038/onc.2011.151 [PubMed]
- 20. Theurillat JP, Udeshi ND, Errington WJ, Svinkina T, Baca SC, Pop M, Wild PJ, Blattner M, Groner AC, Rubin MA, Moch H, Prive GG, Carr SA, Garraway LA. Prostate cancer. Ubiquitylome analysis identifies dysregulation of effector substrates in SPOP-mutant prostate cancer. Science. 2014; 346:85–89. https://doi.org/10.1126/science.1250255 [PubMed]
- 21. An J, Ren S, Murphy SJ, Dalangood S, Chang C, Pang X, Cui Y, Wang L, Pan Y, Zhang X, Zhu Y, Wang C, Halling GC, et al. Truncated ERG Oncoproteins from TMPRSS2-ERG Fusions Are Resistant to SPOP-Mediated Proteasome Degradation. Mol Cell. 2015; 59:904–16. https://doi.org/10.1016/j.molcel.2015.07.025 [PubMed]
- 22. Gan W, Dai X, Lunardi A, Li Z, Inuzuka H, Liu P, Varmeh S, Zhang J, Cheng L, Sun Y, Asara JM, Beck AH, Huang J, et al. SPOP Promotes Ubiquitination and Degradation of the ERG Oncoprotein to Suppress Prostate Cancer Progression. Mol Cell. 2015; 59:917–30. https://doi.org/10.1016/j.molcel.2015.07.026 [PubMed]
- 23. Zhang L, Peng S, Dai X, Gan W, Nie X, Wei W, Hu G, Guo J. Tumor suppressor SPOP ubiquitinates and degrades EglN2 to compromise growth of prostate cancer cells. Cancer Lett. 2017; 390:11–20. https://doi.org/10.1016/j.canlet.2017.01.003 [PubMed]
- 24. Wang X, Jin J, Wan F, Zhao L, Chu H, Chen C, Liao G, Liu J, Yu Y, Teng H, Fang L, Jiang C, Pan W, et al. AMPK Promotes SPOP-Mediated NANOG Degradation to Regulate Prostate Cancer Cell Stemness. Dev Cell. 2019; 48:345–360.e7. https://doi.org/10.1016/j.devcel.2018.11.033 [PubMed]
- 25. Abeshouse A, Ahn J, Akbani R, Ally A, Amin S, Andry CD, Annala M, Aprikian A, Armenia J, Arora A, Auman JT, Balasundaram M, Balu S, et al, and Cancer Genome Atlas Research Network. The Molecular Taxonomy of Primary Prostate Cancer. Cell. 2015; 163:1011–25. https://doi.org/10.1016/j.cell.2015.10.025 [PubMed]
- 26. Tan P, Xu Y, Du Y, Wu L, Guo B, Huang S, Zhu J, Li B, Lin F, Yao L. SPOP suppresses pancreatic cancer progression by promoting the degradation of NANOG. Cell Death Dis. 2019; 10:794. https://doi.org/10.1038/s41419-019-2017-z [PubMed]
- 27. Lee J, Son MJ, Woolard K, Donin NM, Li A, Cheng CH, Kotliarova S, Kotliarov Y, Walling J, Ahn S, Kim M, Totonchy M, Cusack T, et al. Epigenetic-mediated dysfunction of the bone morphogenetic protein pathway inhibits differentiation of glioblastoma-initiating cells. Cancer Cell. 2008; 13:69–80. https://doi.org/10.1016/j.ccr.2007.12.005 [PubMed]
- 28. Mani SA, Guo W, Liao MJ, Eaton EN, Ayyanan A, Zhou AY, Brooks M, Reinhard F, Zhang CC, Shipitsin M, Campbell LL, Polyak K, Brisken C, et al. The epithelial-mesenchymal transition generates cells with properties of stem cells. Cell. 2008; 133:704–15. https://doi.org/10.1016/j.cell.2008.03.027 [PubMed]
- 29. Schmierer B, Hill CS. TGFbeta-SMAD signal transduction: molecular specificity and functional flexibility. Nat Rev Mol Cell Biol. 2007; 8:970–82. https://doi.org/10.1038/nrm2297 [PubMed]
- 30. Tanaka H, Shinto O, Yashiro M, Yamazoe S, Iwauchi T, Muguruma K, Kubo N, Ohira M, Hirakawa K. Transforming growth factor β signaling inhibitor, SB-431542, induces maturation of dendritic cells and enhances anti-tumor activity. Oncol Rep. 2010; 24:1637–43. https://doi.org/10.3892/or_00001028 [PubMed]
- 31. Palumbo-Zerr K, Zerr P, Distler A, Fliehr J, Mancuso R, Huang J, Mielenz D, Tomcik M, Fürnrohr BG, Scholtysek C, Dees C, Beyer C, Krönke G, et al. Orphan nuclear receptor NR4A1 regulates transforming growth factor-β signaling and fibrosis. Nat Med. 2015; 21:150–58. https://doi.org/10.1038/nm.3777 [PubMed]
- 32. Gupta PB, Onder TT, Jiang G, Tao K, Kuperwasser C, Weinberg RA, Lander ES. Identification of selective inhibitors of cancer stem cells by high-throughput screening. Cell. 2009; 138:645–59. https://doi.org/10.1016/j.cell.2009.06.034 [PubMed]
- 33. Zhang J, Chen M, Zhu Y, Dai X, Dang F, Ren J, Ren S, Shulga YV, Beca F, Gan W, Wu F, Lin YM, Zhou X, et al. SPOP Promotes Nanog Destruction to Suppress Stem Cell Traits and Prostate Cancer Progression. Dev Cell. 2019; 48:329–344.e5. https://doi.org/10.1016/j.devcel.2018.11.035 [PubMed]
- 34. Feng XH, Derynck R. Specificity and versatility in tgf-beta signaling through Smads. Annu Rev Cell Dev Biol. 2005; 21:659–93. https://doi.org/10.1146/annurev.cellbio.21.022404.142018 [PubMed]
- 35. van der Poel HG. Androgen receptor and TGFbeta1/Smad signaling are mutually inhibitory in prostate cancer. Eur Urol. 2005; 48:1051–58. https://doi.org/10.1016/j.eururo.2005.09.006 [PubMed]