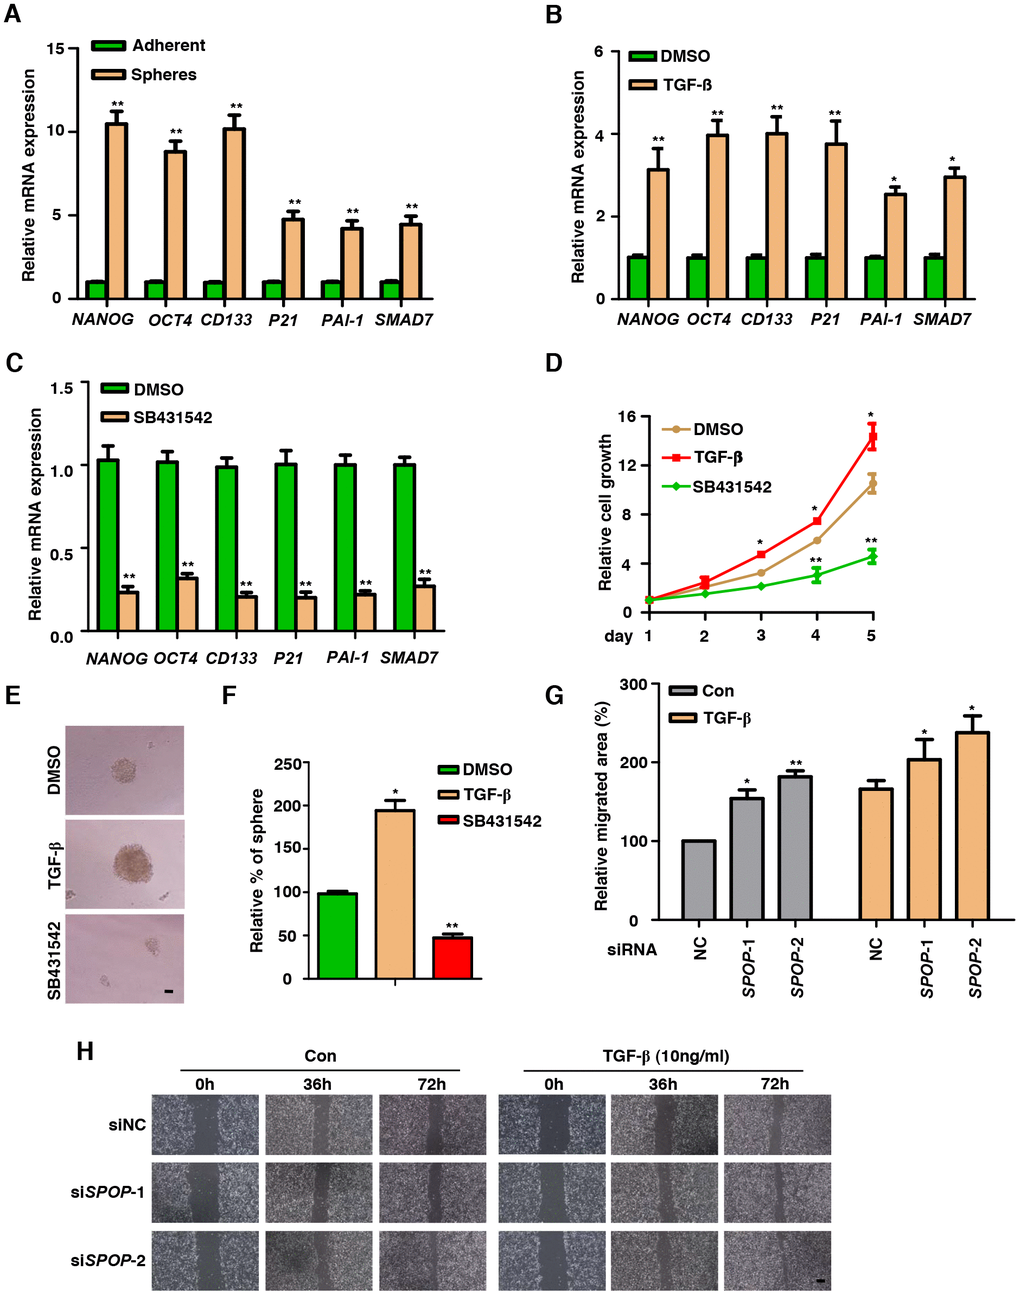
Figure 1.TGF-β Signaling is functionally active in prostate CSCs. (A) Real-Time PCR analysis of TGF-β Signaling-associated genes in adherent cells versus spheres in DU145 cells. Data are normalized to Actin expression and presented as fold change in gene expression relative to adherent cells. Data are means ± SEM (n=3). **P < 0.01 vs Adherent (Student's t-test). (B) Analysis the expression of CSCs markers in the treatment of TGF-β (10ng/ml) in DU145 cells via qPCR. Data are normalized to Actin expression and presented as fold change in gene expression relative to the treatment of DMSO. Data are means ± SEM (n=3). *P < 0.05, **P < 0.01 vs DMSO (Student's t-test). (C) Analysis the expression of CSCs markers in the treatment of SB431542 (10μM) in DU145 cells via qPCR. Data are normalized to Actin expression and presented as fold change in gene expression relative to the treatment of DMSO. Data are means ± SEM (n=3). **P < 0.01 vs DMSO (Student's t-test). (D) MTT assay of DU145 cells treated with TGF-β (10ng/ml) or SB431542 (10μM) in DU145 cells. Data are means ± SEM (n=3). *P<0.05, **P<0.01 vs DMSO (Student's t-test). (E) Representative sphere images from each condition of DU145 cells. Scale bar, 100μm. (F) Frequency of tumor spheres formed from DU145 cells. Sphere counts are normalized to mock treated spheres. Data are means ± SEM (n=3). *P < 0.05, **P < 0.01 vs DMSO (Student's t-test). (G, H) Wound healing assay of SPOP KD PC3 cells. Scale bar, 100μm. Data are means ± SEM (n=3). *P < 0.05, **P < 0.01 vs NC (Student's t-test).