


Introduction
Osteoporosis is a systemic skeletal disease characterized by reduced bone mass and destruction of the bone tissue microstructure, with increased bone fragility and risk of fracture [1]. The pain, deformity, and death caused by osteoporotic fractures seriously affects the health of the elderly population [2]. The incidence of osteoporosis is up to 21% in women aged 50-84 and is approximately 6% in elderly men [3]. Apart from supplementation with calcium and vitamin D, the treatment for osteoporosis includes a variety of drugs with different mechanisms of actions; such drugs include bisphosphonates, selective estrogen receptor modulators, teriparatide, and denosumab [3]. However, adverse events may occur during treatment, including mandibular osteonecrosis, nephrotoxicity, and increased tumor risk [4]. Therefore, novel therapeutic targets to reverse osteoporosis-related bone loss are urgently required.
The gut microbiota (GM) plays a key role in a number of systemic disorders such as intestinal tumors, diabetes, non-alcoholic fatty liver, skin infections, and cardiovascular diseases [5–9]. Sjogren et al [10] found that germ-free (GF) mice exhibited increased bone mass with reduced number of osteoclasts compared to conventionally raised mice. Similarly, Li et al found that the GM was central in sex steroid deficiency-induced trabecular bone loss due to increased gut permeability, expansion of Th17 cells, and upregulation of osteoclastic cytokines [11]. Furthermore, administration of antibiotics in young mice increased adiposity and hormone levels because of the substantial taxonomic changes in the GM [12]. These findings suggest that the GM is also involved in maintaining bone mass. Therefore, thorough understanding of the changes in GM during steroid deficiency-induced osteoporosis may be beneficial for the prevention and treatment of postmenopausal osteoporosis.
The GM impacts metabolic homeostasis mainly by secretion of metabolites and modulation of the host immune systems. Short chain fatty acids (SCFAs) secreted by the GM may induce an increase in the transcription of calcium binding proteins in human and murine Caco-2 cells [13, 14]. Butyric acid may regulate intestinal regulatory T cell proliferation and enhance osteoclast differentiation [15]. In addition, the GM also maintains bone homeostasis by regulating calcium absorption-related proteins and modulating tight junction proteins [11, 16, 17]. GM-derived lipopolysaccharide (LPS) and muramyl dipeptide (MDP) indirectly affect osteoclast proliferation and differentiation by inducing an inflammatory response [18, 19].
To date, the relationship between the changes in GM composition and steroid deficiency-induced osteoporosis have not been fully determined [20]. In the current study, we performed 16S rRNA and metagenome sequencing to investigate the thorough structural and functional GM changes in an ovariectomized (OVX) rat model and determine the correlation between GM and steroid deficiency-induced osteoporosis.
Results
Ovariectomy induces significant structural changes in the GM community
The Firmicutes/Bacteroidetes ratio (F/B ratio) in the control group remained consistent during the whole study, while the F/B ratio in the OVX group at 12 weeks post-operation (OVX12) increased significantly compared with the F/B ratio before ovariectomy (OVX0) (P<0.05, Figure 1A). The GM remained steady in the CON group from CON0 to CON12 and the F/B ratios at the different time points in the CON group are similar to those in the OVX group at OVX0 (Figure 1B). These data suggest that the GM in the OVX group before ovariectomy (OVX0) is comparable to the GMs in the control group.
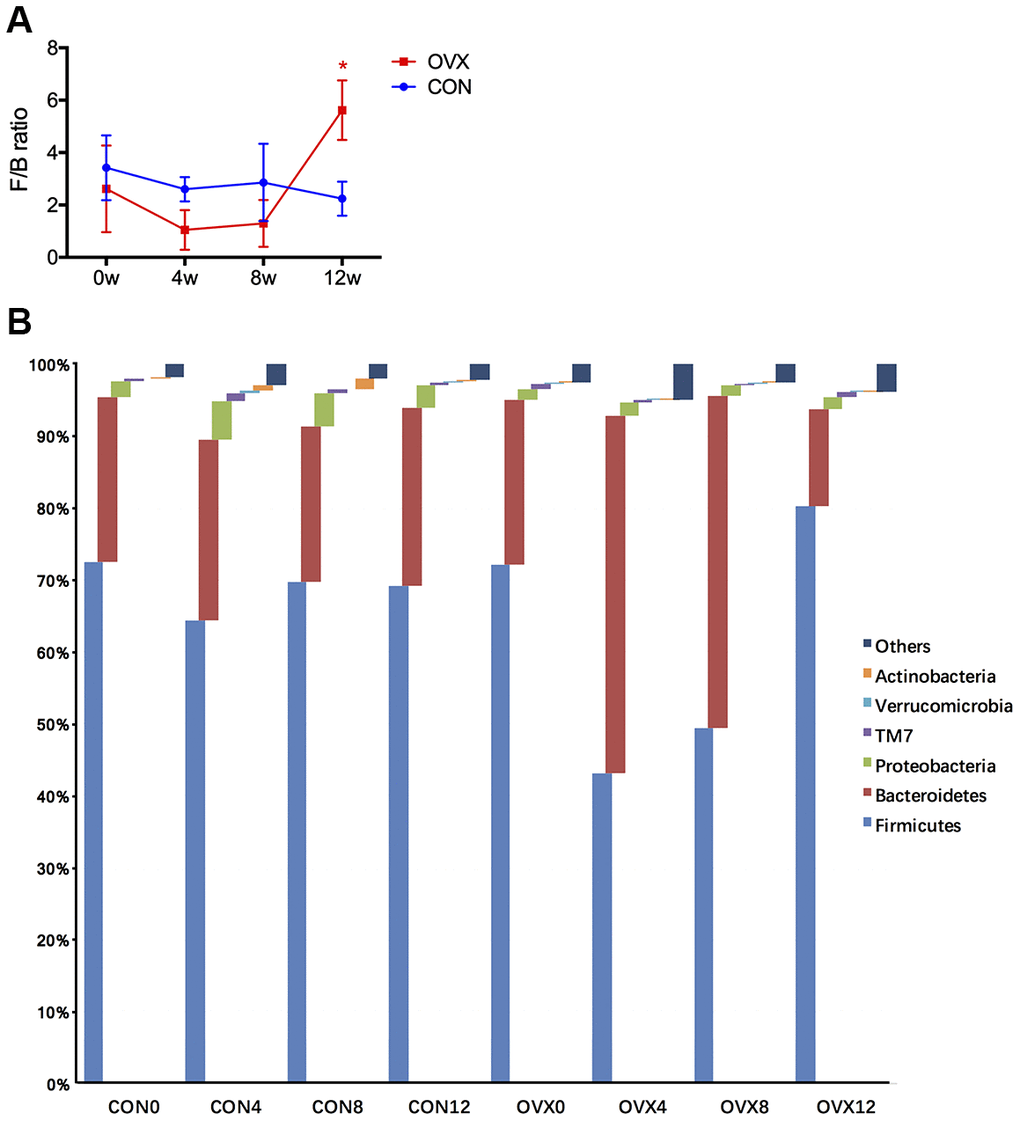
Figure 1. Gut microbiota taxonomic composition in the CON and the OVX groups. Firmicutes/Bacteroidetes ratio (F/B ratio) at different weeks following surgery (A). Annotation of phylum level for the six most abundant species of both groups (B).
A Venn diagram was constructed to visualize the number of common and unique operational taxonomic units (OTUs). We observed that the number of unique OTUs (28245, 7268, and 24541 OTUs at OVX4, OVX8, and OVX12, respectively) increased significantly following ovariectomy while the lowest abundance of unique OTUs was detected at OVX0 (4952 OTUs) (Figure 2A). Next, alpha diversity was determined by ACE estimator, CHAO estimator, and Shannon index, identifying an increasing trend that suggested greater alpha diversity in the GM following ovariectomy (Figure 2B–2D). Furthermore, the gradually decreasing Simpson index also indicated greater alpha diversity in the OVX group (Figure 2E).
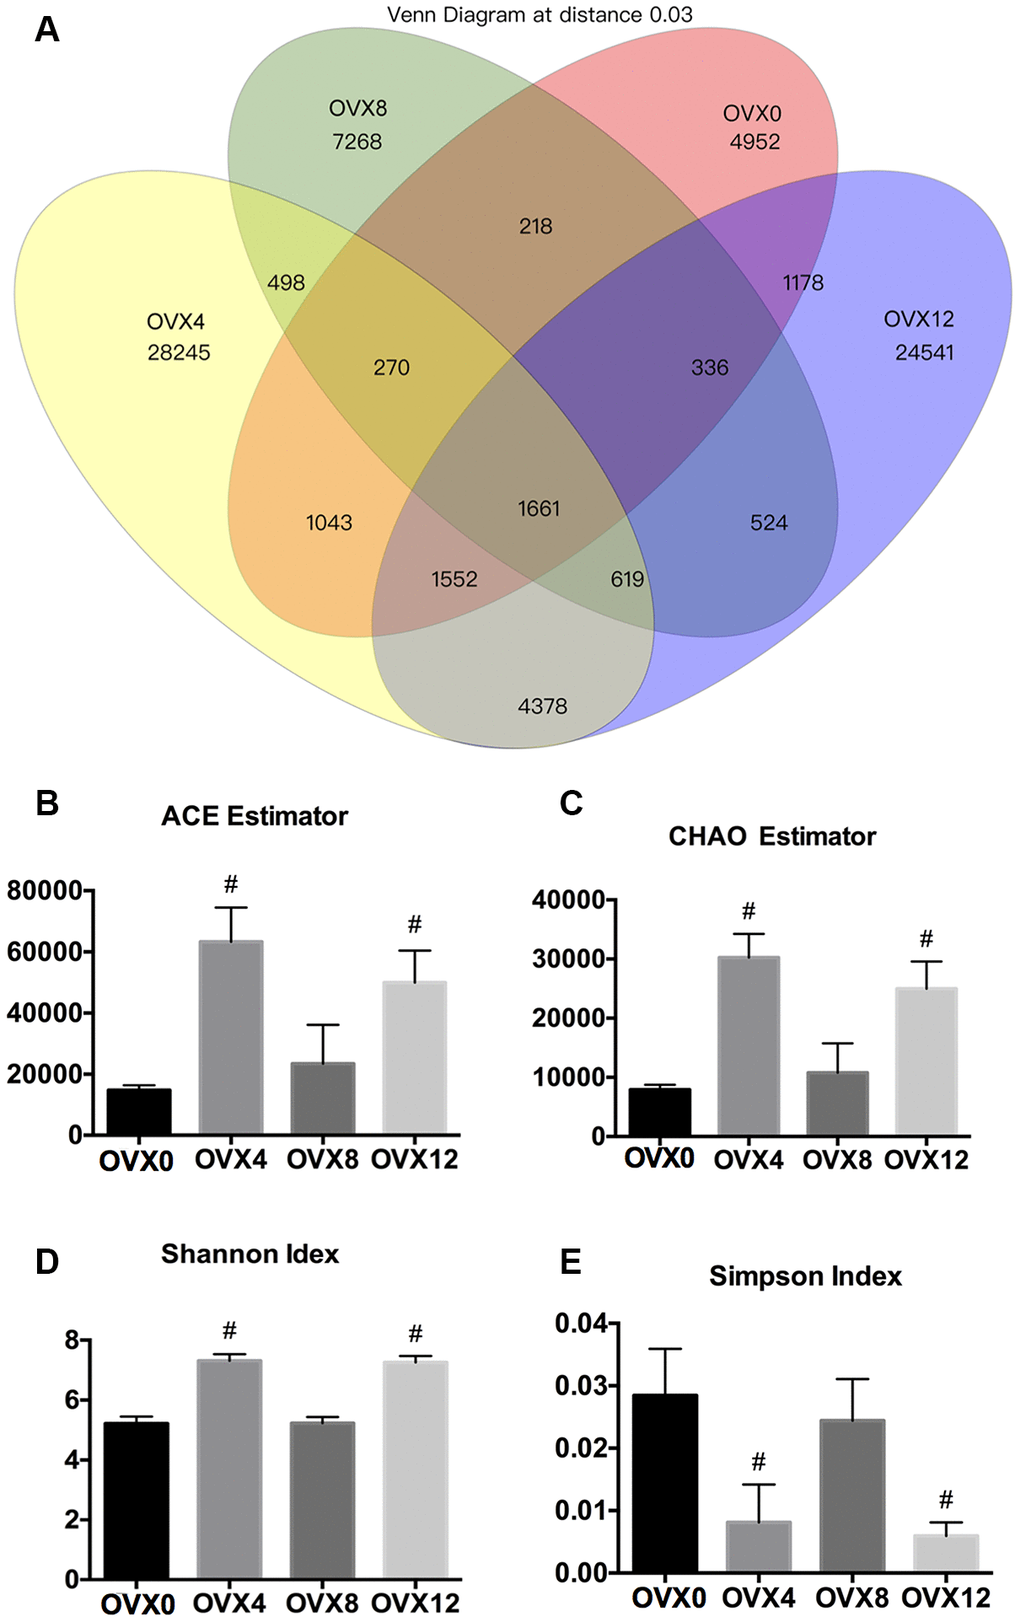
Figure 2. Venn diagram and alpha diversity assessment of samples following ovariectomy. Number of common and specific OTUs of samples with OTU=0.03 (A). Community richness assessment including the ACE estimator (B) and the Chao estimator (C); community diversity assessment including the Shannon index (D) and the Simpson index (E). Values were calculated using one-way ANOVA, #p < 0.01.
To determine beta diversity following ovariectomy, unweighted and weighted UniFrac principal coordinate analyses (PCoA) were generated to visualize the ecological distance. The closer the points the better the samples clustered. As shown by the unweighted UniFrac PCoA in Figure 3A, samples were well clustered both pre- and post-ovariectomy in principal coordinate 1 (PC1) (percent variation explained: 12.18%) and PC2 (6.26%). Furthermore, weighted UniFrac PCoA also confirmed these findings (Figure 3B). The samples at OVX0 were separated from those at OVX12 in PC2 (12.89%). Meanwhile, when introducing PC1 (37.45%), the samples from different time points were separated well, too (Figure 3B). Unifrac distance algorithm is another method to determine the beta diversity by hierarchical clustering of distance matrices. Unweighted and weighted UniFrac trees clustered and distinguished well (Figure 3C, 3D). These data suggest that the samples collected from each time point in the OVX group were homogenous enough for subsequent sequencing analysis. More importantly, microbes such as Acidobacteria, Chloroflexi, and Thermi were enriched at OVX0 compared with those after ovariectomy (Figure 3E).
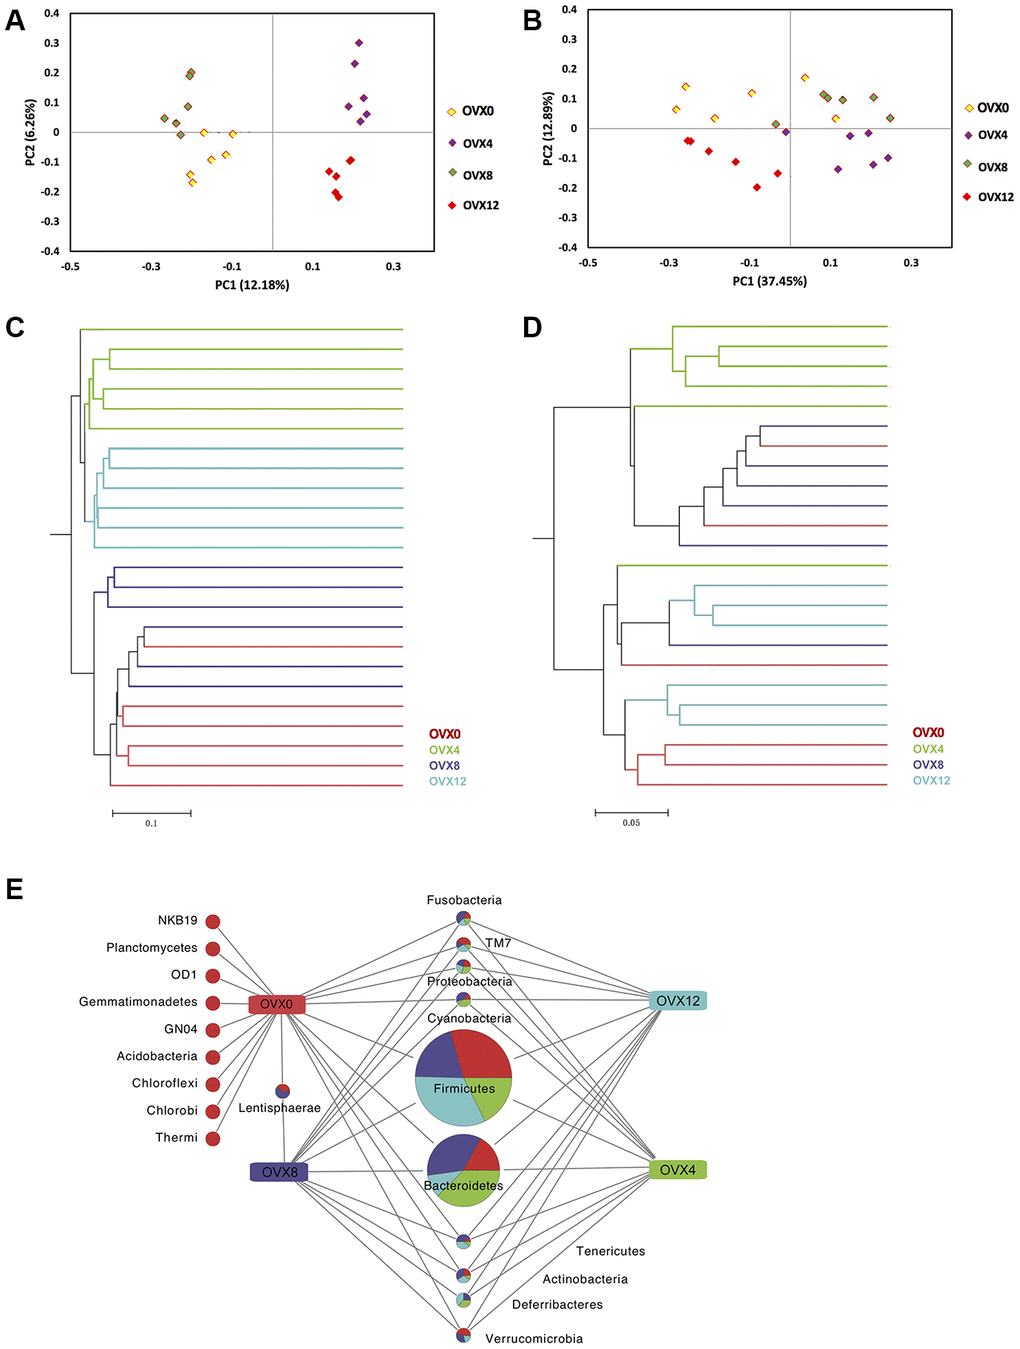
Figure 3. Beta diversity assessment and ecological difference analyses after ovariectomy. Principal coordinate analysis of 16S sequences using unweighted (A) and weighted (B) UniFrac showed distinct separation at different weeks following ovariectomy. Unweighted (C) and weighted (D) UniFrac hierarchical clustering trees also showed different GM composition. The common and characteristic phylum was obtained at OTU=0.03 (E).
Taxonomic differences between pre- and post-ovariectomy
GM taxonomy is of great importance for investigating the underlying mechanisms in metabolic diseases and correlating special species with pathogenesis. The Lachnospiraceae, Prevotella, Coprococcus, Ruminococcaceae and Clostridiales contents were more than 5% in pre- and post-ovariectomized rats (Figure 4A). In addition, Clostridium and Clostridiales of Firmicutes phyla increased significantly at OVX12, with Prevotella of Bacteroidetes phyla decreasing significantly at OVX12 compared with OVX0 (Figure 4A). The GM displayed the same trends after ovariectomy, as shown by the heat map analysis (Figure 4B). In order to determine detailed taxonomic differences, we further compared the abundances of microbes at OVX12 with those at OVX0. The abundances of Bactroidales and Clostridiales sub-groups increased significantly at OVX12 (Figure 4C). Interestingly, the abundance of Prevotella increased after ovariectomy until OVX8 and then decreased until OVX12 (Figure 4D). These species-specific changes may highlight candidates for the pathogenesis of steroid deficiency-induced osteoporosis. Ruminococcus flavefaciens was found to have the greatest variation of abundance in the clostridiales subgroup, which was also related to the estrobolome, an aggregate of enteric microbial genes (Supplementary Figure 1).
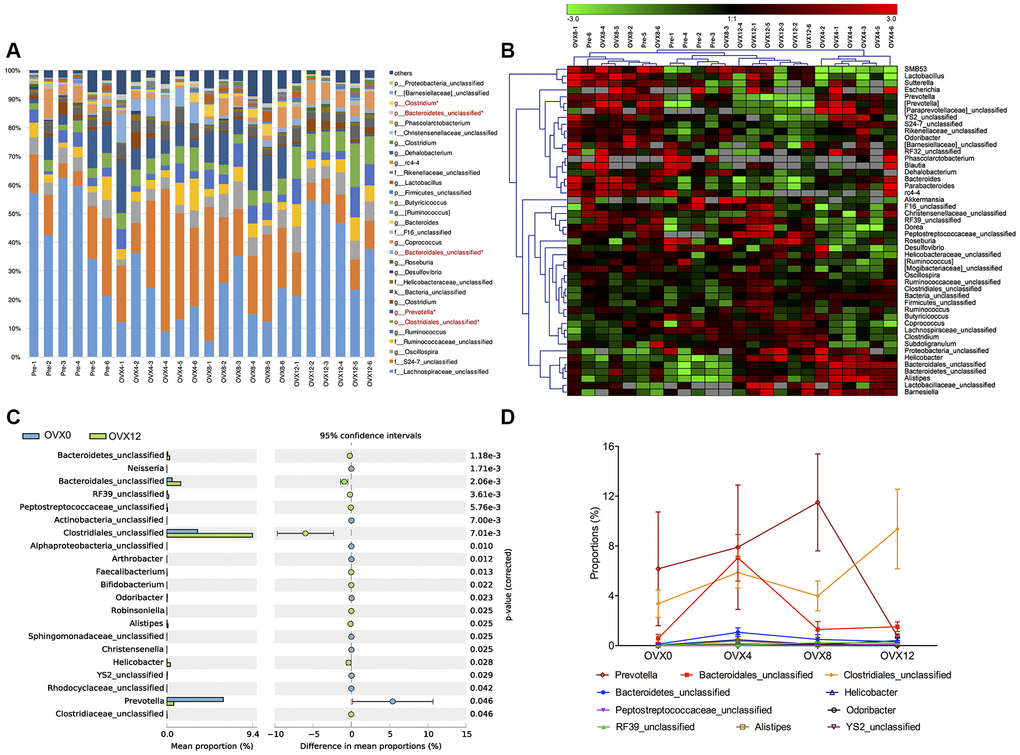
Figure 4. Annotation of genus level for the thirty most abundant species determined by 16S rRNA sequencing following ovariectomy. Microbiota in red font shows significant differences between OVX0 and OVX12 (A). Heat map of the microbial communities of samples were analyzed in genus level, OUT=0.03 (B). The abundant differences of genus comparison between pre- and post-ovariectomy (C). Species abundance changes of the ten most abundant genus following ovariectomy with significant differences (D). Values were analyzed using the Kruskal-Wallis H test with Benjamini-Hochberg FDR multiple test correction, *q<0.01.
The gene sets named “estrobolome” is the aggregate of microbial functional genes which could produce estrogen metabolizing enzyme including β-glucuronidase and β-glucosidases [21]. Since the estrobolome is able to metabolize estrogens, decline of GM from estrobolome gene annotation may result in estrogen deficiency and lead to bone loss [22]. In the OVX group, Clostridium and Roseburia genus showed a increasing trend after ovariectomy (Supplementary Figure 2).
Functional gene analyses of gut microbiome after ovariectomy
First, the genes involved in synthesis and metabolism of carbohydrates and nucleotides are shown in Figure 5A. ATP-dependent nuclease (OVX0: 0.022 ± 0.008% vs. OVX4: 0.050 ± 0.013%) and CRISPR reads increased significantly at OVX4 and then decreased gradually until OVX12 (0.017 ± 0.009%). Second, genes involved in fructooligosaccharides (FOS) and raffinose metabolism decreased gradually (OVX0: 0.055 ± 0.014% vs. OVX8: 0.041 ± 0.013%). The reads of genes related to microbial structure reached a peak at OVX4 and then decreased rapidly until OVX12 (Figure 5B). Last, reads of tryptophan synthesis maintained a stable level. However, reads of heme as well as hemin uptake and utilization increased in the first 4 weeks after ovariectomy (OVX0: 0.014 ± 0.006% vs. OVX4: 0.026 ± 0.012%) (Figure 5C).
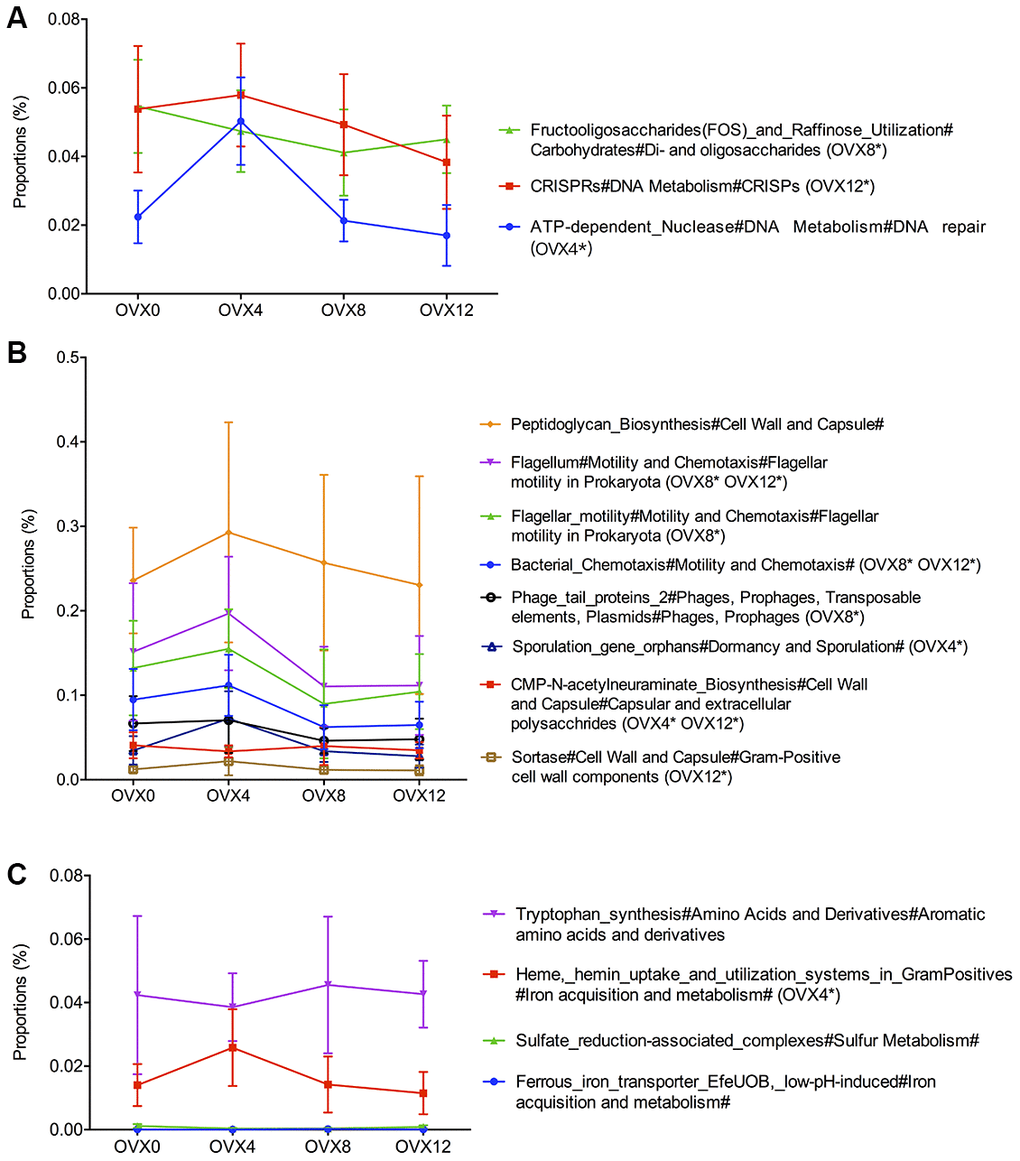
Figure 5. Functional gene analyses of the gut microbiota after ovariectomy. Functions related to synthesis and metabolism of carbohydrates and nucleotides (A), functions including microbial structure (B), and functions of synthesis and metabolism of small molecule organics compared with OVX0 (C). Values were analyzed using the Kruskal-Wallis H test with Benjamini-Hochberg FDR multiple test correction, *q<0.01, n=6.
Dynamic changes in bone mass and intestinal structure following ovariectomy
As expected, BMD decreased gradually after ovariectomy. BMD in the distal femur at OVX12 (0.1576 ± 0.0015 g/cm2) was significantly lower than that at OVX0 (0.1731 ± 0.0027 g/cm2) (P<0.01) (Supplementary Figure 3A). After ovariectomy, the level of serum estradiol showed the same trend as BMD. In addition, the osteoclastic index of CTX increased gradually, while the osteoblastic index of P1NP decreased following OVX (P<0.05) (Supplementary Figure 3B–3D). Qualitative and quantitative micro-CT measurements in the distal femur also confirmed osteoporotic changes (Supplementary Figure 3E, 3F). More importantly, these results were utilized in the following redundancy analysis (RDA) with taxonomy to determine the most specific GM species related to osteoporosis.
We next detected microstructure changes in the intestinal mucosa, with results showing that villus height decreased gradually (Supplementary Figure 3G). Moreover, the expression of the tight junction proteins Claudin-1, Occludin, and ZO-1 decreased significantly after ovariectomy (Supplementary Figure 3H–3J).
Specific GM changes are associated with bone loss in ovariectomized rats
Redundancy analysis was used to correlate the GM with bone turnover parameters. The green arrows represented GM in genus level and the red arrows represented biochemical indexes. The acute angle of arrows indicated that the positive correlation between variables, and obtuse angle indicated negative correlation. As shown in Figure 6, Ruminococcus, Clostridium, Coprococcus, and Robinsoniella positively correlated with osteoclastic indicators and all samples of OVX12 were aligned with bone loss. However, Bacteroides and Butyrivibrio showed opposite patterns at OVX12 and were negatively correlated with loss of bone mass. On the whole, the GM showed obvious changes after ovariectomy and these specific microflora had significant positive correlation with the pathogenesis of steroid deficiency-induced osteoporosis.
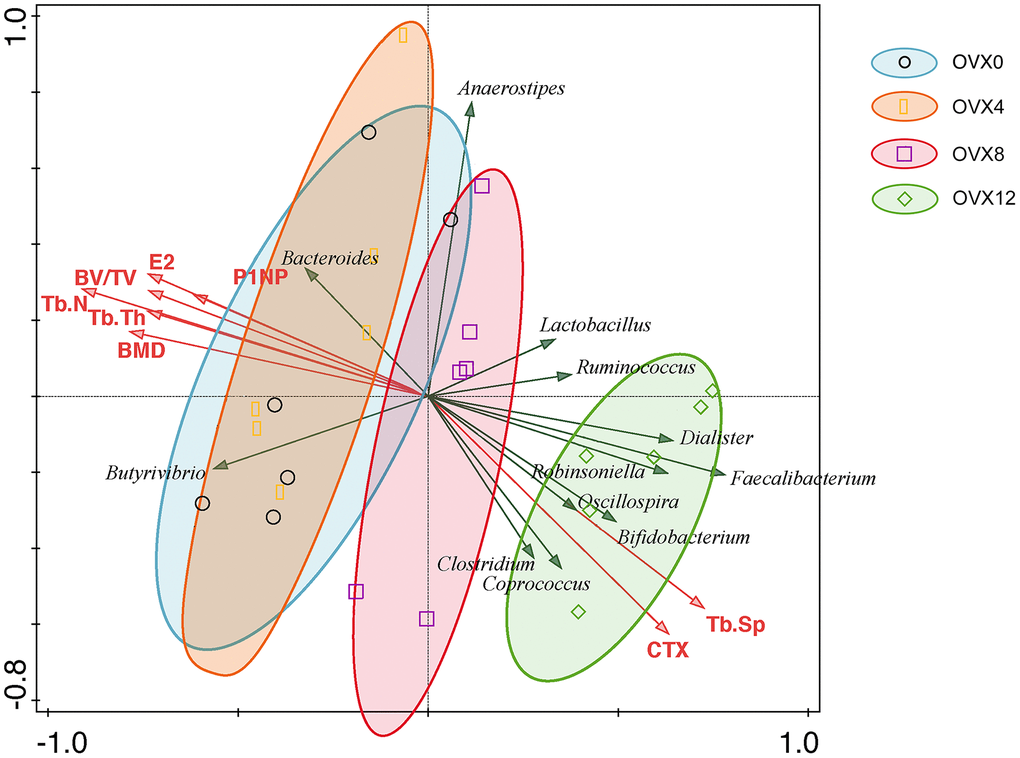
Figure 6. RDA was performed to correlate bone mass with bone turnover markers with gut microbiota in ovariectomized rats. The green arrows represent gut microbiota at the genus level and the red arrows represent biochemical indexes. The acute angle of arrows indicates the positive correlation between variables, and obtuse angles indicate negative correlations.
Discussion
To the best of our knowledge, this is the first study to thoroughly characterize GM changes in an ovariectomized rat model. Our data suggest that steroid deficiency-induced osteoporosis was associated with GM dysbiosis characterized by an increase in alpha diversity and a significantly altered GM composition and function. Moreover, increased OTUs and intestinal dysfunction may play an important role in bone loss caused by estrogen deficiency after ovariectomy. In addition, Ruminococcus flavefaciens may be a pathological candidate for steroid deficiency-induced osteoporosis.
Firmicutes and Bacteroidetes are the main phylum of the GM that can be identified, accounting for 80% of the total microbiome [23]. The Firmicutes/Bacteroidetes ratio (F/B ratio) is an important and representative biomarker in several diseases such as diabetes, obesity, and hypertension [24–26]. In this study, we observed an increased F/B ratio after ovariectomy, suggesting that it can also be used as an effective biomarker for steroid deficiency-induced osteoporosis.
The GM seems to be a key factor for regulating bone mass by changing the structure of intestinal mucosa epithelium and mediating the activation of immune cells [18]. In the current study, shortened epithelial villi of the ileum and reduced mRNA expression of Claudin-1, Occludin, and ZO-1 after ovariectomy indicate a weakened intestinal barrier function. At the same time, the continuously increasing OTUs after ovariectomy established the altered gut microbiota composition in osteoporosis. Therefore, estrogen deficiency after ovariectomy may result in alterations to the GM, which then subsequently impair intestinal mucosal permeability and activate immune pathways, stimulating CD4+ T cells to increase osteoclasts, ultimately resulting in bone loss [27].
The composition of the GM determines the function of the microbiome in the intestine. Compared with the GM composition before ovariectomy, Clostridium, Robinsoniella, Coprococcus, and Dialister increased significantly at 12 weeks after ovariectomy. Robinsoniella and Dialister are associated with bone infection and bone volume loss, respectively [28–30]. In addition, the trend of DNA repair and CRISPR genes shows an increase during the first four weeks after ovariectomy, indicating that estrogen deficiency-related inflammatory reactions may lead to impairment of DNA repair [31]. Genes related to heme and hemin uptake and utilization systems in Gram Positive bacteria show a trend towards increased expression in osteoporotic rats. Crosstalk between the heme and iron-sulfur synthesizing pathways is essential for producing hemoglobin. In addition, iron–sulfur clusters are crucial for mitochondrial metabolism by microRNA-210, which is involved in the regulation of postmenopausal osteoporosis through promotion of VEGF expression and osteoblast differentiation [32–34].
One of the major advantages of metagenome sequencing is the ability to determine the species present in the GM. In the current study, Ruminococcus flavefaciens, which is also related to the estrobolome, was found to be the GM with the greatest variation in abundance. Ruminococcus flavefaciens could degrade cellulose with the products of SCFAs. However, high systemic concentrations of propionate and butyrate were toxic and may lead to adverse effects in the host, mostly arising from increased serum levels of SCFAs due to the enhanced “leak” of the gut barrier [35, 36]. These data imply that the increment of Ruminococcus flavefaciens after estrogen deficiency may produce excessive SCFAs in the intestine. Therefore, bone loss in osteoporosis may be the combined result of increased SCFAs and the compromised gut barrier function.
Prevotella levels are considered to be closely related with inflammatory bone loss [37, 38]. In the present study, Prevotella increased rapidly and maintained a high abundance in the early and middle stages of osteoporosis. In untreated rheumatoid arthritis (RA) patients, 16S sequencing of stool samples revealed an increased abundance of Prevotella, which is strongly correlated with bone loss [39]. Furthermore, literature shows that Prevotella functions through microbe associated molecular patterns (MAMPs) to activate various toll-like receptors (TLRs) and through principal immune cells to release inflammatory mediators and promote chronic inflammation [40]. These findings indicate that Prevotella may be a clinically important pathobiont for steroid deficiency-induced osteoporosis. An interesting finding related to Prevotella in this study is that this bacterium decreased eight weeks after ovariectomy. The possible explanation of this phenomenon may be due to a community shift and the inflammatory functional loss of Prevotella in the late stage of bone loss after ovariectomy.
One limitation of our study is that the results are descriptive and completely based on GM composition. Therefore, there is a distinct lack of mechanistic investigation (e.g. measurement of butyrate concentrations, GM transplantation, etc.). As such, all interpretations can only be considered speculative. The immune system plays a critical role in mediating GM-related effects on the regulation of bone mass. Cytokines and chemokines such as TNF-α, CCL-2, IL-10, SERT (Serotonin Transporter) and Tph1 may be possible mediators between the GM and steroid deficiency-induced osteoporosis [41, 42]. Therefore, further mechanistic studies, including fecal microbiota transplantation, are needed to verify the causality of gut microbiota on steroid deficiency-induced osteoporosis.
Conclusions
This study demonstrated the extensive GM changes following ovariectomy, characterized by increases in alpha diversity and significant alteration of GM composition and function. Ruminococcus flavefaciens may be the possible pathological cause of steroid deficiency-induced osteoporosis.
Materials and Methods
Experimental design and samples collection
The present study was approved by the Ethical Committee of Experimental Animal Care of the Shanghai Ninth People's Hospital (SH9H-2019-A17-1). Forty female Sprague Dawley (SD) rats (250 ± 20.0 g), aged 3 months, were purchased from Slac Laboratory Animal Company (Slac., China, SCXK2012-0002). Rats were housed two per cage with a 12-h light-dark cycle and allowed free access to water and pelleted rodent diet. Rats were randomly divided into two groups: the OVX and control (CON) groups. Bilateral ovariectomy was performed on the OVX group, following general anesthesia, and the same amount of adipose tissue was taken from the CON group [43]. Animals were sacrificed at 4, 8, or 12 weeks post-operation. Fecal samples (280 ± 20 mg) were acquired by direct collection methods from each rat in both groups. These GM samples were frozen immediately and stored at −80 °C for subsequent sequencing.
Extraction and processing of microbial genomic DNA
Microbial genomic DNA was extracted from fecal samples using QIAamp DNA Stool Mini Kit (QIAGEN, USA). The primers 338F and 806R were used to amplify the V3-4 region of 16S rRNA genes. The thermocycling conditions for amplification included 20 cycles of 45 s at 95 °C, 30 s at 55 °C, and 30 s at 72 °C. Pyrosequencing was performed on an Illumina MiSeq instrument. Mothur (version 1.39.5) was used to assemble the paired FASTQ files [44].
Microbial DNA for metagenomic sequencing was fragmented into 400 bp reads and constructed by NEXTflex™ DNA Sequencing Kit compatible with the Biomek® FXp (Bio Scientific, USA). Then, we generated paired-end reads on Illumina HiseqTM2500 after cluster generation. Raw FASTQ files were filtered using FASTX-Toolkit. High-quality reads were spliced and assembled to obtain contigs with Mothur [44]. Scaffolds were constructed according to the known sequence of contigs. The main splicing parameter Kmer value was set to 55-85, and scaffolds of more than 500 bp were counted.
Bioinformatics
High quality DNA sequences were grouped into operational taxonomic units (OTUs) and compared with the SILVA reference database (V128) at 97% similarity [45]. The minimum sample size was considered as the criteria of data normalization. Community richness and diversity analyses (ACE, Chao, Shannon, and Simpson index) were performed using Mothur. To visually study the similarity or difference of data, principal coordinate analysis (PCoA) was performed by calculating ecological distance to determine the eigenvalues and eigenvectors between samples. The thetaYC algorithm was used to calculate the similarity of community structure of each sample at OTU=0.03. The similarities and differences between multiple samples were described and compared using tree branch structures. Heat map and clustering relationship diagrams of samples were constructed according to the classification information of samples. Taxonomy was assigned using the online software RDP classifier (80% threshold) based on the Ribosomal Database Project [46, 47].
For gene prediction, the program Prodigal v2.60 was used to predict metagenome content from genes. Taxonomic characterization (phylum, class, order, family, genus, and species) was annotated based on previous results using the software Magen [48]. Bowtie2 v2.2.5 was used to compare clean reads with genes [49]. SAMtools v0.1.19 was used to calculate the read abundance of each gene in each sample [50]. The MARS (MA-plot-based method with Random Sampling) model in DEGseq was used to calculate differences in the expression abundance of each gene. Fold changes >1 and false discovery rate <0.001 were classified as significantly different. Diamond v0.9.1.102 was used to conduct BLASTP homology alignment between gene sequences and the SEED database. Functional annotation contents of genes were obtained with statistically significant E value <10-10. β-glucuronidases and β-glucosidases were considered as genes of the estrobolome [22]. All microflora in genus level sequenced by 16S rRNA in the current study was annotated based on “estrobolome”, and the obtained species was considered as estrobolome-associated bacteria. Redundancy analysis (RDA) was performed using the Vegan package in R.
Dual energy X-ray measurement
Bone mineral density (BMD) of animals was determined by dual energy X-ray absorptiometry (DXA, Hologic Discovery A, USA).
Micro-CT scanning
Distal femurs were scanned with a high resolution micro-CT 81system (Scanco Medical AG, Bruettiselien, Switzerland). The spatial resolution was 10 μm. Beam strength was set at 70 peak kV and 114 μA. Cubic voxels with a side length of 10 μm were used to represent measured objects [43]. A volume of interest (VOI) with 2-3 mm length of femoral trabecular region was selected (sigma=1.2, support=2, threshold=180). Histomorphometric parameters were computed by Scanco Medical software.
ELISA assays
Serum estradiol, P1NP and CTX were measured using ELISA assay kits (XLCC, Shanghai YBL Biomedical Technologies, China) according to the manufacturer’s protocol.
Intestinal H&E staining
For histological analyses, the rat intestine was cut longitudinally and then stained by H&E. Morphological characteristics were examined under light microscopy (Olympus, Japan).
Real-time PCR
The mRNA of Claudin-1, Occludin, and ZO-1 were determined by real-time PCR. Real-time PCR was performed with TB Green Premix Ex Taq (Takara Bio Inc., Japan) using the ABI 7500 system (Applied Biosystems, USA). The primer sequences are shown in Supplementary Table 1.
Statistical analyses
The statistical significance of bone mass and biochemical indexes was calculated using one-way analysis of variance (ANOVA) in GraphPad Prism (GraphPad Software Inc., USA, version 6.0). All data are expressed as mean values ± standard deviation (SD). Statistical significance was indicated as follows: *p < 0.05; #p < 0.01. Comparisons of abundance values for taxonomy and functional gene were analyzed using the Kruskal-Wallis H test with Benjamini-Hochberg FDR multiple test correction by STAMP version 2.1.3. Values with q<0.01 were considered statistically significant.
Ethics approval
The study received ethics approval from the Ethics Committee of Shanghai Ninth People’s Hospital (SH9H-2019-A17-1).
Author Contributions
LF, YS and YH designed the experiments. SM performed the experiments and acquired the data. SM and LF analyzed the data. SM, YH and LF supervised the project and wrote the manuscript.
Conflicts of Interest
The authors declare that they have no conflicts of interest.
Funding
This work was supported by the Interdisciplinary Research of 9th People's Hospital affiliated to Shanghai Jiao Tong University School of Medicine (Grant no. JYJC201809), Shanghai Clinical Medical Center (Grant no. 2017ZZ01023) and Shanghai Municipal Key Clinical Specialty.
References
- 1. Ensrud KE, Crandall CJ. Osteoporosis. Ann Intern Med. 2017; 167:ITC17–ITC32. https://doi.org/10.7326/AITC201708010 [PubMed]
- 2. Riggs BL, Melton LJ
3rd . The worldwide problem of osteoporosis: insights afforded by epidemiology. Bone. 1995; 17:505S–11S. https://doi.org/10.1016/8756-3282(95)00258-4 [PubMed] - 3. Kanis JA, McCloskey EV, Johansson H, Cooper C, Rizzoli R, Reginster JY, and Scientific Advisory Board of the European Society for Clinical and Economic Aspects of Osteoporosis and Osteoarthritis (ESCEO), and the Committee of Scientific Advisors of the International Osteoporosis Foundation (IOF). European guidance for the diagnosis and management of osteoporosis in postmenopausal women. Osteoporos Int. 2013; 24:23–57. https://doi.org/10.1007/s00198-012-2074-y [PubMed]
- 4. Compston J, Cooper A, Cooper C, Francis R, Kanis JA, Marsh D, McCloskey EV, Reid DM, Selby P, Wilkins M, and National Osteoporosis Guideline Group (NOGG). Guidelines for the diagnosis and management of osteoporosis in postmenopausal women and men from the age of 50 years in the UK. Maturitas. 2009; 62:105–08. https://doi.org/10.1016/j.maturitas.2008.11.022 [PubMed]
- 5. Epithelial calcineurin promotes microbiota-dependent colorectal cancer. Cancer Discov. 2016; 6:OF14. https://doi.org/10.1158/2159-8290.CD-RW2016-070 [PubMed]
- 6. Nicholson JK, Holmes E, Kinross J, Burcelin R, Gibson G, Jia W, Pettersson S. Host-gut microbiota metabolic interactions. Science. 2012; 336:1262–67. https://doi.org/10.1126/science.1223813 [PubMed]
- 7. Abu-Shanab A, Quigley EM. The role of the gut microbiota in nonalcoholic fatty liver disease. Nat Rev Gastroenterol Hepatol. 2010; 7:691–701. https://doi.org/10.1038/nrgastro.2010.172 [PubMed]
- 8. Ridaura VK, Bouladoux N, Claesen J, Chen YE, Byrd AL, Constantinides MG, Merrill ED, Tamoutounour S, Fischbach MA, Belkaid Y. Contextual control of skin immunity and inflammation by Corynebacterium. J Exp Med. 2018; 215:785–99. https://doi.org/10.1084/jem.20171079 [PubMed]
- 9. Ahmadmehrabi S, Tang WH. Gut microbiome and its role in cardiovascular diseases. Curr Opin Cardiol. 2017; 32:761–66. https://doi.org/10.1097/HCO.0000000000000445 [PubMed]
- 10. Sjögren K, Engdahl C, Henning P, Lerner UH, Tremaroli V, Lagerquist MK, Bäckhed F, Ohlsson C. The gut microbiota regulates bone mass in mice. J Bone Miner Res. 2012; 27:1357–67. https://doi.org/10.1002/jbmr.1588 [PubMed]
- 11. Li JY, Chassaing B, Tyagi AM, Vaccaro C, Luo T, Adams J, Darby TM, Weitzmann MN, Mulle JG, Gewirtz AT, Jones RM, Pacifici R. Sex steroid deficiency-associated bone loss is microbiota dependent and prevented by probiotics. J Clin Invest. 2016; 126:2049–63. https://doi.org/10.1172/JCI86062 [PubMed]
- 12. Cho I, Yamanishi S, Cox L, Methé BA, Zavadil J, Li K, Gao Z, Mahana D, Raju K, Teitler I, Li H, Alekseyenko AV, Blaser MJ. Antibiotics in early life alter the murine colonic microbiome and adiposity. Nature. 2012; 488:621–26. https://doi.org/10.1038/nature11400 [PubMed]
- 13. Morrison DJ, Preston T. Formation of short chain fatty acids by the gut microbiota and their impact on human metabolism. Gut Microbes. 2016; 7:189–200. https://doi.org/10.1080/19490976.2015.1134082 [PubMed]
- 14. Fukushima A, Aizaki Y, Sakuma K. Short-chain fatty acids induce intestinal transient receptor potential vanilloid type 6 expression in rats and caco-2 cells. J Nutr. 2009; 139:20–25. https://doi.org/10.3945/jn.108.096230 [PubMed]
- 15. Arpaia N, Campbell C, Fan X, Dikiy S, van der Veeken J, deRoos P, Liu H, Cross JR, Pfeffer K, Coffer PJ, Rudensky AY. Metabolites produced by commensal bacteria promote peripheral regulatory T-cell generation. Nature. 2013; 504:451–55. https://doi.org/10.1038/nature12726 [PubMed]
- 16. Weaver CM. Diet, gut microbiome, and bone health. Curr Osteoporos Rep. 2015; 13:125–30. https://doi.org/10.1007/s11914-015-0257-0 [PubMed]
- 17. Donohoe DR, Garge N, Zhang X, Sun W, O’Connell TM, Bunger MK, Bultman SJ. The microbiome and butyrate regulate energy metabolism and autophagy in the mammalian colon. Cell Metab. 2011; 13:517–26. https://doi.org/10.1016/j.cmet.2011.02.018 [PubMed]
- 18. Hernandez CJ, Guss JD, Luna M, Goldring SR. Links between the microbiome and bone. J Bone Miner Res. 2016; 31:1638–46. https://doi.org/10.1002/jbmr.2887 [PubMed]
- 19. Park OJ, Kim J, Yang J, Yun CH, Han SH. Muramyl dipeptide, a shared structural motif of peptidoglycans, is a novel inducer of bone formation through induction of Runx2. J Bone Miner Res. 2017; 32:1455–68. https://doi.org/10.1002/jbmr.3137 [PubMed]
- 20. Wang J, Wang Y, Gao W, Wang B, Zhao H, Zeng Y, Ji Y, Hao D. Diversity analysis of gut microbiota in osteoporosis and osteopenia patients. PeerJ. 2017; 5:e3450. https://doi.org/10.7717/peerj.3450 [PubMed]
- 21. Chen KL, Madak-Erdogan Z. Estrogen and microbiota crosstalk: should we pay attention? Trends Endocrinol Metab. 2016; 27:752–55. https://doi.org/10.1016/j.tem.2016.08.001 [PubMed]
- 22. Plottel CS, Blaser MJ. Microbiome and Malignancy. Cell Host Microbe. 2011; 10:324–35. https://doi.org/10.1016/j.chom.2011.10.003 [PubMed]
- 23. Lay C, Sutren M, Rochet V, Saunier K, Doré J, Rigottier-Gois L. Design and validation of 16S rRNA probes to enumerate members of the clostridium leptum subgroup in human faecal microbiota. Environ Microbiol. 2005; 7:933–46. https://doi.org/10.1111/j.1462-2920.2005.00763.x [PubMed]
- 24. Everard A, Cani PD. Diabetes, obesity and gut microbiota. Best Pract Res Clin Gastroenterol. 2013; 27:73–83. https://doi.org/10.1016/j.bpg.2013.03.007 [PubMed]
- 25. Ley RE, Bäckhed F, Turnbaugh P, Lozupone CA, Knight RD, Gordon JI. Obesity alters gut microbial ecology. Proc Natl Acad Sci USA. 2005; 102:11070–75. https://doi.org/10.1073/pnas.0504978102 [PubMed]
- 26. Yang T, Santisteban MM, Rodriguez V, Li E, Ahmari N, Carvajal JM, Zadeh M, Gong M, Qi Y, Zubcevic J, Sahay B, Pepine CJ, Raizada MK, Mohamadzadeh M. Gut dysbiosis is linked to hypertension. Hypertension. 2015; 65:1331–40. https://doi.org/10.1161/HYPERTENSIONAHA.115.05315 [PubMed]
- 27. Xu X, Jia X, Mo L, Liu C, Zheng L, Yuan Q, Zhou X. Intestinal microbiota: a potential target for the treatment of postmenopausal osteoporosis. Bone Res. 2017; 5:17046. https://doi.org/10.1038/boneres.2017.46 [PubMed]
- 28. Schröttner P, Hartwich K, Bunk B, Schober I, Helbig S, Rudolph WW, Gunzer F. Detection of robinsoniella peoriensis in multiple bone samples of a trauma patient. Anaerobe. 2019; 59:14–18. https://doi.org/10.1016/j.anaerobe.2019.05.001 [PubMed]
- 29. Furquim CP, Soares GM, Ribeiro LL, Azcarate-Peril MA, Butz N, Roach J, Moss K, Bonfim C, Torres-Pereira CC, Teles FR. The salivary microbiome and oral cancer risk: a pilot study in fanconi anemia. J Dent Res. 2017; 96:292–99. https://doi.org/10.1177/0022034516678169 [PubMed]
- 30. Verdugo F, Castillo A, Moragues MD, Pontón J. Bone microbial contamination influences autogenous grafting in sinus augmentation. J Periodontol. 2009; 80:1355–64. https://doi.org/10.1902/jop.2009.090113 [PubMed]
- 31. Green AR, Aleskandarany MA, Ali R, Hodgson EG, Atabani S, De Souza K, Rakha EA, Ellis IO, Madhusudan S. Clinical impact of tumor DNA repair expression and T-cell infiltration in breast cancers. Cancer Immunol Res. 2017; 5:292–99. https://doi.org/10.1158/2326-6066.CIR-16-0195 [PubMed]
- 32. Kafina MD, Paw BH. Intracellular iron and heme trafficking and metabolism in developing erythroblasts. Metallomics. 2017; 9:1193–203. https://doi.org/10.1039/c7mt00103g [PubMed]
- 33. White K, Lu Y, Annis S, Hale AE, Chau BN, Dahlman JE, Hemann C, Opotowsky AR, Vargas SO, Rosas I, Perrella MA, Osorio JC, Haley KJ, et al. Genetic and hypoxic alterations of the microRNA-210-ISCU1/2 axis promote iron-sulfur deficiency and pulmonary hypertension. EMBO Mol Med. 2015; 7:695–713. https://doi.org/10.15252/emmm.201404511 [PubMed]
- 34. Liu XD, Cai F, Liu L, Zhang Y, Yang AL. MicroRNA-210 is involved in the regulation of postmenopausal osteoporosis through promotion of VEGF expression and osteoblast differentiation. Biol Chem. 2015; 396:339–47. https://doi.org/10.1515/hsz-2014-0268 [PubMed]
- 35. Bloemen JG, Olde Damink SW, Venema K, Buurman WA, Jalan R, Dejong CH. Short chain fatty acids exchange: is the cirrhotic, dysfunctional liver still able to clear them? Clin Nutr. 2010; 29:365–69. https://doi.org/10.1016/j.clnu.2009.10.002 [PubMed]
- 36. den Besten G, van Eunen K, Groen AK, Venema K, Reijngoud DJ, Bakker BM. The role of short-chain fatty acids in the interplay between diet, gut microbiota, and host energy metabolism. J Lipid Res. 2013; 54:2325–40. https://doi.org/10.1194/jlr.R036012 [PubMed]
- 37. Choi EY, Bae SH, Ha MH, Choe SH, Hyeon JY, Choi JI, Choi IS, Kim SJ. Genistein suppresses prevotella intermedia lipopolysaccharide-induced inflammatory response in macrophages and attenuates alveolar bone loss in ligature-induced periodontitis. Arch Oral Biol. 2016; 62:70–79. https://doi.org/10.1016/j.archoralbio.2015.11.019 [PubMed]
- 38. Corrêa JD, Saraiva AM, Queiroz-Junior CM, Madeira MF, Duarte PM, Teixeira MM, Souza DG, da Silva TA. Arthritis-induced alveolar bone loss is associated with changes in the composition of oral microbiota. Anaerobe. 2016; 39:91–96. https://doi.org/10.1016/j.anaerobe.2016.03.006 [PubMed]
- 39. Scher JU, Sczesnak A, Longman RS, Segata N, Ubeda C, Bielski C, Rostron T, Cerundolo V, Pamer EG, Abramson SB, Huttenhower C, Littman DR. Expansion of intestinal prevotella copri correlates with enhanced susceptibility to arthritis. Elife. 2013; 2:e01202. https://doi.org/10.7554/eLife.01202 [PubMed]
- 40. Larsen JM. The immune response to prevotella bacteria in chronic inflammatory disease. Immunology. 2017; 151:363–74. https://doi.org/10.1111/imm.12760 [PubMed]
- 41. Iqbal J, Yuen T, Sun L, Zaidi M. From the gut to the strut: where inflammation reigns, bone abstains. J Clin Invest. 2016; 126:2045–48. https://doi.org/10.1172/JCI87430 [PubMed]
- 42. Ohlsson C, Sjögren K. Effects of the gut microbiota on bone mass. Trends Endocrinol Metab. 2015; 26:69–74. https://doi.org/10.1016/j.tem.2014.11.004 [PubMed]
- 43. Fu L, Tang T, Miao Y, Hao Y, Dai K. Effect of 1,25-dihydroxy vitamin D3 on fracture healing and bone remodeling in ovariectomized rat femora. Bone. 2009; 44:893–98. https://doi.org/10.1016/j.bone.2009.01.378 [PubMed]
- 44. Schloss PD, Gevers D, Westcott SL. Reducing the effects of PCR amplification and sequencing artifacts on 16S rRNA-based studies. PLoS One. 2011; 6:e27310. https://doi.org/10.1371/journal.pone.0027310 [PubMed]
- 45. Quast C, Pruesse E, Yilmaz P, Gerken J, Schweer T, Yarza P, Peplies J, Glöckner FO. The SILVA ribosomal RNA gene database project: improved data processing and web-based tools. Nucleic Acids Res. 2013; 41:D590–6. https://doi.org/10.1093/nar/gks1219 [PubMed]
- 46. Wang Q, Garrity GM, Tiedje JM, Cole JR. Naive bayesian classifier for rapid assignment of rRNA sequences into the new bacterial taxonomy. Appl Environ Microbiol. 2007; 73:5261–67. https://doi.org/10.1128/AEM.00062-07 [PubMed]
- 47. Cole JR, Wang Q, Cardenas E, Fish J, Chai B, Farris RJ, Kulam-Syed-Mohideen AS, McGarrell DM, Marsh T, Garrity GM, Tiedje JM. The ribosomal database project: improved alignments and new tools for rRNA analysis. Nucleic Acids Res. 2009; 37:D141–45. https://doi.org/10.1093/nar/gkn879 [PubMed]
- 48. Hyatt D, LoCascio PF, Hauser LJ, Uberbacher EC. Gene and translation initiation site prediction in metagenomic sequences. Bioinformatics. 2012; 28:2223–30. https://doi.org/10.1093/bioinformatics/bts429 [PubMed]
- 49. Langmead B, Salzberg SL. Fast gapped-read alignment with bowtie 2. Nat Methods. 2012; 9:357–59. https://doi.org/10.1038/nmeth.1923 [PubMed]
- 50. Li H, Handsaker B, Wysoker A, Fennell T, Ruan J, Homer N, Marth G, Abecasis G, Durbin R, and 1000 Genome Project Data Processing Subgroup. The sequence alignment/map format and SAMtools. Bioinformatics. 2009; 25:2078–79. https://doi.org/10.1093/bioinformatics/btp352 [PubMed]