Introduction
Glioma is the most commonly occurring primary brain tumor and is highly malignant and aggressive [1–5]. Although the comprehensive treatment regimens are being optimized continuously, the overall survival of patients with glioblastoma remains less than 15 months [6–9]. This is in part because malignant gliomas display remarkable cellular heterogenicity and harbor glioma stem-like cells (GSCs), which act as seed cells initiating tumor propagation and progression. Thus, understanding the characteristics and mechanisms of GSCs will be important for the development of more-effective antiglioma strategies. Recently, the interactions between GSCs and tumor stromal cells in the glioma microenvironment have been attracting attention as potential targets for the treatment of gliomas [10–13]. Among tumor stromal cells, tumor-associated mesenchymal stem cells (MSCs) are thought to play a key role in tumor remodeling and progression [14–17]. At present, however, the precise actions of MSCs in promoting oncogenesis and the development of gliomas are not fully understood.
Cell fusion, as occurs with fertilization, is regarded as a necessary process that contributes to the diversity of the genotypes and phenotypes of progeny cells [18]. Cell fusion is also thought to be a potential mechanism underlying tumor heterogeneity [19]. Fusion of tumor cells with their stromal cells in the tumor microenvironment (TME) leads to faster cell expansion, resistance to chemotherapy, and enhanced invasiveness and migration as compared to the parental cells [20–23]. However, there has been little study of the fusion between tumor stem cells (TSCs) and interstitial cells in the TME. The phenotypes of the resultant fusion cells and the related molecular mechanisms needs further investigation.
In the present study, therefore, we investigated the fusion of GSCs and MSCs, which contributes to glioma proliferation, invasion, and migration. Notably, our findings indicate that miR-146b-5p-mediated SMARCA5 suppression inhibits TGF-β signaling, thereby suppressing the malignant behavior of GSC/MSC fusion cells.
Results
Primary culture of GSCs derived from clinical surgical specimens
Primary human GSCs from a 67-year-old male patient diagnosed left frontal glioblastoma were cultured in medium designed to support stem cell growth (Figure 1A). We also cultured GSC-SU4 cells, which exhibited typical sphere-like cell clusters (Supplementary Figure 1A) and grew while adhering to the culture plates (Supplementary Figure 1B). Flow cytometric analysis showed the positivity rates of the GSC marker CD133, Nestin, and SOX2 among GSC-SU4 cells were 4.21%, 30.81%, and 43.91%, respectively (Figure 1B). The co-expression of GSCs markers in GSC-SU4 cells was also analyzed (Supplementary Figure 5).
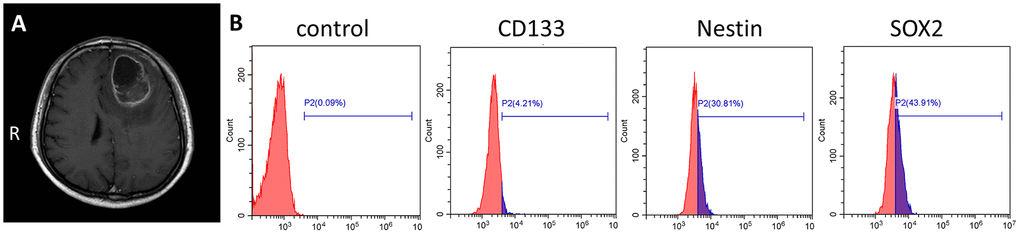
Figure 1. Primary culture of human GSC-SU4s. (A) Enhanced T1 MRI image of a 67-year-old male patient with left frontal mass. (B) Flow cytometric analysis of GSC markers on GSC-SU4 cells.
Generation of GSC-MSC fusion cells
GSC-SU4 cells stably expressed red fluorescent protein (SU4-RFPs) after lentivirus-mediated transfection exhibited both sphere-like clusters (Figure 2A) and adherent growth (Figure 2B). Bone marrow MSCs harvested from GFP-Balb/c mice (MSC-GFPs) were cultured in MSC medium (Figure 2C). To investigate the interaction between GSCs and MSCs, SU4-RFPs and MSC-GFPs were co-cultured at a ratio of 1:20, and RFP+/GFP+ double-positive cells (arrows) were detected after 10-14 days (Figure 2D and Supplementary Figure 2). Then these RFP+/GFP+ cells were then mono-cloned under a fluorescence microscope using the microtubule siphon method (Figure 2E) and subsequently subcultured (Figure 2F). We termed these GSC/MSC fusion cells F-GSC/MSCs.
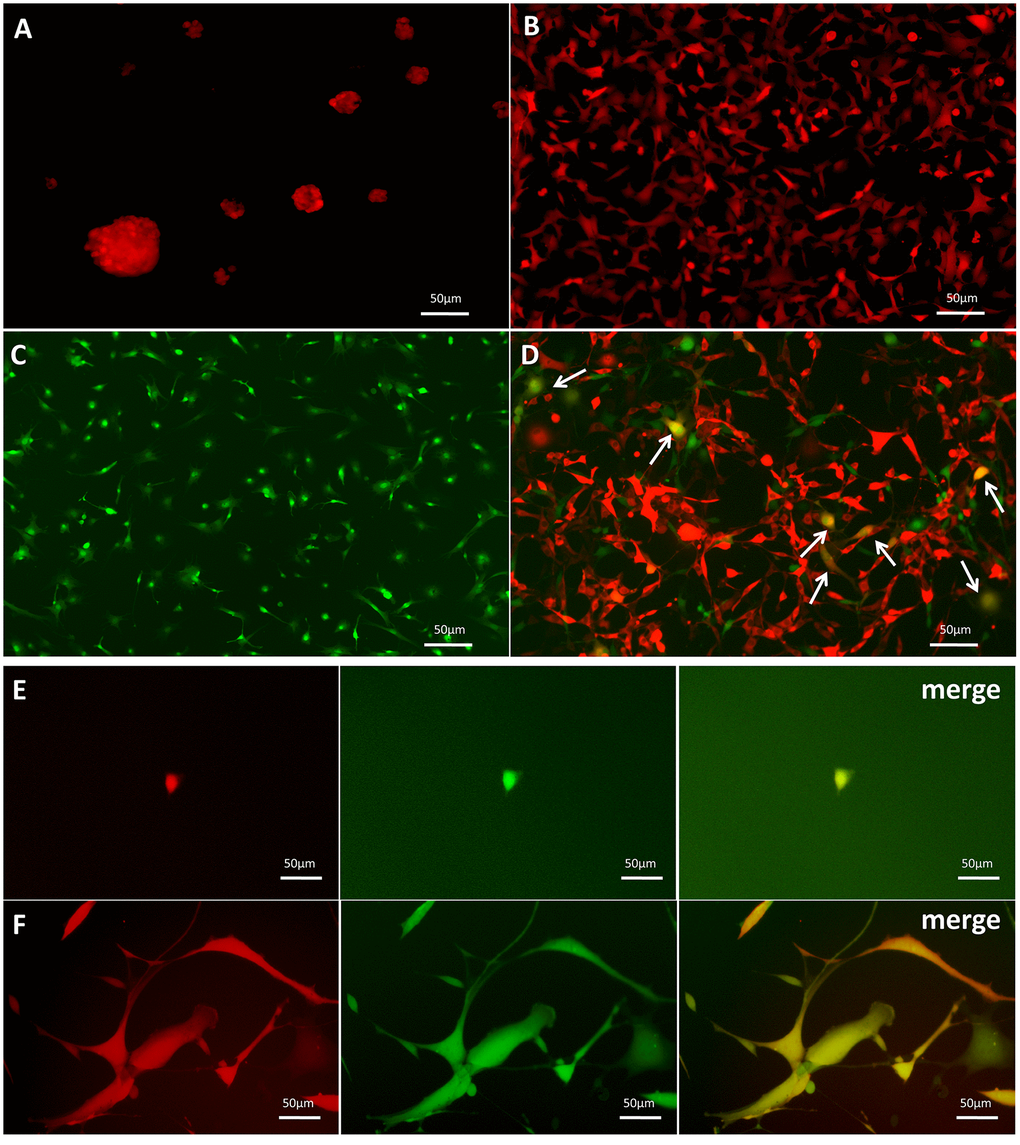
Figure 2. Dual-color fluorescence tracing of co-cultured SU4-RFPs and MSC GFPs, followed by mono-cloning of double-positive fluorescent cells. Stable expression of RFP in SU4 cells exhibiting (A) sphere-like or (B) adherent growth. (C) Expression of GFP in MSCs from GFP-Balb/c athymic nude mice. (D) RFP+/GFP+ cells (arrows) were observed in co-cultures of SU4-RFP and MSC-GFPs. (E) RFP+/GFP+ cells were mono-cloned from the co-cultures system and (F) subcultured.
F-GSC/MSCs are fusion cells derived from SU4-RFPs and MSC-GFPs
For further verify the fusion of MSCs and GSCs to produce F-GSC/MSCs, both transcription and translation levels of RFP/GFP genes in cells were detected using fluorescence in situ hybridization (FISH) and Western blotting. The results showed that F-GSC/MSCs co-expressed both of RFP and GFP genes, while SU4-RFPs and MSCs-GFPs expressed only RFP or GFP, respectively (Figure 3A, 3B). Immunocytochemical assays showed that F-GSC/MSCs were positive for both the GSC marker Nestin and the MSC markers CD105 and CD90 (Figure 3C). Chromosome karyotype analysis showed that the karyotype of SU4-RFPs was aneuploid with characteristics of human metacentric or submetacentric chromosomes, while the karyotype of MSC-GFPs was normal murine diploid with characteristics of murine telocentric chromosomes. The karyotype of F-GSC/MSCs harbored both human (arrows) and murine characteristic chromosome forms, and the murine telocentric chromosomes comprised the majority in the fusion cell karyotype (Figure 3D and Supplementary Figure 3). These results confirm that F-GSC/MSCs are fusion cells derived from SU4-RFPs and MSC-GFPs at the chromosome level.
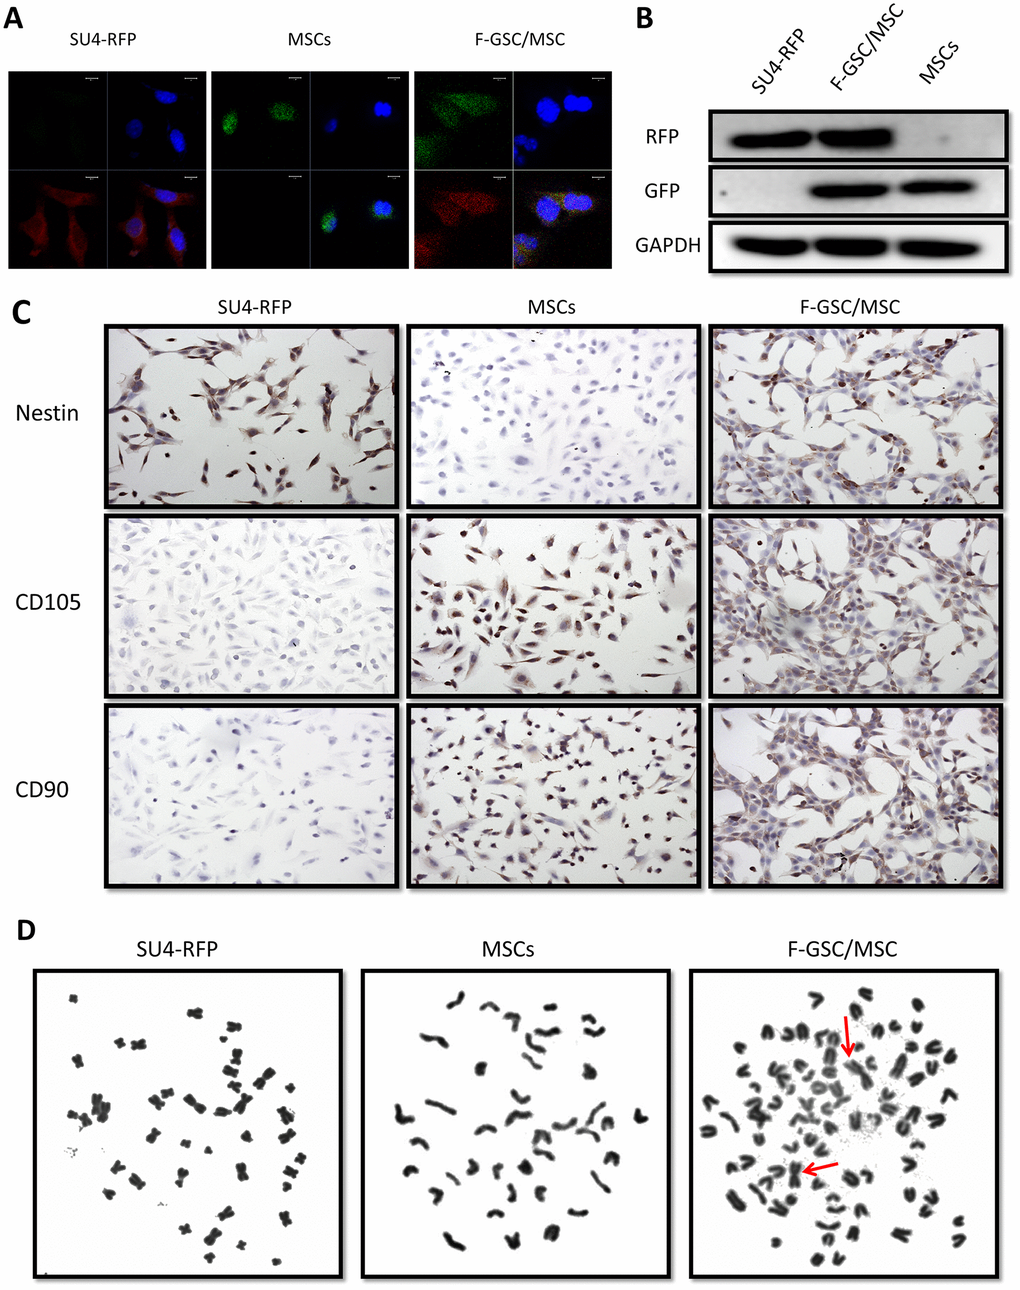
Figure 3. RFP+/GFP+ cells (F-GSC/MSC) are fusion cells derived from SU4-RFPs and MSC-GFPs. (A) RNA FISH and (B) Western blot analysis showed simultaneous expression of RFP/GFP in F-GSC/MSCs at the transcription and protein levels. (C) Cell surface marker identification showed that F-GSC/MSCs co-expressed markers of both GSCs and MSCs. (D) Human metacentric/submetacentric chromosomes (arrows) and murine telocentric chromosomes are observed in the karyotype of F-GSC/MSCs.
F-GSC/MSCs exhibit greater capacities for proliferation and invasion
To investigate the biological characteristics of F-GSC/MSCs, the proliferation and invasiveness of F-GSC/MSCs, SU4-RFPs, and MSC-GFPs were compared. CCK8 assays revealed that F-GSC/MSCs were significantly more proliferative than their parental SU4-RFPs and MSC-GFPs (Figure 4A). Clone formation experiments and 5 ethynyl-20-deoxyuridine EDU assays showed that colony numbers and EdU-positive F-GSC/MSCs increased to a markedly greater degree than SU4-RFPs and MSCs-GFP (Figure 4B and 4C). Cell cycle analysis showed that after GSC/MSC fusion, the proportion of S phase cells increased significantly, while the proportion of G0/G1 phase cells decreased (Figure 4D). In addition, Matrigel transwell assays showed that F GSC/MSCs were significantly more invasive than SU4-RFPs or MSC-GFPs.
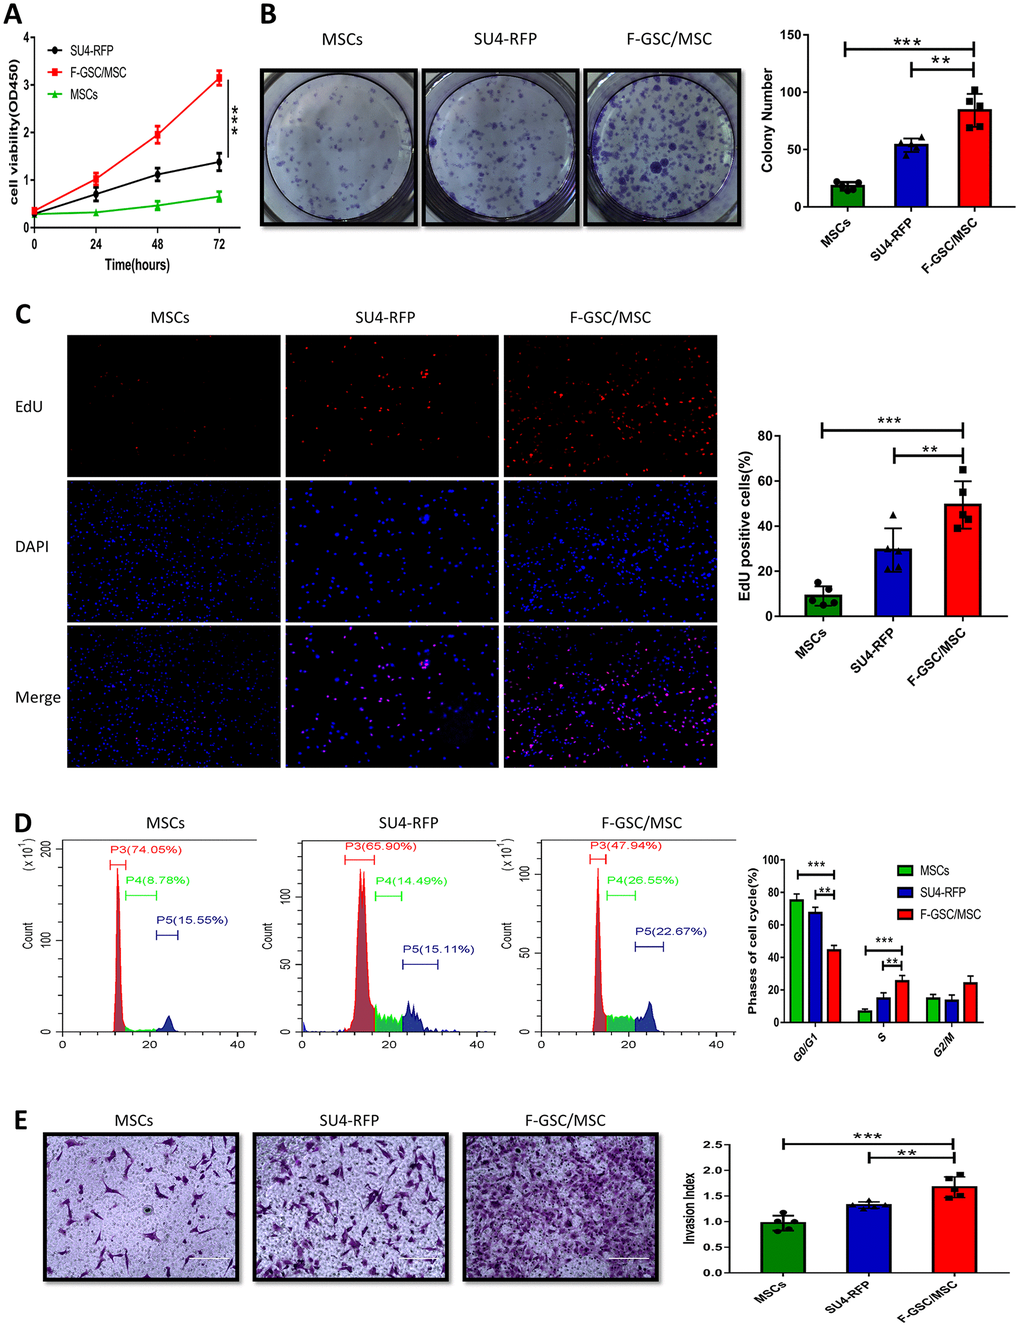
Figure 4. Proliferation and invasiveness are increased in F-GSC/MSCs. Proliferation of MSC-GFPs, SU4-RFPs and F-GSC/MSCs was measured in (A) CCK8 assays, (B) colony formation assays, (C) EdU assays, and (D) cell cycle analyses. (E) Invasiveness of the indicated cells was assessed with Matrigel transwell assays.
Downregulation of miR-146b-5p enhances the malignancy of F-GSC/MSCs
To evaluate the role of miRNAs in the malignant phenotype of F-GSC/MSCs, microarray analysis was used to compare the miRNA expression profiles of normal MSCs and F-GSC/MSCs (Figure 5A and Supplementary Figure 4). qPCR analysis verified that among the differentially expressed of miRNAs, eight were downregulated in F-GSC/MSCs, with miR-146b-5p exhibiting the lowest expression level (Figure 5B). In addition, qPCR also showed that miR-146b-5p expression was obviously higher in SU4-RFPs and human astrocytes than in F-GSC/MSCs (Figure 5C). This suggests the downregulation of miR-146b-5p may play a key role in enhancing the malignancy of F-GSC/MSCs. Consistent with that idea, CCK8 assays showed that upregulation of miR-146b-5p in F-GSC/MSCs achieved by transfecting miR-146b-5p mimics (Figure 5D) suppressed F-GSC/MSC proliferation (Figure 5E), colony formation (Figure 5F and 5G), and EdU incorporation (Figure 5H and 5I) as compared to controls transfected with control miRNA. In addition, Matrigel transwell assays showed that miR-146b-5p overexpression also reduced the invasiveness of F-GSC/MSCs (Figure 5J and 5K), while wound healing assays showed that miR-146b-5p overexpression inhibited recovery rates of F-GSC/MSCs (Figure 5L and 5M).
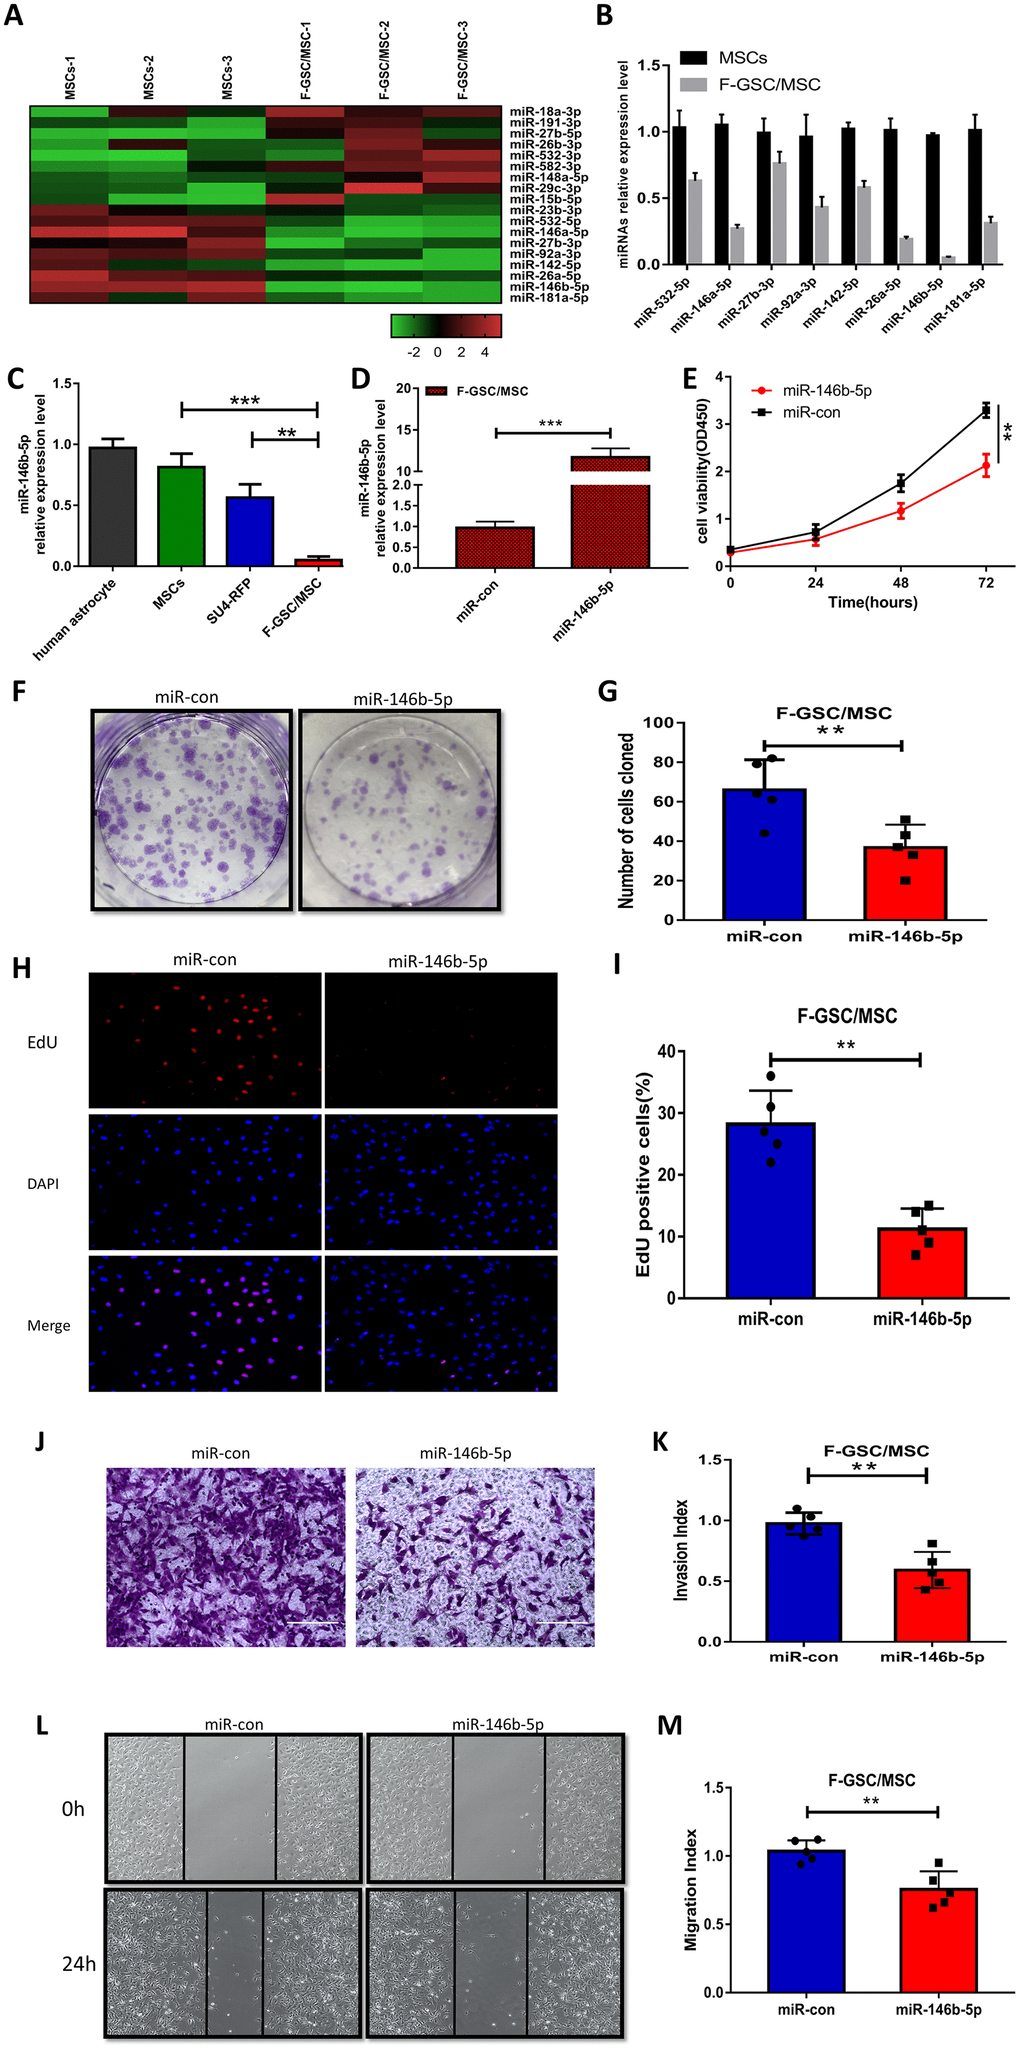
Figure 5. MiR-146b-5p is downregulated in F-GSC/MSCs and its overexpression inhibits F-GSC/MSC proliferation, invasion and migration. (A) Hierarchical clustering demonstrated distinguishable miRNA expression profiles in MSC and F GSC/MSC microarray data. (B) qPCR verified miR-146b-5p expression was the lowest among downregulated miRNAs in F-GSC/MSCs. miR-146b-5p expression in (C) F-GSC/MSs was lower than in MSC-GFPs or SU4-RFPs. (D) miR-146b-5p levels in F-GSC/MSs were upregulated by transfection of miR-146b-5p mimics. (E) Proliferation of F GSC/MSCs transfected with miR-146b-5p mimic or negative control was measured with CCK8 assays. (F and G) Colony formation assays with F GSC/MSCs transfected with miR-146b-5p mimic or negative control. (H and I) Effect of miR-146b-5p upregulation on F-GSC/MSC proliferation was determined using EdU assays. (J and K) Effect of miR-146b-5p upregulation on invasiveness of F GSC/MSCs was determined using Matrigel transwell assays. (L and M) Effect of miR-146b-5p on F-GSC/MSC migration was evaluated in wound-healing assays.
SMARCA5 is a negatively regulated downstream target of miR-146b-5p
To further clarify the potential mechanisms underlying the malignancy of F-GSC/MSCs, the target predictor (StarBase v3.0: http://starbase.sysu.edu.cn/) was applied to predict the possible targets of miR-146b-5p. Among the predicted candidate genes, SMARCA5 expression was dramatically reduced in F-GSC/MSCs overexpressing miR-146b-5p (Figure 6A). Bioinformatics analysis showed that SMARCA5 is a downstream mediator of miR-146b-5p whose mRNA contains a potential binding site (Figure 6B). Luciferase assays were then performed to determine whether miR-146b-5p directly binds to the 3’ untranslated region (UTR) of wild-type (WT) SMARCA5 mRNA and inhibited its expression, but had little effect on a mutant (MT) SMARCA5 vector (Figure 6C).
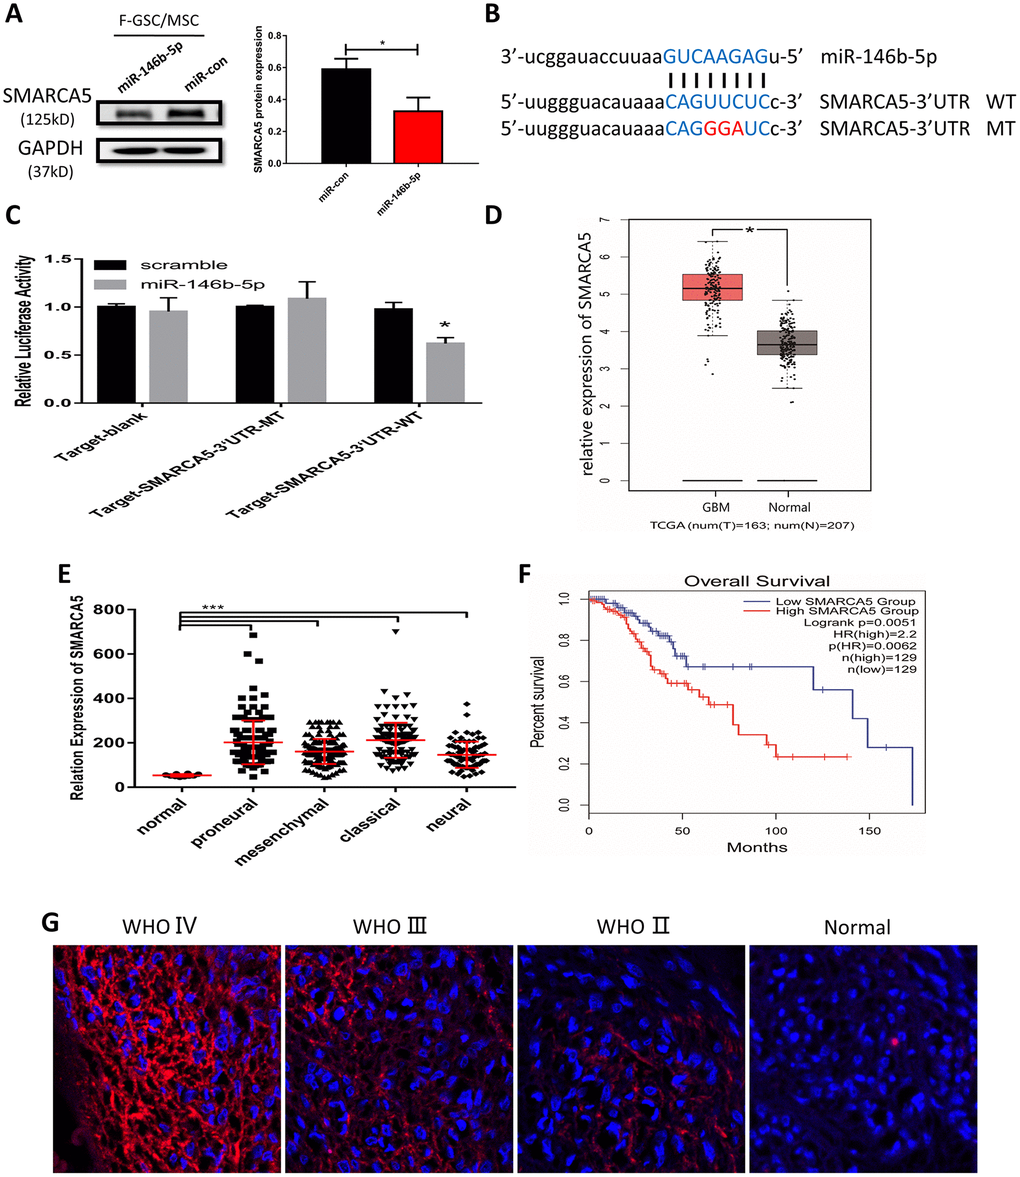
Figure 6. MiR-146b-5p negatively regulates SMARCA5, which is highly expressed in high-grade gliomas. (A) Western blot analysis of SMARCA5 expression in F GSC/MSCs overexpressing miR-146b-5p. (B) Predicted binding site between miR 146b-5p and SMARCA5. Wild type (WT) and mutant (MT) SMARCA5 vectors were constructed for luciferase assays. (C) Luciferase activity indicated miR-146b-5p bound directly to the 3’ UTR of SMARCA5. (D) SMARCA5 expression in glioblastoma and normal tissue from a TCGA dataset. (E) SMARCA5 expression in different glioblastoma subtypes in the TCGA dataset. (F) Overall survival among glioma patients in a low SMARCA5 and high SMARCA5 group. (G) Immunofluorescence analysis of SMARCA5 expression in different WHO grade gliomas.
SMARCA5 expression was also analyzed in a dataset from The Cancer Gene Atlas (TCGA). The results showed that SMARCA5 is dramatically up-regulated in glioblastoma as compared to normal brain tissue (Figure 6D). Moreover, the TCGA dataset indicated that SMARCA5 expression in all four of the glioblastoma subtypes (classical, mesenchymal, neural, and proneural) was significantly higher than in normal controls (Figure 6E). Survival curves for gliomas showed that the survival rates among patients exhibiting high SMARCA5 expression were much poorer than among those expressing low SMARCA5 levels (Figure 6F). In addition, analysis of SMARCA5 expression in gliomas with different WHO grades showed that, consistent with the TCGA data, SMARCA5 expression in high-grade gliomas was marked higher than in low-grade gliomas and normal tissue (Figure 6G). These data suggest SMARCA5 may be novel prognostic biomarker in glioma that is directly negatively regulated by miR-146b-5p.
SMARCA5 restoration rescued miR-146b-5p mediated inhibition of cell proliferation, invasion and migration in GSC/MSC fusion cells via the TGF-β signaling pathway
To further verify the impact of miR-146b-5p downregulation and the corresponding upregulation of SMARCA5 on the malignant phenotype of F GSC/MSCs, miR-146b-5p and/or SMARCA5 was overexpressed in F-GSC/MSCs, after which cell growth, migration, and invasion were evaluated both in vitro and in vivo. The results of CCK8, colony formation, and EdU assays showed that combined overexpression of SMARCA5 and miR-146b-5p could reverse the inhibitory effect of miR-146b-5p on F GSC/MSC proliferation (Figure 7A–7E). In addition, SMARCA5 expression reversed miR-146b-5p-mediated inhibition of tumor invasion and migration (Figure 7F–7I).
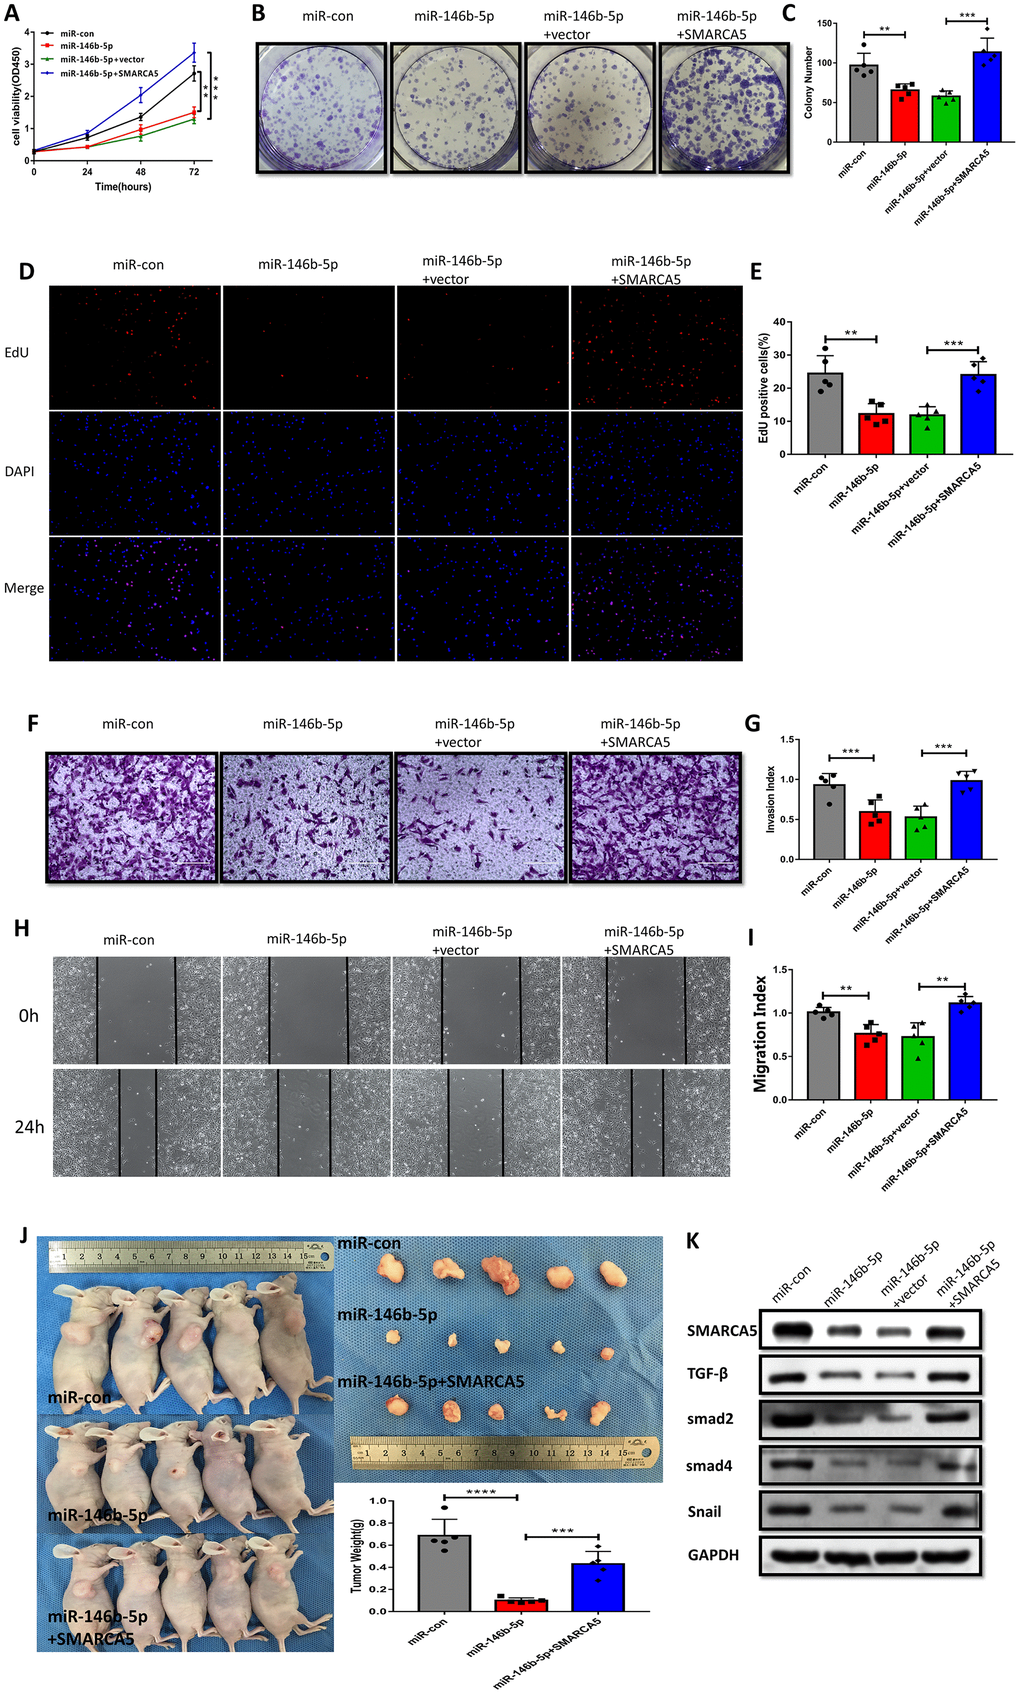
Figure 7. SMARCA5 restoration reverses miR-146b-5p-mediated inhibition of F GSC/MSC proliferation and metastasis. (A) CCK8, (B and C) colony formation, and (D and E) EdU assays were conducted to evaluate F GSC/MSC proliferation after transfection with miR-146b-5p alone or co-transfection with miR-146b-5p plus SMARCA5. (F and G) Transwell assays to assess the invasiveness of F GSC/MSCs transfected with miR-146b-5p alone or with miR-146b-5p plus SMARCA5. (H and I) Wound healing assays to assess migration of F GSC/MSCs transfected with miR 146b 5p alone or with miR-146b-5p plus SMARCA5. (J) Xenograft model for evaluation of tumorigenesis in vivo. (K) Western blot analysis of proteins in the TGF β pathway in F GSC/MSCs transfected with miR-146b-5p alone or with both miR 146b 5p and SMARCA5.
A F-GSC/MSC xenograft model was applied to investigate the actions of miR 146b 5p/SMARCA5 in vivo. Consistent with the in vitro observations, upregulation of both SMARCA5 and miR-146b-5p led to greater F-GSC/MSC tumor growth that was seen with upregulation of miR-146b-5p alone (Figure 7J). TGF-β signaling is known to play important roles promoting metastasis in many cancers [24, 25]. Within the tumors, F-GSC/MSCs overexpressing miR-146b-5p exhibited lower levels of TGF-β, Smad2, Smad4 protein expression (Figure 7K), as well as lower expression levels of Snail, which is involved in epithelial-mesenchymal transition (EMT) [26, 27]. Taken together, these results suggest that SMARCA5 upregulation abolishes the regulatory effects of miR-146b-5p on mediators in the TGF β pathway.
Discussion
Nearly 90% of cancer mortality is attributable to tumor invasion and metastasis [28]. Moreover, an increasing number of studies have shown that cell fusion may significantly promote cancer cells capacities for invasion and migration [29]. After spontaneous fusion between breast cancer cells and MSCs, the telomerase activity, proliferation and tumorigenicity of the fusion cells were significantly higher than those of their parental cells. Quick metastasis could occur through increased expression of metastasis-related genes, including S100A4 [30]. Hypoxia-induced apoptosis can stimulate fusion of MSCs with breast cancer cells, and the resultant fusion cells exhibit greater metastatic ability [23]. Epithelial-to-mesenchymal transition (EMT) is indispensable for tumor metastasis. Breast cancer cells trigger EMT and produce TSCs through fusion with MSCs, which increases their heterogeneity and metastatic capacity [31]. Through fusion between macrophages and breast cancer cells, expression of E-cadherin is downregulated and expression of N-cadherin, vimentin and snail are upregulated, together with increased expression of matrix metalloproteinase (MMP)-2, MMP-9, urokinase-type plasminogen activator (uPA), and S100A4. As a result, EMT emerges, leading to greater capacities for invasion and migration [32]. Similarly, fusion between lung cancer cells and MSCs leads to enhanced metastasis through EMT, with downregulation of E-cadherin and upregulation of N-cadherin, vimentin, α-SMA, and fibronectin-1. Also increased in the fusion cells was expression of EMT-related transcription factors, including Snail1, Slug, Twist1, ZEB1 and ZEB2. Gliomas undergo a process called proneural mesogenic transition (PMT), which was similar to EMT, and the resultant mesenchymal GSCs exhibit a more malignant phenotype than proneural GSCs, as they are more proliferative and invasive [33]. Based on those findings and the results of our experiments, we suggest that GSCs obtain a more malignant phenotype through fusion with MSCs via PMT, though this hypothesis remains to be tested.
Fusion cells are tumorigenic, harboring the characteristics and surface markers of both tumor cells and stromal cells [29]. When breast cancer cells fuse with breast stem cells (BSCs), the proliferation rate of the fusion cells is reportedly 1.5 times higher than that of the parental cancer cells and 10 times higher than that of the BSCs [34]. Fusion of hepatoma (HepG2) cells and embryonic stem cells (ESCs) produces more tumorigenic fusion cells, which are similar to TSCs, with enhanced expression of the TSC markers CD133, ALDH1 and CD44 [35]. MSCs can fuse with various tumor cells, and when spontaneous cell fusion occurs between lung cancer cells and bone marrow MSCs, the tumorigenicity of the resultant fusion cells is significantly enhanced, with expression of interstitial cell markers, vimentin and fibronectin [36]. After fusion of gastric cancer cells with MSCs, the fusion cells are more proliferative than their parental cells, and exhibit both stem-like properties and EMT with increased expression of both mesenchymal markers (vimentin and N cadherin) and TSC markers (CD44 and CD133) and decreased expression of E cadherin [22]. Upon fusion of MSCs with multiple myeloma cells, expression of Nanog, Sox2 and Oct4 increased significantly, and the drug resistance of the fusion cells was increased [20]. Finally, after fusion of GSCs with MSCs, the fusion cells exhibited enhanced angiogenic effects [37].
Most studies of glioma ascribe the poor prognosis and high rate of recurrence to the presence of GSCs [38–40]. They also report that the unlimited self-renewal capacity and persistent proliferation of GSCs [41–43] leads to resistance to radiotherapy and chemotherapy [44–46]. However, increasing attention is being paid to the TME [47, 48]. In the present study, we show that MSCs in the TME of gliomas could be transformed into malignant cells through fusion with GSCs, and the proliferation and metastasis of fusion cells were even greater than those of the GSCs, which may explain in part how terminally differentiated interstitial cells in the TME become cancer cells [49, 50].
A large number of studies of miRNAs and their corresponding pathways provide an avenue for exploring new markers for tumor grading, therapeutic effect evaluation, and prognosis [51, 52]. It was previously reported that miR-146b-5p can act as a tumor promoter or inhibitor in different tumors [53–56], but studies relevant to the role of miR-146b-5p in GSCs or MSCs in the glioma microenvironment were not available. In the present study, miR-146b-5p suppressed the malignancy of F-GSC/MSCs, and SMARCA5 was shown to be a downstream target gene of miR-146b-5p. SMARCA5 locates in the q31.1→q31.2 bands of chromosome 4 [57] and is regarded as a critical contributor to malignant tumors, such as gastric cancer [58], acute leukemia [59] and prostate cancer [60, 61], among others, where SMARCA5 is significantly upregulated and shown to promote cancer progression [62–64]. But its roles in GSCs the glioma microenvironment have not yet been described. In our experiments, we confirmed the role of a miR-146b-5p/SMARCA5/TGF-β axis in malignant F-GSC/MSCs in the glioma microenvironment, which may be a potential therapeutic target for treatment of glioma in the future.
A limitation of the present study is that it is based largely on GSC-MSC interactions in vitro, which may not fully reflect the situations in the real world of clinical patients. Further investigation will be needed to confirm the existence of F GSC/MSCs and the molecular mechanisms governing their behavior.
Materials and Methods
Tumor specimens, experimental animals, and lentivirus fluorescence transfection
Clinical tumor tissue specimens were obtained from glioma patients treated at the Department of Neurosurgery of the Second Affiliated Hospital of Soochow University after obtaining informed consent. Primary cultured human GSCs-SU4 cells were derived from an adult male patient diagnosed with primary glioblastoma multiforme (pGBM). Balb/c nude mice expressing green fluorescent protein (GFP) were bred under specific pathogen-free conditions at our experimental animal center, as previously described [65]. All of the clinical and animal studies adhered to the rules of the Ethics Committee of the Second Affiliated Hospital of Soochow University.
Stable transfection of red fluorescent protein (RFP) gene into SU4 cells was accomplished using a RFP lentivirus (Genepharma, China). The bone marrow cavities of the femurs and tibias of GFP Balb/c nude mice were flushed using MesenPRO Medium (Gibco, US) after sacrificing the mice under general anesthesia. The mixture of bone marrow cells was purified by flow cytometry to obtain the MSCs using antibodies against CD105 and CD90 (CST, US).
Fusion of glioma stem cells SU4-RFP and MSCs
Single-cell suspensions of SU4-RFP and MSCs were mixed at a 1:20 ratio and cultured in laminin coated plates in Nutrient Mixture F12/MesenPRO Medium (1:1, Gibco, US) including 1× B27 Supplement (Gibco, US), 20 ng/ml EGF (Gibco, US), 20 ng/ml bFGF (Gibco, US). After culture for 10-14 days, RFP/GFP double-positive (RFP+/GFP+) cells could be observed under a fluorescence microscope in the co-culture system. The RFP+/GFP+ cells were then mono-cloned from the co-culture system using micro-siphon techniques while being viewed under a fluorescence microscope. RFP+/GFP+ cells were then further subcultured and named after fusion GSC and BM MSC (F-GSC/MSC).
Cell culture and transfection
Human astrocytes (ATCC, US) and F-GSC/MSCs were cultured in Dulbecco’s modified Eagle medium (DMEM; Hyclone, US) containing 10% fetal bovine serum (FBS) (BI, Israel). GSCs-SU4 cells were cultured in DMEM/F12 neural stem cell culture medium (Hyclone, US) supplemented with 1x B27 Supplement (Gibco, US), 20 ng/ml EGF (Gibco, US) and 20 ng/ml bFGF (Gibco, US). All cells were cultured in an incubator (SANYO, JP) at 37°C under 5% CO2.
For the overexpression of miR-146b-5p and SMARCA5, F-GSC/MSCs were transfected by miR-146b-5p mimics/lentivirus, SMARCA5 overexpression vector, or their respective controls (GenePharma, Shanghai, China) according to the manufacturer’s protocol.
Flow cytometry for identification
After digestion and centrifugation, cells were re-suspended in 100 μl of phosphate buffer saline (PBS) and incubated with 3 μl primary anti-CD133, anti-Nestin, and anti-SOX2 antibodies (dilution 1:200) for 1-2 h at room temperature. The cells were then centrifuged, washed 3 times with PBS, and incubated with secondary antibody (Beyotime, China) for 1 h at room temperature. After centrifugation (1000 rpm) and 3 washes with PBS, the cells were suspended in 200 μl of PBS and analyzed using flow cytometry (BD Biosciences) with Cytexpert 2.0 software.
Fluorescence in situ hybridization (FISH)
Cells were seeded onto coverslips in 24-well plates, cultured to 70% confluence, fixed in 4% paraformaldehyde for 20 min, then washed for 5 min. The fixed cells were then permeabilized by digestion with proteinase K for 10 min, rinsed with 2× sodium saline citrate buffer (SSC) for 5min, fixed again in 1% paraformaldehyde for 10 min, and washed twice for 5 min each with PBS. The specimens were then dehydrated through a sequential 70%, 85%, 100% ethanol series and air-dried, after which probe hybridization solution was added and the samples were incubated at 37°C overnight. The samples were then washed three times for 5 min each with 50% formamide in 2×SSC at 53°C, then washed for three times for 5 min each with 2× SSC at 65°C. Lastly, the samples were stained with DAPI solution and washed for 5 min with PBS.
Western blotting
Total cell protein was extracted using RIPA buffer (Beyotime Biotechnology, China), after which 20-μg aliquots of protein were separated by 10% SDS-PAGE, transferred to PVDF membranes, and incubated overnight with primary antibodies against RFP (CST, US), GFP (CST, US), SMARCA5 (CST, US), TGF-β (CST, US), Smad2 (CST, US), Smad4 (CST, US), Snail (CST, US) and GAPDH (CST, US). The membranes were then incubated with secondary antibody for 1 h. Enhanced chemiluminescence was used for visualization and quantitative analysis.
Immunocytochemical staining
Cells cultured on chamber slides were fixed for 20 min in methanol, permeabilized with 0.25% Triton X-100 (Beyotime, China), and incubated for 1 h in blocking solution. Primary antibodies against Nestin (CST, US), CD105 (CST, US), CD90 (CST, US) and SMARCA5 (CST, US) were applied for 1 h, after which secondary antibody (Beyotime, China) antibodies were applied for 30 min. Finally, the slides were developed with diaminobenzidine (DAB) and counterstained with hematoxylin.
Chromosome karyotype analysis
After growing cells to 80% confluency, 100 μl colchicine (10 μg/ml) in 5 ml of medium were added to the culture dishes and incubated for 4-6 h. The cells were then digested and centrifuged, after which 75 mmol/L KCl was added, and the cells were incubated for 20 min before addition of 1 ml of fixation fluid (methanol:glacial acetic acid, 3:1) was added. After incubation for an additional 30 min, the cells were centrifuged, the supernatant was discarded, and 1 ml of the fixation solution was added again. The suspension was then transferred to slides, air dried, and stained with Giemsa. Chromosome karyotype was observed under microscope.
CCK8 assays
Cells were seeded into 96-well plates at a density of 3,000 cells/well in 100 μl of DMEM. Every 24 h, 10 μl of CCK8 reagent (Dojindo, Japan) were added into each well and incubated for another 2 h at 37°C. A spectrophotometer (Tecan, Switzerland) was then used to measure the absorbance at 450 nm.
Colony formation assays
Cells were seeded onto 6-well plates at a density of 500 cells per well. Fresh medium was replaced every 3 days. On the 10th day, the medium was removed, and each well was washed twice with PBS. Thereafter, the cells were stained using 1 ml of 0.1% crystal violet, which was added to each well for 20 min. The cells were then washed three times for 3 min each with PBS, after which the plates were dried at room temperature and the colonies were counted.
5-Ethynyl-20-deoxyuridine (EdU) assay
Cells were seeded into 24-well plates at a density of 5×10⁴ cells/well and incubated overnight, after which 300 μl of EdU (50 μM) (RiboBio, China) were added to each well, and the cells were incubated for additional 2 h. The cells were then fixed in 4% polyformaldehyde for 20 min, permeabilized with 0.5% TritonX-100 (Beyotime, China) for 20 min, and stained in 300 μl of Apollo dye solution (RiboBio, China) for 25 min. Cell nuclei were stained with Hoechst (RiboBio, China) for 10-30 min. The proportion of EdU-positive cells were determined using a fluorescence microscope.
Cell cycle analysis
Cells were digested, washed in PBS, and fixed in 70% cold ethanol overnight. The fixed cells were resuspended with 50 μg/ml propidium iodide (PI) (Multiscience, China) for 30 min at room temperature, after which cell cycle was analyzed using a flow cytometer (Beckman, US) with Cytexpert 2.0 software.
Invasion assays
Transwell chambers (Corning, US) were coated with Matrigel, after which SU4 RFPs or F-GSC/MSCs in 120 μl of serum-free medium were seeded into the upper chambers at 5x10⁴ cells/chamber, and 600 μl of complete medium containing 10% FBS were added to the lower chamber. After incubation for 24 h at 37°C, the unmigrated cells on the upper surface were wiped away with cotton swabs. Cells on the lower surface were fixed for 30 min with methanol and stained with 0.1% crystal violet.
Wound healing assay
Cells were seeded onto 6-well plates and cultured overnight at 37°C, after which wounds were made in cell monolayers using a 200-μl pipette tip. The cells were then washed with PBS and incubated in serum-free DMEM. Images of the wound area were analyzed using Image J software after 24 h (NIH, Bethesda, USA).
Quantitative real-time reverse transcription PCR (qRT-PCR)
Total RNA was extracted from cells with TRIzol (Invitrogen, US) and reverse transcribed to cDNA using a reverse transcription kit (GenePharma, China). Levels of miRNA expression were determined using the 2−ΔΔCt method. Expression of U6 served as a control.
Luciferase reporter assay
F-GSC/MSCs were cultured in 24-well plates and co-transfected with miR 146b 5p or scramble control plus the SMARCA5 3’-UTR, its mutated 3’-UTR, or empty vector. After 48 h, luciferase assays were then performed using a Dual-Luciferase Reporter Assay System (Promega, USA).
Immunofluorescence
Glioma tissue sections (5-μm) were fixed with 4% formaldehyde for 15 min at room temperature and blocked with blocking buffer for 60 min. The samples were then incubated first with primary anti-SMARCA5 antibody (dilution 1:100, CST, US) overnight at 4°C, then with fluorochrome-conjugated secondary antibody for 1–2h at room temperature in the dark and stained with DAPI.
Tumorigenicity assay
Four-week-old athymic Balb/c nude mice (15-20 g) were bred in the animal center at Soochow University under specific pathogen-free conditions. F-GSC/MSCs (1×10⁶) overexpressing miR-146b-5p, miR-146b-5p + SMARCA5, or a negative control were subcutaneously injected into the right flank of each mouse. After 5 weeks, all mice were sacrificed under general anesthesia, and the tumors were excised and weighed.
Statistical analysis
All data were expressed as the mean±SD. Groups were compared using t-tests, q tests, or one-way-ANOVA, as appropriate. All statistical analyses were performed using Prism 7.0 (GraphPad Software, US). Values of P<0.05 were considered statistically significant.
The authors declare they have no conflicts of interest.
This study was supported by grants from National Natural Science Foundation of China (NO. 81472739), National Natural Science Foundation of China (No. 81702457), Research and Practice Innovation Program for Postgraduates in Jiangsu (No. KYCX19_1982), and Clinical Special Disease Diagnosis and Treatment Technology in Suzhou, China (No. LCZX201807).