Higher expression of cell division cycle-associated protein 5 predicts poorer survival outcomes in hepatocellular carcinoma
Abstract
The upregulation of cell division cycle associated protein 5 (CDCA5) has been observed in various cancer types. However, the prognostic value of CDCA5 and its underlying mechanism contributing to tumorigenesis in hepatocellular carcinoma (HCC) remain poorly understood. We used tissue microarray (TMA) to evaluate the prognosis of 304 HCC samples based on their CDCA5 expression, and analyzed the genomic features correlated with CDCA5 by using dataset from The Cancer Genome Atlas (TCGA). Compared with adjacent normal tissues, increased expression of CDCA5 was found in HCC tissues. Moreover, higher expression of CDCA5 was associated with inferior OS and DFS outcomes in HCC patients. The enrichment plots showed that the gene signatures in cell cycle, DNA replication and p53 pathways were enriched in patients with higher CDCA5 expression. Meanwhile, statistically higher mutations burdens in TP53 could also be observed in CDCA5-high patients. Integrative analysis based on miRNAseq and methylation data demonstrated a potential association between CDCA5 expression and epigenetic changes. In conclusion, our study provided the evidence of CDCA5 as an oncogenic promoter in HCC and the potential function of CDCA5 in affecting tumor microenvironment.
Introduction
Hepatocellular carcinoma (HCC), the most common form of liver cancer, has been ranked among the most common cancers globally [1]. It has been widely known that several risk factors contribute to HCC carcinogenesis, including chronic hepatitis B virus (HBV)/hepatitis C virus (HCV) infection, alcohol abuse, autoimmune hepatitis, diabetes mellitus, obesity, and several metabolic diseases [2]. Despite great advances in the diagnosis and treatment of HCC has been achieved, the prognosis of HCC patients still remains poor over the past decades [3]. Therefore, the main goal of current oncological studies on HCC is understanding the pathophysiological mechanism contributing to the progression of HCC.
Cell division cycle associated protein 5 (CDCA5), which was also known as sororin coded by CDCA5 gene, was initially identified as a substrate of anaphase-promoting complex regulating sister chromatid cohesion [4, 5]. Previous study shows that phosphorylation of CDCA5 at Ser209 by extracellular signal-regulated kinase (ERK) can inhibit the proliferation of lung cancer cells, which is inversed after the induction of exogenous expression of CDCA5 [6]. It has been proved that CDCA5 was significantly up-regulated in various human tumor tissues, including lung cancer, oral squamous cell carcinoma, urothelial cancer and gastric cancer [6–10]. These findings indicate the potency of CDCA5 as a significant oncogenic promoter for cancers. However, the underlying mechanism in which CDCA5 regulate HCC tumorigenesis are still poorly understood.
In our work, we used tissue microarrays (TMA) to evaluate the histopathological features of CDCA5 in HCC tumor samples and analyze the survival outcomes of 304 HCC tumor samples based on CDCA5 expression. Moreover, distinctive genomic features correlated with the expression of CDCA5 were also analyzed by using dataset from The Cancer Genome Atlas (TCGA). The aim of this study is to provide with comprehensive analysis on CDCA5 as a potential target of treatment for HCC, which would address the research gaps in previous studies.
Results
In order to evaluate the clinical significance of CDCA5 in HCC, we detected the expression of CDCA5 by using TMA, in which HCC samples (n=304) and matched adjacent normal tissues (n=50) were enrolled. It showed that HCC samples exhibited higher CDCA5 expression than adjacent normal tissues (Figure 1A), which was proved by unpaired and paired t-test (Figure 1B). Meanwhile, further validation by GEO datasets also demonstrated the higher CDCA5 expression in tumor tissues (Supplementary Figure 1). By stratifying patients into subgroups based on the best cut-off point set by X-tile software [11], we found that higher CDCA5 expression correlated with both poorer OS and DFS outcomes (Figure 1C). Moreover, a multivariate Cox regression analysis demonstrated the significance of CDCA5 as an independent risk factor for OS and DFS (Figure 1D).
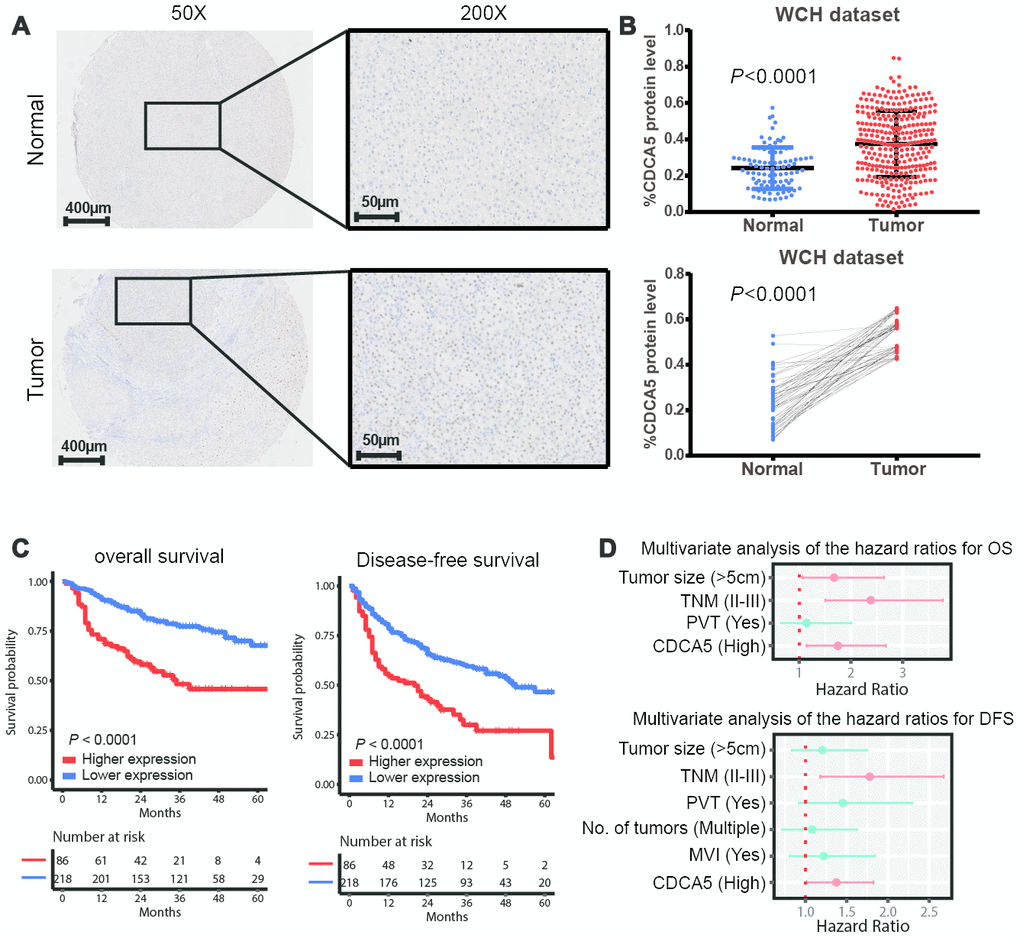
Figure 1. CDCA5 is upregulated in HCC tissues and predicts poorer survival outcomes. (A) Representative IHC staining of CDCA5 in HCC and paired normal tissues. (B) The relative protein level of CDCA5 is significantly higher in HCC tissues than in adjacent normal tissue (upper panel). Data represent the mean±SD. ***, p< 0.001. This finding was further validated by comparing CDCA5 expression in tumor and patient-matched adjacent normal tissues (lower panel). (C) Higher expression of CDCA5 predicts poorer survival outcomes in patients with HCC. (D) Multivariable Cox regression analysis shows that CDCA5 is an independent risk factor for both OS (upper panel) and DFS (lower panel). Independent prognostic factors, including CDCA5 expression and other clinical parameters, were assessed using the multivariate Cox proportional hazards model among the variables found to be significant using univariate analysis. The HRs are presented as the means with 95% confidence interval. Differences with p< 0.05 (Red) were considered significant.
To clarify the potential mechanism of CDCA5 in promoting HCC formation, we used RNAseq to analyze the gene expression in both CDCA5-high and -low groups. To sum up, 1652 genes were up-regulated (≥1.5-fold) and 1885 genes were down-regulated (≥1.5-fold) in CDCA5-high group (CDCA5-low group as reference, Figure 2A). Then, we performed GSEA analysis to find potential pathways in which CDCA5 was involved to affect HCC carcinogenesis. The enrichment plots of KEGG pathways showed that the genes involved in cell cycle, DNA replication and p53 pathway were significantly enriched in patients with higher CDCA5 expression (Figure 2B, 2C). A distinct expression distribution of genes in these 3 pathways showed that CDCA5-high tumors were statistically enriched for these genes (Supplementary Figure 2). These results highly indicate the underlying mechanism in which CDCA5 functions as a down-stream target of p53 pathway and promote HCC carcinogenesis by activating tumor cell proliferation.
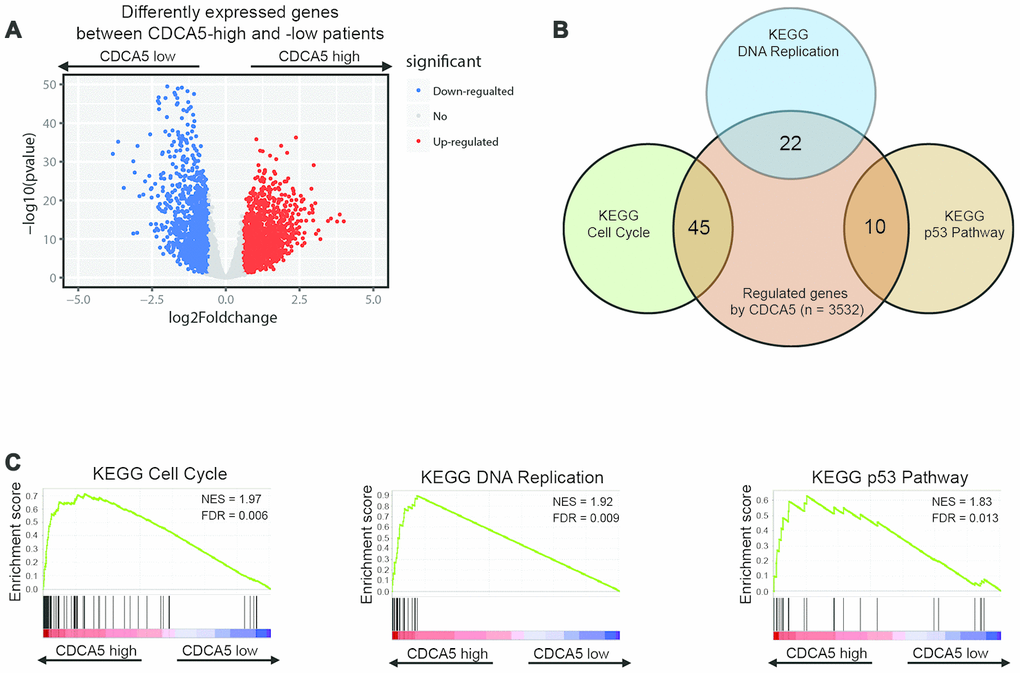
Figure 2. Identifying differentially expressed genes between CDCA5-high and -low patients. (A) Volcano plot of differential gene profiles between CDCA5-high and -low groups. (B) KEGG pathway analysis by GSEA shows that genes involved in cell proliferation, DNA replication and p53 pathway are enriched in CDCA5-high patients. Venn plot demonstrates the overlapping between differentially expressed genes and genes participating in different biological processes. Each circle in the Venn plot represents one set and the number in the overlaid area represents the common genes between the sets. (C) GSEA enrichment plots demonstrated gene enrichment results from Figure 3B.
The mutation landscape of driver genes in HCC has been provided by genetic profiling studies based on WGS data from TCGA dataset [12]. To find significant mutation events correlated with CDCA5 expression, we analyzed the mutation profiles characterized for HCC with different CDCA5 expression (high vs. low). It was noticeable that over half of the samples in CDCA5-high group had mutation events in TP53 (Figure 3A), the most renowned tumor suppressor gene proved to suppress tumor development by multiple pathways [13]. Moreover, tumors with higher CDCA5 expression showed statistically higher mutation burdens in TP53 (Table 1). At the same time, higher mutation burdens in tumor suppressor gene RB1 [14] were also observed in CDCA5-high tumors (Figure 3A, Table 1). Intriguingly, higher mutation burdens in CTNNB1 were observed in patients with lower CDCA5 expression (Figure 3A, Table 1). Owing to the fact that the alteration in CTNNB1 can result in the inhibited degradation of the encoded protein (β-catenin) and constitutive activation of β-catenin in HCC [15–17], this finding suggested that there was no association between the activation of Wnt signaling pathway and CDCA5 up-regulation.
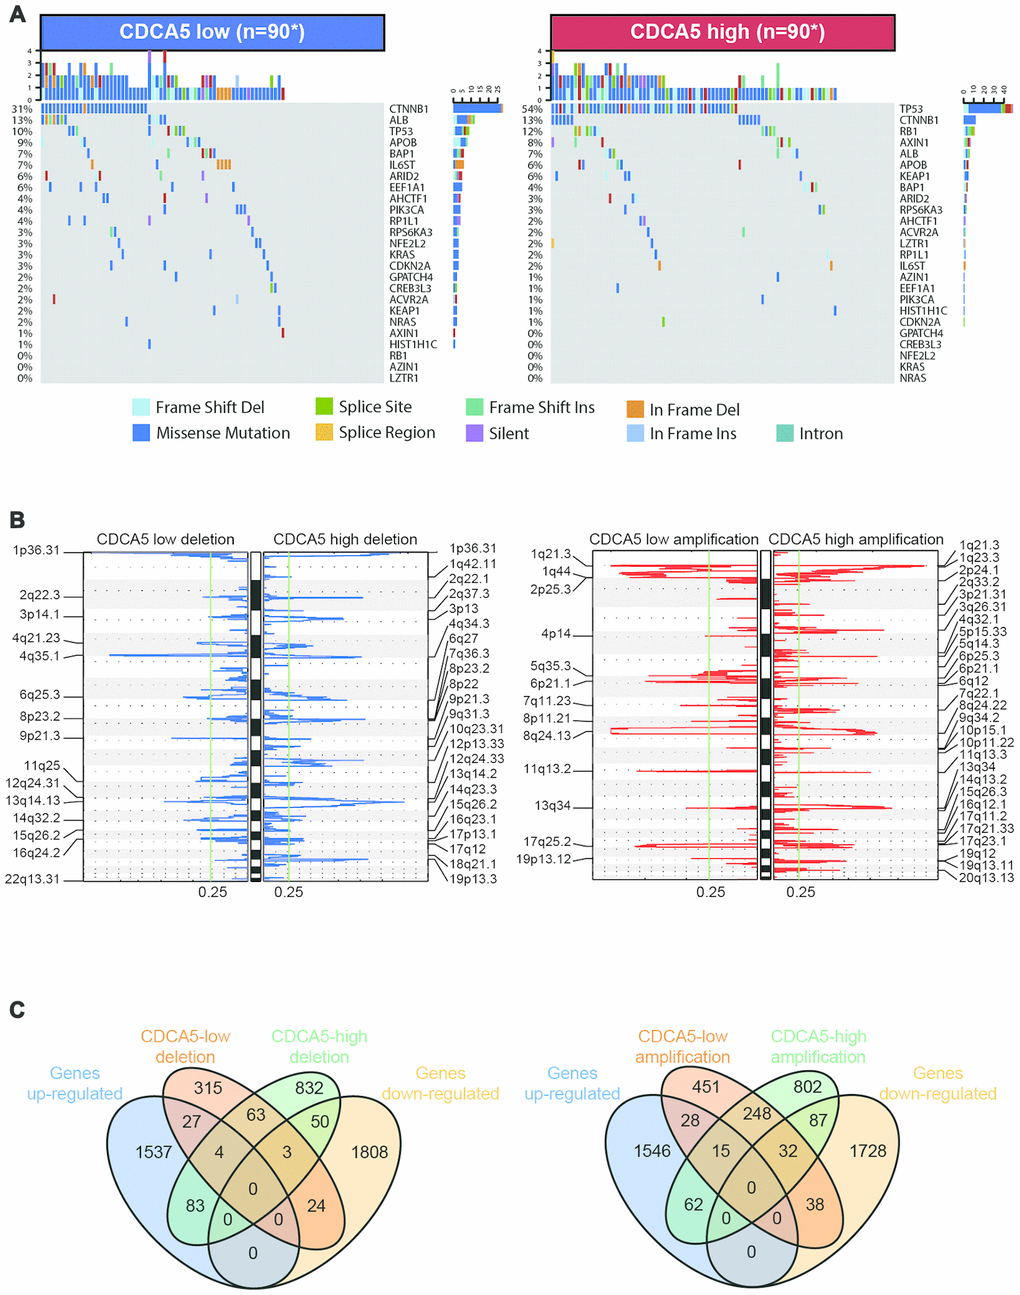
Figure 3. Association between CDCA5 and mutational signatures, copy number variation in HCC. (A) Significantly mutated genes in HCC subsets stratified by CDCA5 expression. (B) GISTIC2.0 analysis identified recurrent somatic copy number alterations in different HCC subsets stratified by CDCA5 expression. (C) Venn diagrams demonstrating the number of genes within genomic regions showing significant amplification or deletion, as well as the overlay with significant genes identified from RNAseq in CDCA5-high and -low patients. Each circle in the Venn diagram represents one set and the number in the overlaid area represents the common genes between the sets.
Table 1. The mutation frequency in CDCA5-low and -high patients.
| Gene | CDCA5 low (n=90) | CDCA5 high (n=90) | P* value |
| TP53 | 9 | 49 | <0.0001 |
| RB1 | 0 | 11 | 0.00186 |
| AHCTF1 | 4 | 2 | 0.678 |
| GPATCH4 | 2 | 0 | 0.477 |
| CTNNB1 | 28 | 12 | 0.004124 |
| AXIN1 | 1 | 7 | 0.07054 |
| AZIN1 | 0 | 1 | 1 |
| CREB3L3 | 2 | 0 | 0.477 |
| ARID2 | 5 | 3 | 0.7176 |
| ACVR2A | 2 | 2 | 1 |
| EEF1A1 | 5 | 1 | 0.2129 |
| PIK3CA | 4 | 1 | 0.3643 |
| RPS6KA3 | 3 | 3 | 1 |
| LZTR1 | 0 | 2 | 0.477 |
| ALB | 12 | 6 | 0.136 |
| APOB | 8 | 5 | 0.3877 |
| HIST1H1C | 1 | 1 | 1 |
| NFE2L2 | 3 | 0 | 0.2442 |
| KEAP1 | 2 | 5 | 0.4407 |
| KRAS | 3 | 0 | 0.2442 |
| BAP1 | 6 | 4 | 0.7449 |
| NRAS | 2 | 0 | 0.477 |
| CDKN2A | 3 | 1 | 0.6131 |
| RP1L1 | 4 | 2 | 0.678 |
| IL6ST | 6 | 2 | 0.2779 |
| ARID1A | 4 | 10 | 0.1641 |
| *, Pearson χ² test P value |
HCC is characterized by increased genomic instability with extensive copy number alterations [18, 19]. To identify the correlation between CDCA5 expression and CNV, we used GISTIC 2.0 to analyze the copy number amplifications and deletions in various chromosome regions. It showed that a large sum of loci were either significantly amplified or deleted regardless of the expression of CDCA5 (Figure 3B). 1035 genes exhibited copy number deletion in CDCA5-high patients, while the number for CDCA5-low patients was 436 (Figure 3C, left panel). After overlaid with the significantly differentially expressed genes identified by RNAseq, 133 genes within the deletion regions in CDCA5-high patients showed the concordant expression pattern in RNAseq, implying that the differential expression of these genes might be partially owing to copy number deletions. Meanwhile, the number of genes within the aberrantly amplified regions in CDCA5-high patients was 1245 (Figure 3C, right panel), among which 149 genes were also identified as statistically dysregulated according to RNAseq, suggesting that differential expression of these genes may be partially due to the copy number amplifications. In spite of the fact that there were genes exhibiting concordance between RNAseq and CNV results, the majority of the aberrantly expressed genes identified from RNAseq in CDCA5-high patients were not affected by CNV, indicating the independence of differential gene expressions from CNV in patients with higher CDCA5 expression.
MicroRNAs (abbreviated miRNAs) area class of short non-coding RNAs (about 22 nt) which can target mRNAs for cleavage and post-transcriptionally control gene expression [20]. It has been reported that aberrant regulation of miRNA plays a key role in HCC carcinogenesis [21]. In this study, we evaluated the genes potentially regulated by miRNA after the upregulation of CDCA5. A total of 44 up-regulated miRNAs (≥1.5-fold) and 113 down-regulated miRNAs (≥1.5-fold) were detected in CDCA5 group (CDCA5-low group as reference, Figure 4A). By using TargetScan, we identified a total of 97 pairs of miRNA-mRNA interaction, among which 65 pairs had significantly down-regulated genes in CDCA5-high patients (Figure 4B). Notably, hsa-mir-200b negatively regulated the expression of 29 genes. Moreover, 19 genes exhibited negative regulation from more than one miRNA. The interaction network showed that a set of oncogenes, including DNMT3A, TGFB2, CXCL12 and BCL9 [22–25], were potentially regulated by miRNA expressions.
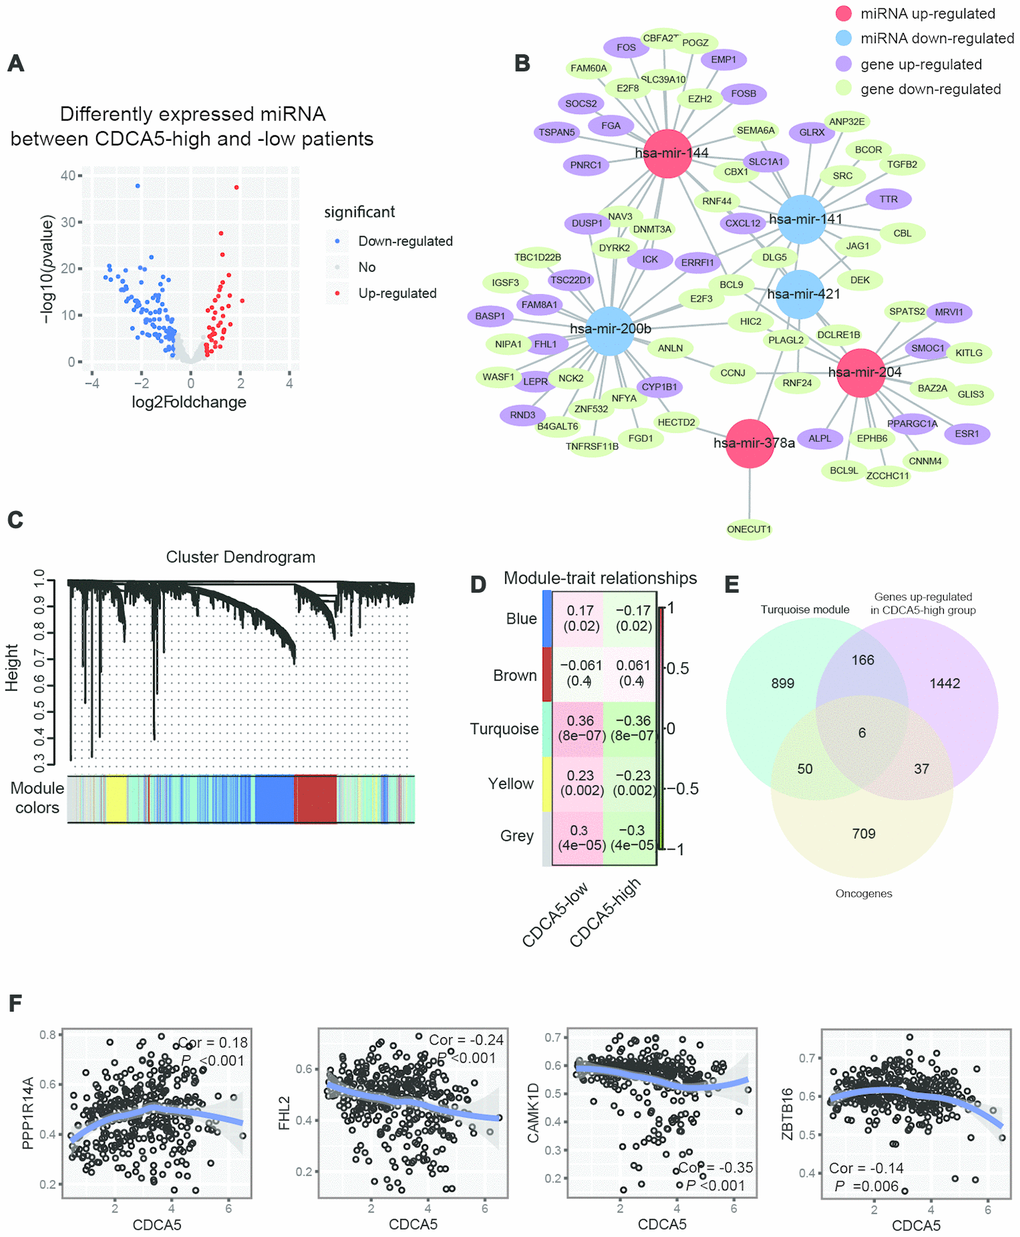
Figure 4. Integration of epigenetic change and gene expression between CDCA5-high and -low patients. (A) Volcano plot of differentially expressed miRNAs between CDCA5-high and -low groups. (B) Regulation of gene expression by miRNA plot as network in cytoscape. (C) Dendrogram indicating expression of different gene modules in patients involved in WGCNA analysis. (D) Correlation between module eigengenes and the expression level of the CDCA5 (low vs. high). (E) Venn diagrams demonstrating the number of genes within module turquoise, as well as the overlay with up-regulated genes identified from RNAseq and oncogenes. (F) Local regression curves (Spearman rank correlation) between expression of CDCA5 and 4 oncogenes identified in module turquoise.
DNA methylation is thought to be an important epigenetic modification regulating gene expression. Previous studies have demonstrated that methylated CpG island of gene promoters will suppress gene expression [26]. It has been reported that dysregulation of DNA methylation significantly correlated with HCC progression [27–29]. To evaluate DNA methylation patterns between CDCA5-low and -high patients, we used WGCNA to cluster methylated genes into different co-methylation modules. The network and the identified modules were illustrated in Figure 4C. Each module was assigned with a unique color identifier, with the remaining poorly connected genes colored gray. Notably, the most significant correlation was observed between CDCA5-high status module turquoise (absolute Pearson correlation coefficient = 0.36 and Bonferroni threshold of P= 8e-07,Figure 4D). We overlaid oncogenes within these this module with up-regulated genes identified in CDCA5-high patients, so as to find potentially demethylated genes after the up-regulation of CDCA5. The results showed that methylation status of 6 oncogenes were potentially affected by CDCA5 up-regulation (Figure 4E), including TBX3, PPP1R14A, FHL2, CAMK1D, ZBTB16 and AKTIP [30]. Among these 6 genes, the beta values of FHL2, CAMK1D and ZBTB16 showed significant negative correlation with CDCA5 expression, while the beta value of PPP1R14A showed positive correlation with CDCA5 expression (Figure 4F).
Discussion
Acting as a regulator of sister chromatid cohesion in cell-cycle, CDCA5 exhibit the pro-tumor ability by regulating proliferation process of tumor cells. Consistent with previous studies on various tumor types, higher expression of CDCA5 was found in HCC tumor cells than in adjacent normal tissues. Moreover, higher CDCA5 expression correlated with poorer survival outcomes in HCC patients. By analyzing the differentially expressed genes between CDCA5-low and -high HCC tumor samples, we found that genes involved in cell cycle were significantly enriched in CDCA5-high tumors. This finding indicates that CDCA5 participates in regulating HCC cell proliferation.
The transcription factor p53 plays an essential role in regulating cell cycle and is the most important tumor suppressor widely known [31]. When exposed to cellular stress signaling including DNA damage and oncogenic pressure, p53 can be activated by phosphorylation of its protein and posttranslational modifications, which result in the up-regulation of p53 target genes involved in DNA repair, apoptosis and cell-cycle arrest. Inactivation of p53 through either mutation or alterations in related pathways has been regarded as a hallmark of every tumor types [32]. According to our GSEA analysis, several p53 downstream genes were significantly up-regulated in CDCA5-high group, including genes involved in cell-cycle (CDK4, CDKN2A, CDK2, CCNB2, CDK1 and CCNB1), apoptosis (BAX) and DNA synthesis (RRM2). Considering that CDCA5-high patients had statistically higher mutation burdens in TP53 (Figure 4A, Table 1), this result indicated a potential loss of function correlated with TP53 mutation contributing to the dysregulation of genes involved in p53 pathway, thus promoting the expression of CDCA5 and HCC tumorigenesis.
As the first identified tumor suppressor gene, the retinoblastoma gene RB1 has been proved to regulate the various biologic processes, including cell cycle progression, terminal differentiation and DNA replication [33]. RB1 mutation can cause the inactivation of the gene product pRB by exempting normal cells to exit cell cycle, which leads to high susceptibility of normal cells to oncogenic proliferation. This can be observed in almost all familial and sporadic forms of retinoblastoma and other human cancers at variable frequencies [14]. In our work, we also showed that the proportion of patients with RB1 mutations in CDCA5-high group was statistically higher than that in CDCA5-low group, suggesting that inactivation of pRB can lead to abnormally up-regulation of CDCA5 during carcinogenesis, which contribute to HCC tumor cell proliferation.
At this moment, it is evident that miRNA is a key regulator in carcinogenesis. During the process of tumor formation, mature miRNA is generated from two-step cleavage of primary miRNA (pri-miRNA), which incorporates into a large protein complex called RNA-induced silencing complex (RISC) (48-50). By identifying significant miRNAs potentially regulated by CDCA5 expression, we found that hsa-mir-144, a tumor suppressor miRNA in various cancer types including HCC [34–36], was significantly up-regulated in CDCA5-high patients. Meanwhile, another tumor suppressor miRNA, hsa-mir-200b, [37–39] was down-regulated in CDCA5-high patients. Moreover, multiple synchronizations existed between the expressions of miRNAs and their target genes. These findings indicated the existence of a highly complicated regulatory network by miRNA expressions along with the upregulation of CDCA5.
While the direct impact of DNA methylation on tumor suppressor genes has been well established for decades [40], a prevailing alternative hypothesis has aroused great interest in hypomethylation as a significant epigenetic alteration resulting in the transcriptional activation of oncogenes [41]. Although there are genes identified to be activated due to promoter hypomethylation in cancers, their oncogenic roles still remain poorly understood [42]. Since the methylation beta value of 3 oncogenes up-regulated in CDCA5-high patients, including FHL2, CAMK1D and ZBTB16, showed significantly negative associations with CDCA5 expression, our study indicated the transcriptional activation of these genes by DNA demethylation, which was potentially induced by CDCA5 up-regulation. Meanwhile, the positive correlation between the beta value of oncogene PPP1R14A and CDCA5 expression also suggested the competition between these 2 genes in gene expression. Further research will be inspired to detect the function of CDCA5 as a DNA methylation regulator.
In conclusion, our study provided the evidence of CDCA5 as an oncogenic promoter in HCC and its potential function in affecting tumor microenvironment. The results in this work revealed the underlying mechanism in which CDCA5 up-regulation contributed to the poorer survival outcomes in HCC patients. Moreover, our study highlighted the potential value of CDCA5 targeted therapy in future clinical practice.
Materials and Methods
Patients and samples
A total of 304 HCC patients undergoing hepatectomy between 2007 and 2012 in West China Hospital were included in this study. Tissue microarrays were constructed as previously described [43]. Tumor staging classification was carried out according to the 7th AJCC TNM Staging for Liver and Intrahepatic Bile Duct Malignancies. The characteristics of tumor samples, including differentiation, size, number of nodules, vascular invasion and Ishak fibrosis score of the adjacent liver tissue were evaluated by two pathologists specializing in hepatic diseases. The primary end point of this study was overall survival (OS), which was defined as the time from the date of surgery to the date of death without regard to the cause of death. The secondary end point was disease-free survival (DFS) defined as the time from the date of surgery to the time of the first event (recurrence, progression, death).
This study, including any relevant details, was approved by the ethics committee of West China Hospital. All the patients included in this study were over 18 years old and informed consent was obtained from study participants according to the regulations of the committee. Patients' names and other HIPAA identifiers have been excluded from this study. We confirm that all experiments were performed in accordance with relevant guidelines and regulations.
Evaluation of CDCA5 staining
The tissue core punched from a representative tissue area of the formalin-fixed, paraffin-embedded (FFPE) slide of each HCC sample was selected to construct the TMAs. H&E staining on TMAs were performed as previously described [44]. Immunohistochemical (IHC) staining was performed as previously described [43] by using a specific anti-CDCA5 antibody (1/500, Abcam). Images of CDCA5 staining were viewed and captured using the NDP.view.2 software program. Slides were reviewed by two experienced pathologists who were blind to the clinical parameters. We evaluated the positive staining of CDCA5 in tumor cell nuclei from 5 respective areas in each TMA dot at 20× magnification and recorded the percentage of positively stained cells in each area. The mean value from the 5 areas was used for further analyses.
RNAseq gene expression analysis
Raw counts of gene expression from RNAseq were downloaded from the TCGA data portal (https://portal.gdc.cancer.gov/) for the differential gene expression analysis. Total raw read counts per gene were divided by the gene’s maximum transcript length to represent a coverage depth estimate, which were then scaled to a total depth of 106 per sample and can be interpreted as transcripts per million (TPM) [45]. Statistical ranking for CDCA5 expression by the top and bottom quartiles were defined as CDCA5-high and CDCA5-low, respectively. Differential gene expression analysis between CDCA5-high and CDCA5-lowpatients across TCGA datasets was calculated using the R package edgeR, which determines the differential gene expression by accounting for variability through an over-dispersed Poisson model and moderating the degree of over-dispersion by Empirical Bayes methods [46]. Genes with counts per million (CPM) larger than 1 across at least 91 samples (half of all samples) were included for differential gene expression analysis. Genes with the adjusted p value less than 0.05 and the absolute FC larger than 1.5 were considered to be statistically significant. KEGG pathway analysis on the aberrantly expressed genes between CDCA5-high and CDCA5-lowpatients was performed based on gene set enrichment analysis (GSEA) as previously described [47]. Terms with a false discovery rate (FDR) < 0.05 were considered statistically significant. Normalized gene expression data and the corresponding clinical data were also obtained from TCGA data portal.
Mutation and copy number variation analysis
Significantly mutated genes (SMGs) were defined by running the Mutational Significance in Cancer (MuSiC Genome Suite) in different subtypes of HCC (CDCA5-high vs. CDCA5-low). MuSiC identifies genes with significantly higher mutation rates than the background mutation rate (BMR) to find SMGs across the entire sample population. The threshold for significance was a FDR of 0.1. Mutational spectra across the entire study population from the TCGA dataset were determined as previously described [12]. Copy number variation (CNV) data was downloaded from GDAC Firehose and separated into different datasets according to the expressions of CDCA5. Investigation into significant amplification or deletion events in the regions of the genome was conducted through the use of GISTIC 2.0, a revised computational program to identify somatic copy number alteration by investigating the frequency and amplitude of observed events [48]. Meanwhile, genes within the significant genomic regions were further analyzed to determine the overlay with those differentially expressed and identified from RNAseq.
Integration of gene expression and epigenetic change
To investigate the potential genes regulation by miRNA, we focused on aberrantly expressed miRNA (adjusted p value < 0.05, absolute FC > 1.5) and the significant differential gene selected from RNAseq between CDCA5-high and CDCA5-low patients. Since miRNAseq only provided the expression level of the stem loop, the stem loop’s expression level was considered as the mature miRNA. The correlation between miRNA and the regulated genes was analyzed by TargetScan [49–53].
Preprocessed methylation data (mean beta values, level 3) were downloaded from Broad Firehose (http://gdac.broadinstitute.org/). Weighted Gene Co-Expression Network Analysis (WGCNA) [54] was conducted to identify groups of methylated genes (modules) involved in patients with different CDCA5 status (high vs. low) as previously described [55]. Genes in the modules showing statistically positive correlation with CDCA5-high status were further analyzed to determine the overlay with those down-regulated in CDCA5-high group and oncogenes identified by ONGene [30].
Gene expression omnibus (GEO) data
Microarray gene expression data of HCC samples were downloaded from the GEO database (accession numbers GSE1898, GSE54236, GSE64041) [56–59]. The R package “GEOquery” was used to extract the expression values of genes.
Statistical analysis
Statistical analyses and graphics were undertaken using R version 3.5.1. Student's t-test and Pearson χ² test were used for the univariate analyses where appropriate. Survival rates of expression level (high vs. low) were estimated by the Kaplan-Meier method with Rothman CIs. Survival curves were compared with the log-rank test. The hazard ratio (HR) and 95% CI associated with the expressions of CDCA5 were estimated through a multivariable Cox regression model adjusted for TNM stage (I vs. II-III), portal vein thrombus (no vs. yes), number of tumors (single vs. multiple), tumor size (≤5cm vs. >5cm) and microvascular invasion (no vs. yes). A p value < 0.05 was considered statistically significant.
Author Contributions
Bole Tian and Haotian Liao designed the research. Shengzhong Hou and Haotian Liao performed the experiments and statistical analysis. Haotian Liao and Mao Li evaluated the data. Xing Huang and Mao Li constructed the figures and table. Haotian Liao and ShengZhong Hou wrote the manuscript. Xing Chen revised the manuscript. All authors contributed to drafting and revising the article, gave final approval of the version to be published, and agree to be accountable for all aspects of this work.
Acknowledgments
We thank the TCGA working group for generating publicly available data. We are most grateful for Core Facility of West China Hospital for their technique support.
Conflicts of Interest
The authors have declared that no conflicts of interest exists.
Funding
This work was supported by grants from the Natural Science Foundation of China (81872004, 81800564, 81770615, 81700555, 81672882 and 81502441), the Science and Technology Support Program of Sichuan Province (2017SZ0003, 2018SZ0115) and the Science and Technology Program of Tibet Autonomous Region (XZ201801-GB-02).
References
-
1.
Chen W, Zheng R, Baade PD, Zhang S, Zeng H, Bray F, Jemal A, Yu XQ, He J. Cancer statistics in China, 2015. CA Cancer J Clin. 2016; 66:115–32. https://doi.org/10.3322/caac.21338 [PubMed]
-
2.
Yang JD, Kim WR, Coelho R, Mettler TA, Benson JT, Sanderson SO, Therneau TM, Kim B, Roberts LR. Cirrhosis is present in most patients with hepatitis B and hepatocellular carcinoma. Clin Gastroenterol Hepatol. 2011; 9:64–70. https://doi.org/10.1016/j.cgh.2010.08.019 [PubMed]
-
3.
European Association for the Study of the Liver. EASL clinical practice guidelines: management of hepatocellular carcinoma. J Hepatol. 2018; 69:182–236. https://doi.org/10.1016/j.jhep.2018.03.019 [PubMed]
-
4.
Rankin S, Ayad NG, Kirschner MW. Sororin, a substrate of the anaphase-promoting complex, is required for sister chromatid cohesion in vertebrates. Mol Cell. 2005; 18:185–200. https://doi.org/10.1016/j.molcel.2005.03.017 [PubMed]
-
5.
Schmitz J, Watrin E, Lénárt P, Mechtler K, Peters JM. Sororin is required for stable binding of cohesin to chromatin and for sister chromatid cohesion in interphase. Curr Biol. 2007; 17:630–36. https://doi.org/10.1016/j.cub.2007.02.029 [PubMed]
-
6.
Nguyen MH, Koinuma J, Ueda K, Ito T, Tsuchiya E, Nakamura Y, Daigo Y. Phosphorylation and activation of cell division cycle associated 5 by mitogen-activated protein kinase play a crucial role in human lung carcinogenesis. Cancer Res. 2010; 70:5337–47. https://doi.org/10.1158/0008-5472.CAN-09-4372 [PubMed]
-
7.
Chang IW, Lin VC, He HL, Hsu CT, Li CC, Wu WJ, Huang CN, Wu TF, Li CF. CDCA5 overexpression is an indicator of poor prognosis in patients with urothelial carcinomas of the upper urinary tract and urinary bladder. Am J Transl Res. 2015; 7:710–22. [PubMed]
-
8.
Showe MK, Kossenkov AV, Showe LC. The peripheral immune response and lung cancer prognosis. Oncoimmunology. 2012; 1:1414–16. https://doi.org/10.4161/onci.21096 [PubMed]
-
9.
Tokuzen N, Nakashiro K, Tanaka H, Iwamoto K, Hamakawa H. Therapeutic potential of targeting cell division cycle associated 5 for oral squamous cell carcinoma. Oncotarget. 2016; 7:2343–53. https://doi.org/10.18632/oncotarget.6148 [PubMed]
-
10.
Zhang Z, Shen M, Zhou G. Upregulation of CDCA5 promotes gastric cancer Malignant progression via influencing cyclin E1. Biochem Biophys Res Commun. 2018; 496:482–89. https://doi.org/10.1016/j.bbrc.2018.01.046 [PubMed]
-
11.
Camp RL, Dolled-Filhart M, Rimm DL. X-tile: a new bio-informatics tool for biomarker assessment and outcome-based cut-point optimization. Clin Cancer Res. 2004; 10:7252–59. https://doi.org/10.1158/1078-0432.CCR-04-0713 [PubMed]
-
12.
Cancer Genome Atlas Research Network. Comprehensive and integrative genomic characterization of hepatocellular carcinoma. Cell. 2017; 169:1327–41.e23. https://doi.org/10.1016/j.cell.2017.05.046 [PubMed]
-
13.
Bykov VJ, Eriksson SE, Bianchi J, Wiman KG. Targeting mutant p53 for efficient cancer therapy. Nat Rev Cancer. 2018; 18:89–102. https://doi.org/10.1038/nrc.2017.109 [PubMed]
-
14.
Dyson NJ. RB1: a prototype tumor suppressor and an enigma. Genes Dev. 2016; 30:1492–502. https://doi.org/10.1101/gad.282145.116 [PubMed]
-
15.
Monga SP. Β-catenin signaling and roles in liver homeostasis, injury, and tumorigenesis. Gastroenterology. 2015; 148:1294–310. https://doi.org/10.1053/j.gastro.2015.02.056 [PubMed]
-
16.
Morin PJ, Sparks AB, Korinek V, Barker N, Clevers H, Vogelstein B, Kinzler KW. Activation of beta-catenin-tcf signaling in colon cancer by mutations in beta-catenin or APC. Science. 1997; 275:1787–90. https://doi.org/10.1126/science.275.5307.1787 [PubMed]
-
17.
Rubinfeld B, Robbins P, El-Gamil M, Albert I, Porfiri E, Polakis P. Stabilization of beta-catenin by genetic defects in melanoma cell lines. Science. 1997; 275:1790–92. https://doi.org/10.1126/science.275.5307.1790 [PubMed]
-
18.
Guichard C, Amaddeo G, Imbeaud S, Ladeiro Y, Pelletier L, Maad IB, Calderaro J, Bioulac-Sage P, Letexier M, Degos F, Clément B, Balabaud C, Chevet E, et al. Integrated analysis of somatic mutations and focal copy-number changes identifies key genes and pathways in hepatocellular carcinoma. Nat Genet. 2012; 44:694–98. https://doi.org/10.1038/ng.2256 [PubMed]
-
19.
Kim TM, Yim SH, Shin SH, Xu HD, Jung YC, Park CK, Choi JY, Park WS, Kwon MS, Fiegler H, Carter NP, Rhyu MG, Chung YJ. Clinical implication of recurrent copy number alterations in hepatocellular carcinoma and putative oncogenes in recurrent gains on 1q. Int J Cancer. 2008; 123:2808–15. https://doi.org/10.1002/ijc.23901 [PubMed]
-
20.
Bartel DP. MicroRNAs: genomics, biogenesis, mechanism, and function. Cell. 2004; 116:281–97. https://doi.org/10.1016/s0092-8674(04)00045-5 [PubMed]
-
21.
Yang N, Ekanem NR, Sakyi CA, Ray SD. Hepatocellular carcinoma and microRNA: new perspectives on therapeutics and diagnostics. Adv Drug Deliv Rev. 2015; 81:62–74. https://doi.org/10.1016/j.addr.2014.10.029 [PubMed]
-
22.
Huber-Ruano I, Raventós C, Cuartas I, Sánchez-Jaro C, Arias A, Parra JL, Wosikowski K, Janicot M, Seoane J. An antisense oligonucleotide targeting TGF-β2 inhibits lung metastasis and induces CD86 expression in tumor-associated macrophages. Ann Oncol. 2017; 28:2278–85. https://doi.org/10.1093/annonc/mdx314 [PubMed]
-
23.
Saha A, Ahn S, Blando J, Su F, Kolonin MG, DiGiovanni J. Proinflammatory CXCL12-CXCR4/CXCR7 signaling axis drives myc-induced prostate cancer in obese mice. Cancer Res. 2017; 77:5158–68. https://doi.org/10.1158/0008-5472.CAN-17-0284 [PubMed]
-
24.
Spencer DH, Russler-Germain DA, Ketkar S, Helton NM, Lamprecht TL, Fulton RS, Fronick CC, O’Laughlin M, Heath SE, Shinawi M, Westervelt P, Payton JE, Wartman LD, et al. CpG island hypermethylation mediated by DNMT3A is a consequence of AML progression. Cell. 2017; 168:801–16.e13. https://doi.org/10.1016/j.cell.2017.01.021 [PubMed]
-
25.
Yang C, Xu Y, Cheng F, Hu Y, Yang S, Rao J, Wang X. miR-1301 inhibits hepatocellular carcinoma cell migration, invasion, and angiogenesis by decreasing Wnt/β-catenin signaling through targeting BCL9. Cell Death Dis. 2017; 8:e2999. https://doi.org/10.1038/cddis.2017.356 [PubMed]
-
26.
Dor Y, Cedar H. Principles of DNA methylation and their implications for biology and medicine. Lancet. 2018; 392:777–86. https://doi.org/10.1016/S0140-6736(18)31268-6 [PubMed]
-
27.
Yoshikawa H, Matsubara K, Qian GS, Jackson P, Groopman JD, Manning JE, Harris CC, Herman JG. SOCS-1, a negative regulator of the JAK/STAT pathway, is silenced by methylation in human hepatocellular carcinoma and shows growth-suppression activity. Nat Genet. 2001; 28:29–35. https://doi.org/10.1038/ng0501-29 [PubMed]
-
28.
Park IY, Sohn BH, Yu E, Suh DJ, Chung YH, Lee JH, Surzycki SJ, Lee YI. Aberrant epigenetic modifications in hepatocarcinogenesis induced by hepatitis B virus X protein. Gastroenterology. 2007; 132:1476–94. https://doi.org/10.1053/j.gastro.2007.01.034 [PubMed]
-
29.
Mudbhary R, Hoshida Y, Chernyavskaya Y, Jacob V, Villanueva A, Fiel MI, Chen X, Kojima K, Thung S, Bronson RT, Lachenmayer A, Revill K, Alsinet C, et al. UHRF1 overexpression drives DNA hypomethylation and hepatocellular carcinoma. Cancer Cell. 2014; 25:196–209. https://doi.org/10.1016/j.ccr.2014.01.003 [PubMed]
-
30.
Liu Y, Sun J, Zhao M. ONGene: a literature-based database for human oncogenes. J Genet Genomics. 2017; 44:119–21. https://doi.org/10.1016/j.jgg.2016.12.004 [PubMed]
-
31.
Lane D, Levine A. P53 research: the past thirty years and the next thirty years. Cold Spring Harb Perspect Biol. 2010; 2:a000893. https://doi.org/10.1101/cshperspect.a000893 [PubMed]
-
32.
Joerger AC, Fersht AR. The p53 pathway: origins, inactivation in cancer, and emerging therapeutic approaches. Annu Rev Biochem. 2016; 85:375–404. https://doi.org/10.1146/annurev-biochem-060815-014710 [PubMed]
-
33.
Du W, Pogoriler J. Retinoblastoma family genes. Oncogene. 2006; 25:5190–200. https://doi.org/10.1038/sj.onc.1209651 [PubMed]
-
34.
Sun J, Shi R, Zhao S, Li X, Lu S, Bu H, Ma X, Su C. E2F8, a direct target of miR-144, promotes papillary thyroid cancer progression via regulating cell cycle. J Exp Clin Cancer Res. 2017; 36:40. https://doi.org/10.1186/s13046-017-0504-6 [PubMed]
-
35.
Uchida A, Seki N, Mizuno K, Misono S, Yamada Y, Kikkawa N, Sanada H, Kumamoto T, Suetsugu T, Inoue H. Involvement of dual-strand of the miR-144 duplex and their targets in the pathogenesis of lung squamous cell carcinoma. Cancer Sci. 2019; 110:420–32. https://doi.org/10.1111/cas.13853 [PubMed]
-
36.
Yamada Y, Arai T, Kojima S, Sugawara S, Kato M, Okato A, Yamazaki K, Naya Y, Ichikawa T, Seki N. Regulation of antitumor miR-144-5p targets oncogenes: direct regulation of syndecan-3 and its clinical significance. Cancer Sci. 2018; 109:2919–36. https://doi.org/10.1111/cas.13722 [PubMed]
-
37.
Wang LK, Xie XN, Song XH, Su T, Chang XL, Xu M, Liang B, Huang DY. Upregulation of miR-200b inhibits hepatocellular carcinoma cell proliferation and migration by targeting HMGB3 protein. Technol Cancer Res Treat. 2018; 17:1533033818806475. https://doi.org/10.1177/1533033818806475 [PubMed]
-
38.
Wu H, Wang G, Wang Z, An S, Ye P, Luo S. A negative feedback loop between miR-200b and the nuclear factor-κB pathway via IKBKB/IKK-β in breast cancer cells. FEBS J. 2016; 283:2259–71. https://doi.org/10.1111/febs.13543 [PubMed]
-
39.
Wu J, Cui H, Zhu Z, Wang L. MicroRNA-200b-3p suppresses epithelial-mesenchymal transition and inhibits tumor growth of glioma through down-regulation of ERK5. Biochem Biophys Res Commun. 2016; 478:1158–64. https://doi.org/10.1016/j.bbrc.2016.08.085 [PubMed]
-
40.
Jones PA, Baylin SB. The fundamental role of epigenetic events in cancer. Nat Rev Genet. 2002; 3:415–28. https://doi.org/10.1038/nrg816 [PubMed]
-
41.
Szyf M, Pakneshan P, Rabbani SA. DNA demethylation and cancer: therapeutic implications. Cancer Lett. 2004; 211:133–43. https://doi.org/10.1016/j.canlet.2004.04.009 [PubMed]
-
42.
De Smet C, Loriot A. DNA hypomethylation and activation of germline-specific genes in cancer. Adv Exp Med Biol. 2013; 754:149–66. https://doi.org/10.1007/978-1-4419-9967-2_7 [PubMed]
-
43.
Liao H, Liao M, Xu L, Yan X, Ren B, Zhu Z, Yuan K, Zeng Y. Integrative analysis of h-prune as a potential therapeutic target for hepatocellular carcinoma. EBioMedicine. 2019; 41:310–19. https://doi.org/10.1016/j.ebiom.2019.01.001 [PubMed]
-
44.
Fischer AH, Jacobson KA, Rose J, Zeller R. Hematoxylin and eosin staining of tissue and cell sections. CSH Protoc. 2008; 2008:pdb.prot4986. https://doi.org/10.1101/pdb.prot4986 [PubMed]
-
45.
Rooney MS, Shukla SA, Wu CJ, Getz G, Hacohen N. Molecular and genetic properties of tumors associated with local immune cytolytic activity. Cell. 2015; 160:48–61. https://doi.org/10.1016/j.cell.2014.12.033 [PubMed]
-
46.
Robinson MD, McCarthy DJ, Smyth GK. edgeR: a bioconductor package for differential expression analysis of digital gene expression data. Bioinformatics. 2010; 26:139–40. https://doi.org/10.1093/bioinformatics/btp616 [PubMed]
-
47.
Liao HT, Huang JW, Lan T, Wang JJ, Zhu B, Yuan KF, Zeng Y. Identification of the aberrantly expressed LncRNAs in hepatocellular carcinoma: a bioinformatics analysis based on RNA-sequencing. Sci Rep. 2018; 8:5395. https://doi.org/10.1038/s41598-018-23647-1 [PubMed]
-
48.
Mermel CH, Schumacher SE, Hill B, Meyerson ML, Beroukhim R, Getz G. GISTIC2.0 facilitates sensitive and confident localization of the targets of focal somatic copy-number alteration in human cancers. Genome Biol. 2011; 12:R41. https://doi.org/10.1186/gb-2011-12-4-r41 [PubMed]
-
49.
Agarwal V, Bell GW, Nam JW, Bartel DP. Predicting effective microRNA target sites in mammalian mRNAs. Elife. 2015; 4:e05005. https://doi.org/10.7554/eLife.05005 [PubMed]
-
50.
Friedman RC, Farh KK, Burge CB, Bartel DP. Most mammalian mRNAs are conserved targets of microRNAs. Genome Res. 2009; 19:92–105. https://doi.org/10.1101/gr.082701.108 [PubMed]
-
51.
Garcia DM, Baek D, Shin C, Bell GW, Grimson A, Bartel DP. Weak seed-pairing stability and high target-site abundance decrease the proficiency of lsy-6 and other microRNAs. Nat Struct Mol Biol. 2011; 18:1139–46. https://doi.org/10.1038/nsmb.2115 [PubMed]
-
52.
Grimson A, Farh KK, Johnston WK, Garrett-Engele P, Lim LP, Bartel DP. MicroRNA targeting specificity in mammals: determinants beyond seed pairing. Mol Cell. 2007; 27:91–105. https://doi.org/10.1016/j.molcel.2007.06.017 [PubMed]
-
53.
Lewis BP, Burge CB, Bartel DP. Conserved seed pairing, often flanked by adenosines, indicates that thousands of human genes are microRNA targets. Cell. 2005; 120:15–20. https://doi.org/10.1016/j.cell.2004.12.035 [PubMed]
-
54.
Langfelder P, Horvath S. WGCNA: an R package for weighted correlation network analysis. BMC Bioinformatics. 2008; 9:559. https://doi.org/10.1186/1471-2105-9-559 [PubMed]
-
55.
Gargalovic PS, Imura M, Zhang B, Gharavi NM, Clark MJ, Pagnon J, Yang WP, He A, Truong A, Patel S, Nelson SF, Horvath S, Berliner JA, et al. Identification of inflammatory gene modules based on variations of human endothelial cell responses to oxidized lipids. Proc Natl Acad Sci USA. 2006; 103:12741–46. https://doi.org/10.1073/pnas.0605457103 [PubMed]
-
56.
Lee JS, Chu IS, Mikaelyan A, Calvisi DF, Heo J, Reddy JK, Thorgeirsson SS. Application of comparative functional genomics to identify best-fit mouse models to study human cancer. Nat Genet. 2004; 36:1306–11. https://doi.org/10.1038/ng1481 [PubMed]
-
57.
Lee JS, Heo J, Libbrecht L, Chu IS, Kaposi-Novak P, Calvisi DF, Mikaelyan A, Roberts LR, Demetris AJ, Sun Z, Nevens F, Roskams T, Thorgeirsson SS. A novel prognostic subtype of human hepatocellular carcinoma derived from hepatic progenitor cells. Nat Med. 2006; 12:410–16. https://doi.org/10.1038/nm1377 [PubMed]
-
58.
Makowska Z, Boldanova T, Adametz D, Quagliata L, Vogt JE, Dill MT, Matter MS, Roth V, Terracciano L, Heim MH. Gene expression analysis of biopsy samples reveals critical limitations of transcriptome-based molecular classifications of hepatocellular carcinoma. J Pathol Clin Res. 2016; 2:80–92. https://doi.org/10.1002/cjp2.37 [PubMed]
-
59.
Villa E, Critelli R, Lei B, Marzocchi G, Cammà C, Giannelli G, Pontisso P, Cabibbo G, Enea M, Colopi S, Caporali C, Pollicino T, Milosa F, et al. Neoangiogenesis-related genes are hallmarks of fast-growing hepatocellular carcinomas and worst survival. Results from a prospective study. Gut. 2016; 65:861–69. https://doi.org/10.1136/gutjnl-2014-308483 [PubMed]