


Introduction
Over the last decade, autogenous fat transplantation, reconstruction of soft tissue injury and cosmetic breast augmentation have received greater attention and found wider use [1–4]. However, the safety and effectiveness of autogenous fat transplantation remain the focus of debate. Failure of autogenous fat transplantation may lead to fat necrosis, microcalcification and inflammation of cyst formation [5–8]. Recent advances in regenerative medicine have put adipose stem cells (ASCs) in the spotlight for their paracrine activity [9], differentiation ability and potential application in tissue engineering. Many studies have shown that ASCs show excellent regenerative potential for fat transplantation in the clinic [10–12].
ASCs, easily obtained from adipose tissue, are a subset of mesenchymal stem cells (MSCs) showing similar regeneration characteristics as other MSCs [13–15]. ASCs easily adhere to plastic culture bottles and expand in vitro and show the potential to repair, maintain or enhance various tissues [16]. Many studies have demonstrated that ASCs are capable of differentiating into mesenchymal and non-mesenchymal cell types in vitro and in vivo, including adipocytes, chondrocytes, osteoblasts, neurons, myocytes, and endothelial cells [17–21]. Moreover, ASCs can promote tissue regeneration by secreting cytokines and growth factors, thus promoting the recovery of normal tissue function or reducing tissue damage [22]. These favorable characteristics of human adipose tissue offer a practical, alternative source of MSCs for use in regenerative medicine. However, ASCs harvested from different anatomical areas exhibit different characteristics [23, 24]. This suggests that there may be an optimal source of ASCs for autologous transplantation.
In this study, we isolated ASCs from human thigh (htASCs), abdomen (haASCs) and breast (hbASCs) and compared their molecular characteristics and ability to differentiate into adipocytes and develop paracrine function in vitro and in vivo. Our intention was to identify the best source of ASCs for potential clinical use. Moreover, we combined cell biology and bioinformatics to explore what mechanisms may help explain differences in proliferation and differentiation among ASCs from different sources.
Results
Characteristics of ASCs from three tissue sources
The htASCs, haASCs, and hbASCs began to adhere to the plates within 6 h after seeding. Initially, the cells were small, round, and irregular in size, with some mononuclear blood cells. By 48 h post-seeding, the cells gradually stretched into short or long spindle shapes with fibroblast-like morphology. Cells achieved 80-90% confluence after 7-8 days. After passage, all three cell types displayed typical fibroblast-like morphology; during subculture, cells reached the same confluence within 3-4 days after passage, with a 1:3 split ratio at P3 (Figure 1A). P3 ASCs were cultured with osteogenic, chondrogenic, or adipogenic induction medium, and the corresponding lineage-specific cell morphologies were observed after 2, 3, or 2 weeks of culture, respectively, based on staining with Alizarin Red, Alcian Blue, or Oil Red O. All three ASCs were able to undergo osteogenesis, chondrogenesis and adipogenic differentiation (Figure 1B–1D).
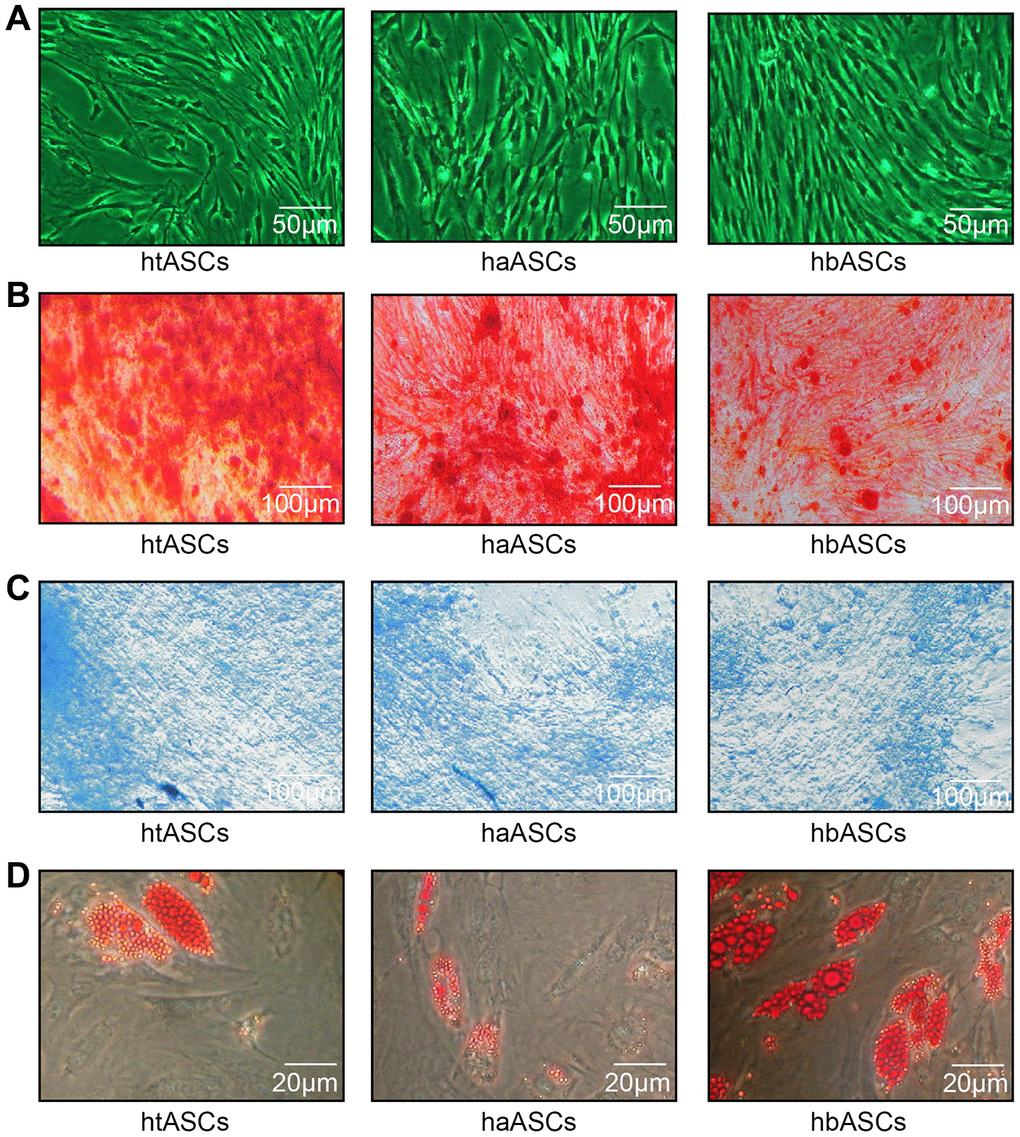
Figure 1. Proliferation and differentiation of haASCs, htASCs and hbASCs. (A) Passage 3 (P3) of htASCs, haASCs, and hbASCs. (B) Positive Alizarin Red staining of P3-htASCs, P3-haASCs, and P3-hbASCs following 3 weeks of osteogenic induction. (C) Positive Alcian Blue staining of P3-htASCs, P3-haASCs, and P3-hbASCs following 2 weeks of chondrogenic induction. (D) Positive Oil Red O staining of P3-htASCs, P3-haASCs, and P3-hbASCs following 2 weeks of adipogenic induction.
We further explored the immunophenotypic characteristics of ASCs, and the results confirmed the multipotency of htASCs, haASCs, and hbASCs. Flow cytometry showed that at P1, htASCs, haASCs, and hbASCs were positive for expression of mesenchymal surface markers HLA-ABC, CD13, CD29, CD44, CD49d, CD54, CD90, and CD105, and negative for expression of surface markers HLA-DR, CD14, CD31, CD34, CD45, and CD106. Expression of CD49d and CD54 was significantly higher in hbASCs than in htASCs or haASCs, whereas the three groups did not differ significantly in the expression of HLA-ABC, CD13, CD29, CD44, CD90, or CD105 (Table 1).
Table 1. Expression of various markers in undifferentiated ASCs at P1 by flow cytometric analysis (%).
| Marker | htASCs(n=3) | haASCs(n=3) | hbASCs(n=4) | ||||||||||||||||||||||||||||||||||||||||||||||||||||||||||||||||||||||||||||||||||||||||||||||||
| HLA-ABC | 93.6±3.2 | 90.5±2.8 | 92.9±3.3 | ||||||||||||||||||||||||||||||||||||||||||||||||||||||||||||||||||||||||||||||||||||||||||||||||
| HLA-DR | 1.9±0.3 | 2.1±0.6 | 1.7±0.4 | ||||||||||||||||||||||||||||||||||||||||||||||||||||||||||||||||||||||||||||||||||||||||||||||||
| CD13 | 99.1±0.4 | 97.7±0.8 | 98.8±0.5 | ||||||||||||||||||||||||||||||||||||||||||||||||||||||||||||||||||||||||||||||||||||||||||||||||
| CD14 | 2.3±0.4 | 2.7±0.5 | 2.6±0.5 | ||||||||||||||||||||||||||||||||||||||||||||||||||||||||||||||||||||||||||||||||||||||||||||||||
| CD29 | 98.5±1.2 | 95.8±1.1 | 97.6±1.4 | ||||||||||||||||||||||||||||||||||||||||||||||||||||||||||||||||||||||||||||||||||||||||||||||||
| CD31 | 1.2±0.5 | 1.7±0.6 | 1.5±0.7 | ||||||||||||||||||||||||||||||||||||||||||||||||||||||||||||||||||||||||||||||||||||||||||||||||
| CD34 | 4.7±0.7 | 4.5±0.6 | 4.2±0.5 | ||||||||||||||||||||||||||||||||||||||||||||||||||||||||||||||||||||||||||||||||||||||||||||||||
| CD44 | 91.3±2.5 | 93.4±2.9 | 92.2±2.6 | ||||||||||||||||||||||||||||||||||||||||||||||||||||||||||||||||||||||||||||||||||||||||||||||||
| CD45 | 3.9±0.8 | 4.2±0.9 | 3.8±0.7 | ||||||||||||||||||||||||||||||||||||||||||||||||||||||||||||||||||||||||||||||||||||||||||||||||
| CD49d | 36.7±1.8 | 34.8±2.2 | 58.6±3.1* | ||||||||||||||||||||||||||||||||||||||||||||||||||||||||||||||||||||||||||||||||||||||||||||||||
| CD54 | 29.4±1.6 | 31.6±1.9 | 43.5±2.7* | ||||||||||||||||||||||||||||||||||||||||||||||||||||||||||||||||||||||||||||||||||||||||||||||||
| CD90 | 88.6±2.3 | 90.2±3.3 | 87.5±2.8 | ||||||||||||||||||||||||||||||||||||||||||||||||||||||||||||||||||||||||||||||||||||||||||||||||
| CD105 | 90.5±2.6 | 93.1±3.4 | 91.4±2.9 | ||||||||||||||||||||||||||||||||||||||||||||||||||||||||||||||||||||||||||||||||||||||||||||||||
| CD106 | 2.7±0.9 | 3.3±0.9 | 3.1±0.8 | ||||||||||||||||||||||||||||||||||||||||||||||||||||||||||||||||||||||||||||||||||||||||||||||||
| * P<0.05 vs htASCs or haASCs. | |||||||||||||||||||||||||||||||||||||||||||||||||||||||||||||||||||||||||||||||||||||||||||||||||||
Proliferation and differentiation differences among haASCs, htASCs and hbASCs in vitro
During the normal culture process, CCK-8 tests were performed on the htASCs, haASCs, and hbASCs. Proliferation rate and growth capacity were similar among these three types of ASCs (Figure 2A), with no significant difference in growth ability or cell doubling time, which was 39.13±4.30 min for htASCs, 40.63±2.97 min for haASCs, and 40.16±1.69 min for hbASCs.
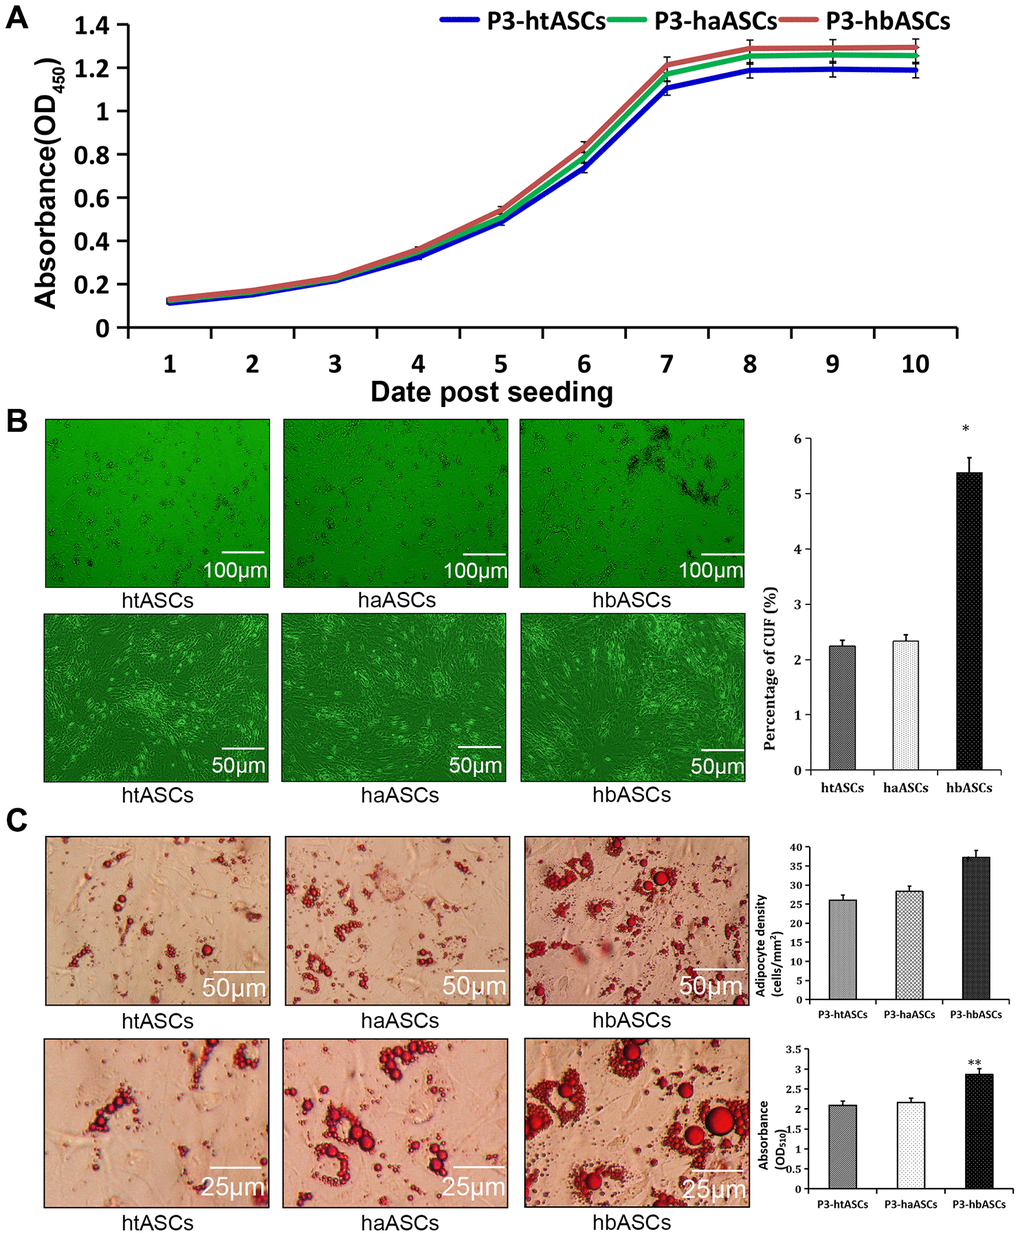
Figure 2. Different proliferation and differentiation abilities of haASCs, htASCs and hbASCs in vitro. (A) Cell proliferation as assessed by a CCK-8 assay. The proliferation rate and growth capacity of htASCs were similar to those of haASCs or hbASCs, but there was no significant difference in cell doubling time among htASCs, haASCs, and hbASCs. (B) Colony formation assays. Cells within the colonies exhibited long-spindle, short-spindle, short-round, or long-narrow morphology. After 14 days, colony forming units (CFUs) were significantly higher for hbASCs than for htASCs or haASCs (P < 0.05). (C) Adipogenic differentiation assay of htASCs, haASCs, and hbASCs in vitro. Adipocyte density and lipid concentration were significantly different between hbASCs and the other two ASC types. *P<0.05, **P<0.05
Colony formation was also calculated for htASCs, haASCs, and hbASCs. After 10 days of culture, single cell-derived colonies were observed, consisting of 100-150 cells. Cells within the colonies were classified as long spindle, short spindle, short round, or long narrow shaped (Figure 2B). The hbASC colonies grew gradually, while colonies of htASCs and haASCs grew slowly. Results revealed significantly greater colony formation by hbASCs (5.38%±0.27%) than htASCs (2.24%±0.17%, P < 0.05) and haASCs (2.33%±0.19%, P < 0.05) (Figure 2B).
Moreover, we found that htASCs, haASCs, and hbASCs exhibited different adipogenic potential in vitro. After 14 days of induction of adipogenic differentiation, hbASCs contained a large number of Oil Red O-positive lipid droplets in their cytoplasm. In contrast, htASCs and haASCs contained relatively few such droplets (Figure 2C). The hbASCs also showed higher adipocyte density and lipid concentration than htASCs and haASCs.
Different proliferation and adipogenic differentiation abilities of haASCs, htASCs and hbASCs in vivo
All animals were assessed at 12 weeks after transplantation. Macroscopic findings demonstrated that regenerated tissue had formed at the implantation site, and this tissue was excised for subsequent testing. The wet weight of the neogenic tissue was significantly greater in hbASCs than in htASCs or haASCs (Figure 3A). H&E staining indicated that the regenerated tissue in all three groups was composed of adipose tissue that had matured to differing degrees (Figure 3B): the tissue in the case of hbASCs was more mature and showed no signs of fibrosis. The collagen sponges degraded during the 12-week interval since implantation.
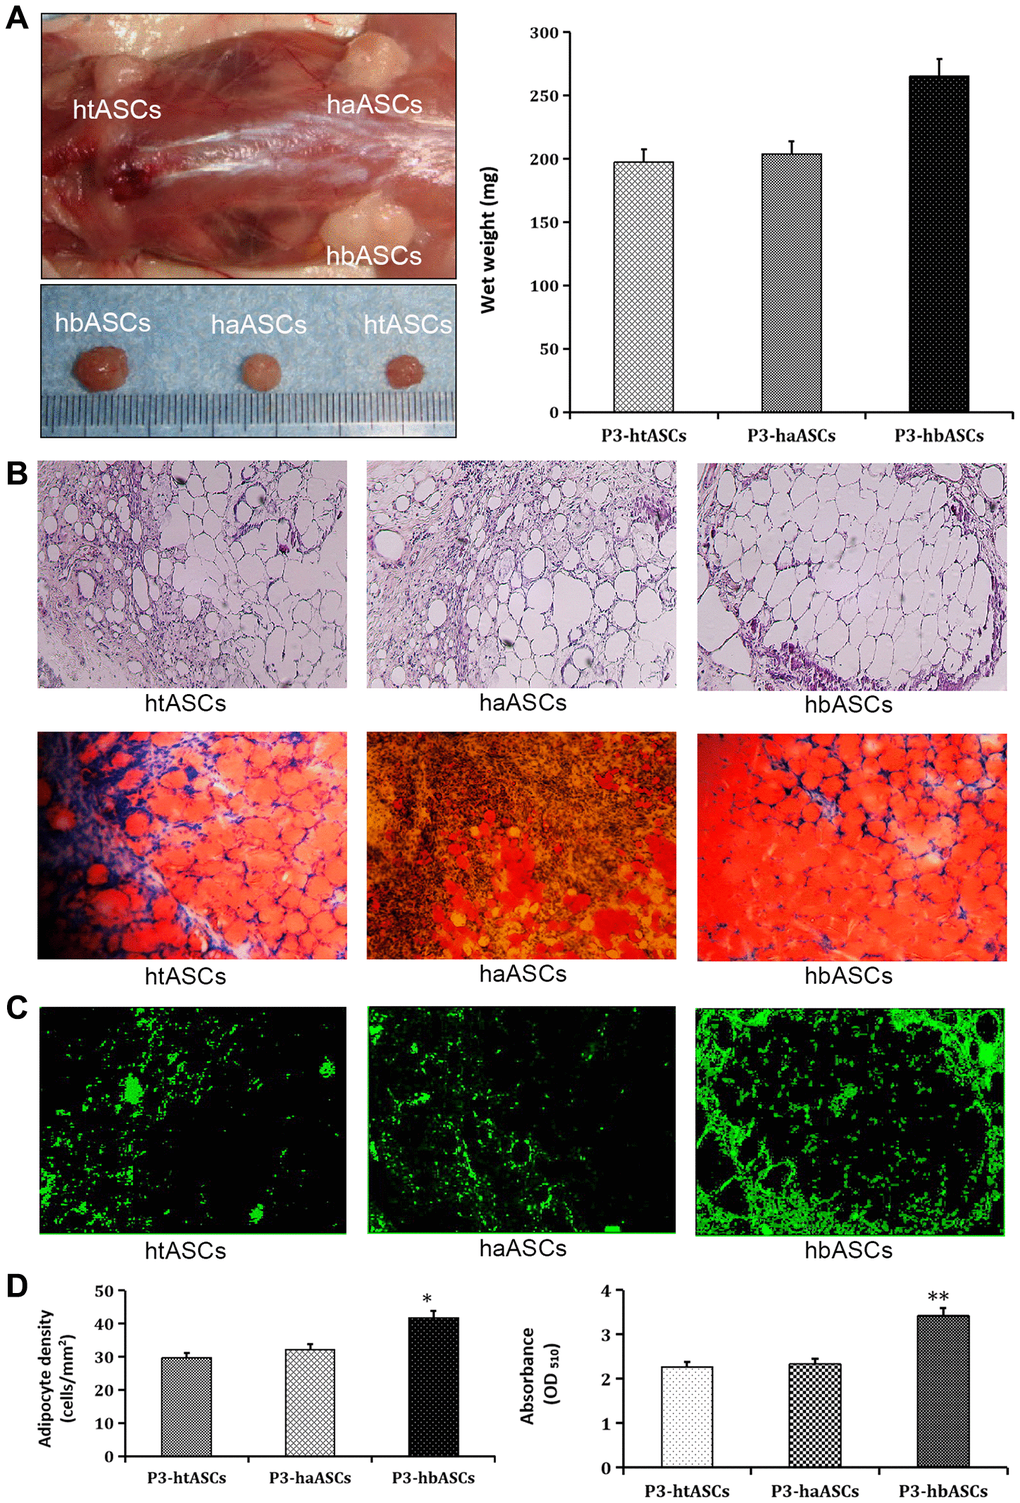
Figure 3. Different proliferation and differentiation abilities of haASCs, htASCs and hbASCs in vivo. (A) Regenerative adipose tissue macroscopic findings. Wet weights of regenerative adipose tissue in htASCs, haASCs, and hbASCs. *P<0.05. (B) H&E staining of the regenerative tissue after 12 weeks. The transplants derived from the three ASC types consisted predominantly of mature adipose tissue. Magnification, 100×. (C) GFP staining of the regenerative tissue after 12 weeks. In contrast to htASC or haASC tissue, GFP+ hbASC tissue contained larger Oil Red O-positive lipid droplets in the cytoplasm. GFP+ cells were detected in regenerative mature adipose tissue, indicating that these mature adipocytes had differentiated from GFP-labeled ASCs. Magnification, 100×. (D) Quantitative measurement of adipogenesis ability. Adipocyte density and intracellular lipid content were higher in hbASC tissue than in htASC or haASC tissue. *P < 0.05,**P < 0.05.
Neogenic tissue was also visualized by GFP (Figure 3C), indicating that the mature adipose cells had differentiated from GFP-labeled ASCs. Oil Red O staining showed that neogenic tissue derived from hbASCs contained more Oil Red O-positive lipid droplets within the cytoplasm, more adipocytes and higher intracellular lipid content than tissue derived from htASCs or haASCs (Figure 3D). These data indicate differing adipogenic potential in the various ASCs.
DEGs between haASCs and hbASCs
Of 12,466 DEGs between haASCs and hbASCs, 5,699 were up-regulated and 6,769 down-regulated in hbASCs (Figure 4A). These genes included several involved in paracrine function: FGF9, FGF16, FGF18, FGF12, IGFBP2, CXCL2, FGF13, CCL5 and FGF10 were up-regulated in hbASCs, while IGF2, IL1B, FGF20, FGF5, EGF, IL15, FGF23 and FGF2 were down-regulated (Figure 4B).
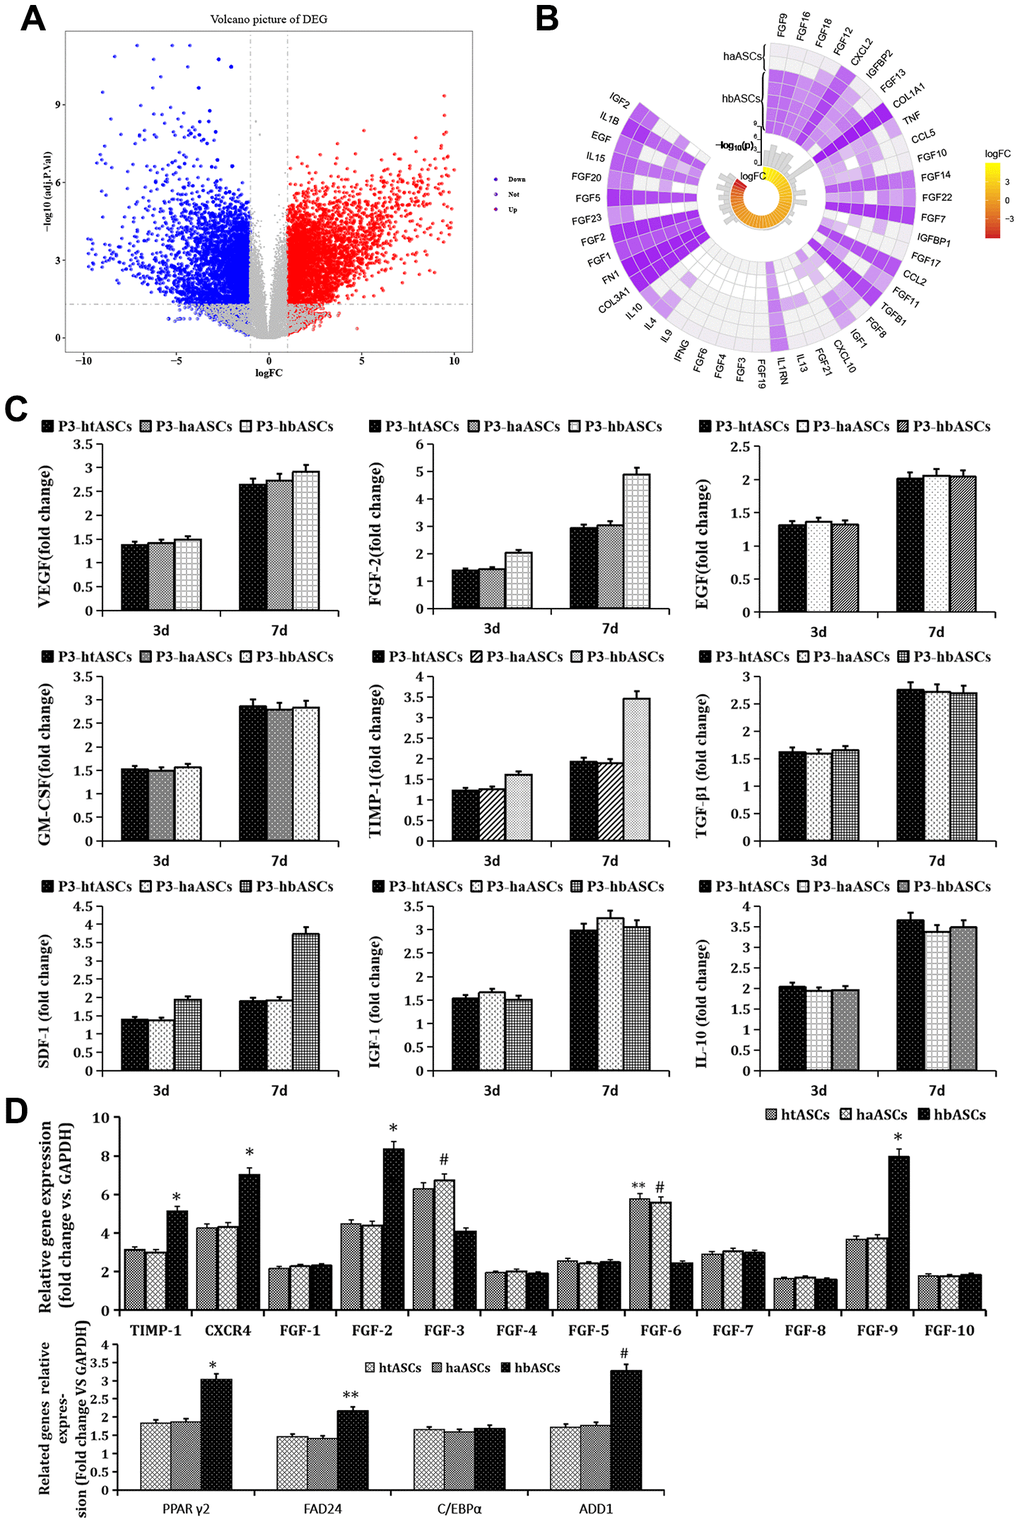
Figure 4. Genes differentially expressed between haASCs and hbASCs. (A) Volcano map. Red means up-regulated genes; blue means down-regulated genes. (B) Circplot associated with paracrine genes of ASCs. (C) ELISA of paracrine factors produced by htASCs, haASCs, and hbASCs in vitro. Higher levels of FGF2, TIMP-1, and SDF-1 were secreted by hbASCs than by htASCs or haASCs at 3 and 7 d. *P<0.05. (D) Differences in expression of genes related to paracrine function and adipogenesis across the three types of transplants. The hbASC tissue showed up-regulation of TIMP-1, CXCR4, FGF2, FGF9, PPAγ2, FAD24 and ADD1, but down-regulation of FGF3 and FGF6 relative to htASC and haASC tissue. C/EBPα expression was similar between htASC and haASC tissue. *P < 0.05, **P < 0.05, #P < 0.05
At days 3 and 7 of cell culture, concentrations of FGF2, TIMP-1, and SDF-1 in culture medium were higher in hbASCs than in htASCs or haASCs (Figure 4C). Moreover, qPCR analysis demonstrated that levels of mRNAs encoding TIMP-1, CXCR4, FGF2, or FGF9 were significantly higher, while levels of mRNAs encoding FGF3 and FGF6 were significantly lower, in neogenic tissue derived from hbASCs than in tissue derived from htASC or haASC (Figure 4D). Expression of FGF1, FGF4, FGF5, FGF7, FGF8, and FGF10 was similarly low across all three groups.
Analysis of adipogenesis-related genes revealed that PPARγ2, FAD24, and ADD1 were expressed at higher levels in hbASCs than in htASCs and haASCs (Figure 4D). However, C/EBPα expression was similar across neogenic tissue samples from the three groups.
BPs and pathways involving DEGs
Enrichment analysis showed that DEGs were significantly involved in BPs such as nuclear division, organelle fission, DNA conformational change, sister chromatid segregation, nuclear chromosome segregation, chromosome segregation, negative regulation of the mitotic cell cycle, renal system development and urogenital system development (Figure 5A). Moreover, DEGs were significantly involved in KEGG pathways such as as the cell cycle, MAPK signaling pathway, mTOR signaling pathway, cellular senescence and PI3K-Akt signaling pathway (Figure 5B).
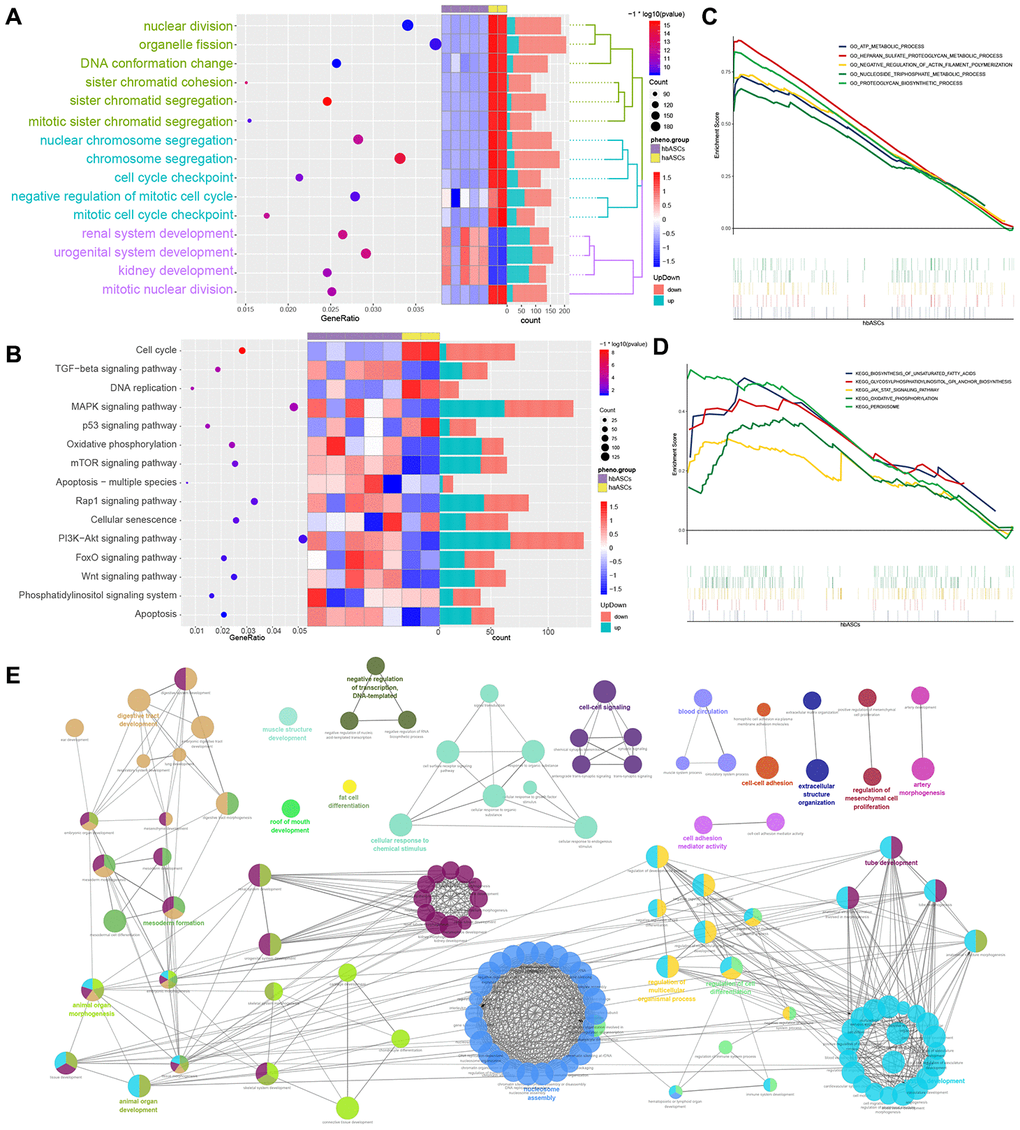
Figure 5. Analysis of enrichment in biological processes and KEGG pathways. (A) Biological process enrichment. (B) KEGG pathway enrichment. (C) GSEA of biological processes. (D) GSEA of KEGG pathways. (E) ClueGO analysis of biological processes.
GSEA showed that hbASCs were enriched in genes involved in ATP metabolism, HEparan sulfate proteoglycan metabolism, negative regulation of actin filament polymerization, nucleoside triphosphate metabolism and proteoglycan biosynthesis (Figure 5C, 5D). These genes were also involved in biosynthesis of unsaturated fatty acids, glycosylphosphatidylinositol anchor biosynthesis, JAK-STAT signaling, oxidative phosphorylation and peroxisome assembly and function.
ClueGO analysis showed that hbASCs were enriched for DEGs involved in such BPs as muscle structure development, digestive tract development, tube development, regulation of processes in multicellular organisms, regulation of cell differentiation, regulation of mesenchymal cell proliferation and fat cell differentiation (Figure 5E).
These analyses are consistent with our in vitro observations that hbASCs proliferate and differentiate more than haASCs.
FGF2 acts via PI3K/Akt signaling to regulate hbASC proliferation and adipogenic differentiation
Based on the bioinformatics analysis and experiments, we further explored the relationship between FGF2 and PI3K-Akt signaling. FGF2 expression positively correlated with that of genes in the PI3K-Akt signaling pathway (Figure 6A), suggesting that hbASCs may promote their own proliferation and differentiation by secreting FGF2 (Figure 6B). To test this idea, we used Oil Red O staining to compare the numbers of cytoplasmic lipid droplets in the three types of ASCs (Figure 6C–6E): the numbers of droplets varied directly with the level of FGF2. Furthermore, we found that treating the three types of ASCs with the PI3K inhibitor LY294002 reduced the number of cytoplasmic lipid droplets and down-regulated Akt and PPARγ2, while treating cells with exogenous FGF2 exerted the opposite effects. These results suggest that FGF2 promotes adipogenic differentiation via the PI3K/Akt signaling pathway.
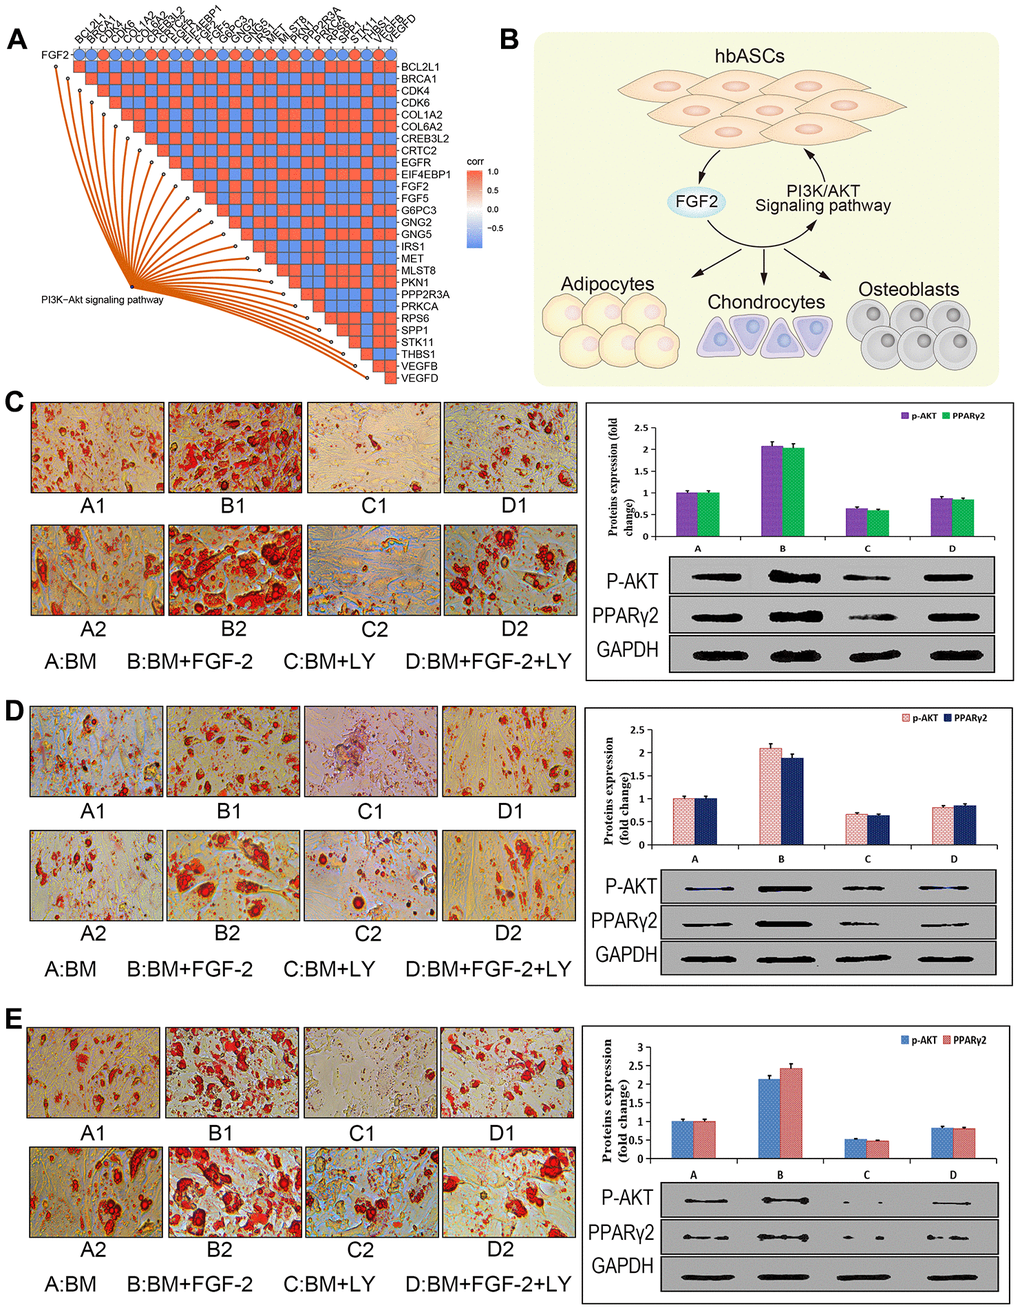
Figure 6. Promotion of adipogenic differentiation by FGF2 via the PI3K/Akt signaling pathway in vitro. (A) Correlation analysis plot of the FGF2-PI3K/Akt signaling pathway. (B) Potential mechanism by which this pathway enhances proliferation and differentiation of hbASCs. (C) Oil Red O staining of hbASCs showing that FGF2 promoted adipogenic differentiation. (D) Oil Red O staining of htASCs showing that FGF2 promoted adipogenic differentiation. (E) Oil Red O staining of haASCs showing that FGF2 promoted adipogenic differentiation. Akt and PPARγ2 levels were significantly higher in group B than in groups A, C, or D, based on western blot. LY294002 suppressed adipogenic differentiation of htASCs, haASCs, and hbASCs based on Oil Red O staining, while down-regulating Akt and PPARγ2 based on western blotting. *P<0.01, **P<0.01. Group descriptions: (A) basic adipogenic induction medium (BM); (B) BM+FGF2 (0.1 μg/mL); (C) BM+LY294002; (D) BM+FGF2 (0.1 μg/mL)+LY294002. Magnification of panels A1-D1, 200×. Magnification of panels A2-D2, 400×.
Discussion
Stem cell transplantation and regenerative medicine have shown increasing promise for the replacement of damaged or aging tissue [25–29]. However, stem cells isolated from embryos, umbilical cord blood, or bone marrow can lose quality as they age, they are often difficult to harvest and manipulate, and they are expensive to prepare [30–33]. ASCs, in contrast, can be collected, processed and propagated in a simple, minimally invasive way from excised fat tissue or lipoaspirate. Their pluripotency and proliferative efficiency are similar to those of bone marrow-derived stem cells, and donor morbidity is lower than for MSCs harvested from other sites. Perhaps most importantly, adipose tissue can produce 100-1000 times more MSCs per cubic centimeter than bone marrow [34]. In addition, ASCs survive longer and do not undergo senescence in culture as rapidly as bone marrow-derived stem cells, which allows for greater procedural flexibility. These characteristics suggest that ASCs are well suited to regenerative medicine [35–38], but the best source of ASCs has not yet been elucidated. Our results here suggest that breast may be better than thigh or abdomen as a source of ASCs for regenerative therapy.
Our research described successful isolation of ASCs from the adipose tissue of the abdomen, thigh, and breast, suggesting their potential application in regenerative medicine. Moreover, we found that hbASCs showed greater proliferation and differentiation ability than htASCs or haASCs, perhaps reflecting the differences between breast adipose tissue and other subcutaneous fat deposits in the body. Flow cytometry showed that the proportions of cells positive for CD49d or CD54 were significantly higher in hbASCs than in htASCs or haASCs. CD49d corresponds to the α chain of integrin, while CD54 is a cell adhesion molecule, and both play an important role in cell surface adhesion and signal transmission [39, 40]. Cell adhesion molecules act through various mechanisms to regulate stem cell proliferation, self-renewal, adhesion and multi-lineage differentiation [41]. Therefore, high expression of CD49d and CD54 may help explain the greater differentiation potential of hbASCs.
To further understand why hbASCs show greater proliferation and differentiation potential, we performed comparative RNA-seq. This identified several genes related to paracrine function that were up-regulated in hbASCs relative to haASCs. Consistently, hbASC cultures secreted higher levels of the paracrine factors FGF2, TIMP-1, and SDF-1 than htASCs or haASCs. Consistently, another study showed that breast ASCs express significantly higher levels of FGF2 than ASCs from other sources [42]. In the present study, the genes TIMP-1, CXCR4, FGF2 and FGF9 were up-regulated in hbASCs, while FGF3 and FGF6 were down-regulated. FGF2, one of the best studied fibroblast growth factors, participates in cell division, differentiation, proliferation life, survival, carcinogenesis, and self-renewal of stem cells [43–45]. Our results identify several molecular differences that help explain why hbASCs show greater potential in regenerative medicine than htASCs or haASCs.
Functional enrichment analysis showed that DEGs in hbASCs are involved in MAPK and PI3K/Akt signaling pathways, which are involved in proliferation and differentiation. In particular, the PI3K/Akt signaling pathway has been shown to play an important role in the proliferation and differentiation of ASCs [46, 47]. Given our finding of FGF2 up-regulation in hbASCs, we asked whether this paracrine factor may act via the PI3K/Akt pathway. We found that, indeed, FGF2 levels correlated directly with expression of DEGs involved in the PI3K/Akt signaling pathway, and treatment of ASCs with exogenous FGF2 enhanced their adipogenic differentiation and up-regulated Akt and PPARγ2, while treatment with the PI3K inhibitor LY24402 led to the opposite effects. These results suggest that FGF2 promotes adipocyte differentiation through the PI3K/Akt signaling pathway, which may help explain why hbASCs have stronger differentiation ability than the other two types of ASCs.
Interestingly, hbASCs expressed higher levels of FGF2 protein than haASCs but lower levels of FGF2 mRNA. This may relate to the fact that FGF2 is translated from an internal ribosome entry site on the mRNA [48], and that FGF2 is regulated at the post-transcriptional stage. According to RNA interactome database (http://www.rna-society.org/raid/) [49], we also found that the post-transcriptional inhibitor PUM2 [50], which shows a strong binding score (0.6668) to FGF2 and is down-regulated in hbASCs relative to haASCs (Supplementary Figure 1). We cannot exclude that intrinsic variations in FGF2 expression across individuals may also contribute to the differences that we observed across the three ASC types [51].
Our results should be interpreted with caution in light of several limitations. First, the samples used in this experiment came from plastic surgery, so it was difficult to obtain adipose stem cells from three locations in the same patient. In addition, we did not record donor age or sex, which would be important for comparing the robustness of the three ASC types to aging or hormone exposure. We also did not examine whether adding exogenous FGF2 to ASCs can even out the differences that we observed here, in which case the promising characteristics of hbASCs could also be achieved in ASCs from other sources.
Conclusion
Human ASCs from breast show stronger proliferation and adipogenic differentiation ability than ASCs from thigh or abdomen. This may be due to FGF2 up-regulation, which stimulates the PI3K/Akt signaling pathway.
Materials and Methods
Patients and samples
Breast fat from five healthy adult donors and abdominal subcutaneous fat from two healthy adult donors were used for RNA sequencing (RNA-seq). In addition, subcutaneous adipose tissue was harvested from abdomen, thigh and breast of 10 women undergoing reduction mammoplasty (Table 2). These procedures were performed with the approval of the Research Ethics Committee of the Fifth Affiliated Hospital of Guangxi Medical University, and all subjects signed consent forms. The volunteers were patients of the Fifth Affiliated Hospital of Guangxi Medical University and the Nanning Dream Plastic and Aesthetic Hospital between March 2015 and June 2017.
Table 2. Subject characteristics.
| Subject | Age (yr) | Sex | Ethnicity | Locations sampled | Height (cm) | Weight (kg) | Body mass index, kg/m2 |
| S1 | 28 | F | Han | Abdomen, Thigh | 161 | 68 | 26.23 |
| S2 | 32 | F | Chuang | Breast | 166 | 71 | 25.77 |
| S3 | 41 | F | Chuang | Abdomen, thigh | 159 | 65 | 25.71 |
| S4 | 38 | F | Yao | Breast | 167 | 75 | 26.89 |
| S5 | 30 | F | Chuang | Thigh | 158 | 66 | 26.44 |
| S6 | 36 | F | Yao | Thigh | 157 | 64 | 25.96 |
| S7 | 45 | F | Han | Thigh | 160 | 70 | 27.34 |
| S8 | 26 | F | Han | Abdomen | 163 | 65 | 24.46 |
| S9 | 35 | F | Miao | Abdomen | 162 | 63 | 24.01 |
| S10 | 43 | F | Han | Breast | 165 | 72 | 26.45 |
Isolation and identification of ASCs
ASCs were isolated and cultured as previously described [52, 53]. First-passage htASCs, haASCs, and hbASCs were analyzed using a Becton Dickinson FACS Calibur flow cytometer. Cells (1×10⁶) were incubated for 30 min with either fluorescein isothiocyanate (FITC)- or phycoerythrin (PE)-conjugated antibodies (BD Biosciences, NJ, USA) against the following ASC surface markers, selected based on previous studies [54–56]: CD13/PE, CD14/FITC, CD29/PE, CD31/FITC, CD34/FITC, CD44/PE, CD45/FITC, CD49d/PE, CD54/PE, CD90/PE, CD105/PE, CD106/FITC, HLA-ABC/FITC, and HLA-DR/FITC. The negative control IgG-PE antibodies were added in the dark at room temperature and incubated for 30 min. Data analysis was performed using Cell Quest Pro acquisition software (BD Biosciences). In order to detect cell differentiation, third-passage (P3) htASCs, haASCs, and hbASCs were cultured in adipogenic, osteogenic, or chondrogenic culture media. Cell preparations were stained with Oil red O to detect adipogenic differentiation, alizarin red to detect osteogenic differentiation, or toluidine blue to detect chondrogenic differentiation.
RNA extraction and sequencing
P3 ASCs were used for RNA-seq experiments. The purity, concentration and integrity of RNA samples for sequencing were assessed using Nanodrop, qubit 2.0 and agent 2100 methods. Library construction and RNA-seq were performed according to instructions. RNA-seq was performed on an Illumina hiseqtm 2500 in the case of haASCs or on a NovaSeq system in the case of hbASCs. Raw RNA-seq data were filtered to remove low-quality and interrupted reads to obtain high-quality clean data, which were then stored in FASTQ file format. The reads obtained by sequencing each sample of haASCs and hbASCs were compared to the reference genome using BWA software [57].
Labeling of ASCs with adenovirus-delivered GFP (Ad-GFP)
P3 ASCs were labeled with green fluorescent protein (GFP). A replication-defective recombinant adenovirus encoding GFP (Ad-GFP) in 200 μL of serum-free medium was added to cells in suspension, corresponding to different multiplicities of infection (MOIs) ranging from 0 to 200, and the flask was gently shaken every 15 min for 2 h. Then medium containing 2.5% fetal bovine serum (FBS) was added to the flask. Transduction efficiency was determined by flow cytometry after 48 h. The resulting optimal MOI for transduction of ASCs was used in subsequent steps. The cells were directly analyzed and green autofluorescence was detected by inverted fluorescence microscopy (Leica, Germany). Three days later, P3 htASCs, haASCs, and hbASCs were collected for transplantation in vivo.
Measurement of cell growth and proliferation
Growth and proliferation of P3 htASCs, haASCs, and hbASCs were examined using the cell counting kit-8 (CCK-8) method. The cells were transferred to a 96-well plate at a density of 2×10⁴ cells/well and cultured for 24 h at 37 ºC with 50 mL/L CO2. Cells were then randomly divided into 3 groups, with six wells per group (n=6). After 10 additional days of culture, during which the medium was changed at the same time in all groups, 50 μL CCK-8 working fluid was added, and the culture plates were incubated another 4 h. After 10-min oscillations, optical density at 450 nm was determined using a microplate reader in order to obtain growth curves.
ASC colony formation assays
The three groups htASCs, haASCs, and hbASCs were seeded in 24-well plates at a density of 5000 cells/well and cultured at 37 ºC with 50 mL/L CO2 for 14 days. The cells were then fixed with 100% methanol and stained with 0.1% (w/v) crystal violet. Macroscopic cell colonies were counted in terms of colony forming units (CFU) using Image-Pro Plus 6.0 software (Media Cybernetics, Silver Spring, MD, USA). Each measurement was performed four times. At the same time, cell colonies were counted under a contrast phase microscope prior to staining.
Paracrine activity of ASCs in vitro
The three groups htASCs, haASCs, and hbASCs were seeded in 12-well plates at a density of 2×10⁴ cells/well and cultured at 37 ºC with 50 mL/L CO2 for 7 days. After 3 and 7 days, the supernatant was collected for enzyme-linked immunosorbent assay (ELISA) of the following factors: vascular endothelial growth factor (VEGF), fibroblast growth factor-2 (FGF2), epidermal growth factor (EGF), granulocyte-macrophage colony-stimulating factor (GM-CSF), tissue inhibitor of metalloproteinases-1 (TIMP-1), insulin-like growth factor-1 (IGF-1), stromal cell-derived factor-1 (SDF-1), transforming growth factor-beta1 (TGF-β1), and interleukin-10 (IL-10). All assays were performed using commercially available Quantikine Colorimetric Sandwich ELISA kits (R&D Systems, Minneapolis, MN, USA) according to the manufacturer’s instructions.
Adipogenic differentiation capacity of ASCs in vitro
The three groups htASCs, haASCs, and hbASCs were cultured for up to 14 days in 6-well plates at a seeding density of 500 cells/mm2 with adipogenic induction medium containing 200 μM indomethacin, 10 μM insulin, 0.5 mM 3-isobutyl-1-methylxanthine, and 1 μM dexamethasone. Adipogenic differentiation capacity was determined by Oil Red O staining according to our previous description [24]. In this method, lipids appear red and nuclei appear pale blue. The adipocyte density for each sample was measured in six different visual fields under the same magnification in a blinded fashion. The cell numbers were normalized to square millimeters. The lipids were extracted from the cells with 100% isopropanol and gentle shaking for 5 min. The concentration of the lipids was measured in triplicate based on absorbance at 510 nm.
Assessment of the ability of FGF2 to promote differentiation of haASCs, hbASCs and htASCs in vitro
The htASCs, haASCs, and hbASCs were each seeded onto one 12-well plate (one 12-well plate for each type of ASC) at a density of 1×10⁵ cells/well and were induced in basic adipogenic induction medium (BM) containing 200 μM indomethacin, 10 μM insulin, 0.5 mM 3-isobutyl-1-methylxanthine, and 1 μM dexamethasone (group A), BM supplemented with 0.1 μg/mL FGF2 (group B), BM supplemented with 1 μg/mL LY294002 (group C), and BM supplemented both with 0.1 μg/mL FGF2 and 1 μg/mL LY294002 (group D). Medium was replaced every 3 days, and the cells were maintained in culture for up to 2 weeks. Adipogenic differentiation was determined by Oil Red O staining. At the same time, cell samples from each group were harvested for western blot analysis. Briefly, the cell pellets were sonicated in extraction buffer, extracts were quantified using the Bio-Rad DC protein assay kit (BioRad, Hercules, CA, USA), then equal amounts of protein were lysed with sodium dodecyl sulfate (SDS) sample buffer and transferred to polyvinylidene difluoride (PVDF) membranes (Millipore, Bedford, MA, USA). Membranes were then blocked with blocking solution (Pierce, Rockford, IL, USA), incubated with primary antibodies against human Akt and human peroxisome proliferator-activated receptor gamma 2 (PPARγ2) (all from Abcam, London, UK), followed by incubation with horseradish-peroxidase (HRP)-conjugated secondary antibody. Enhanced chemiluminescence substrate (Supersignal West Dura Detection System, Pierce) was then used for primary antibody detection. GAPDH was used as a control.
ASC transplantation in vivo
Eighteen nude mice (average weight, 18.0 g ± 3.0 g) served as transplantation models. P3 htASCs, haASCs, and hbASCs were labeled with GFP and cultured in adipogenic differentiation induction medium for 7 days. One collagen type I sponge scaffold (10 mm long, 10 mm wide, 5 mm thick) was put into each culture plate, which were divided into three groups and seeded with third-passage haASCs, htASCs or hbASCs (1×10⁷ cells per well) in growth culture medium. At 24 h later, the collagen scaffold-loaded cell suspensions were injected into each mouse subcutaneously at three locations. Each location randomly received 1.0 mL 1×10⁷ cells/mL htASCs, haASCs, or hbASCs. The mice were fed routinely after transplantation.
Megascopic measurement and adipogenesis quantitation
At 12 weeks post-transplantation, all transplants were excised from the subcutaneous implantation area and weighed using a standard electronic balance. Each group of grafts was divided into two equal parts. One part was fixed with formalin, embedded in paraffin, stained with hematoxylin and eosin (H&E), and observed with an optical microscope. The other part was used immediately to prepare frozen sections, which were stained with Oil Red O. The two types of preparations were analyzed at the same magnification, and fat cell density was quantitated in 5 fields in a blinded fashion. Cell numbers were normalized to square millimeters. Lipids were extracted from cells with 100% isopropanol and gentle shaking for 5 min. Lipid concentrations were measured in triplicate based on absorbance at 510 nm.
Real-time qPCR
Total RNA was extracted using Trizol reagent (Invitrogen) and treated with DNase I. The cDNA conversion was accomplished using the RevertAid™ First Strand Synthesis Kit (Fermentas), and qPCR was performed using the SYBR® Green PCR Master Mixes on a StepOnePlus Real-Time PCR System (Applied Biosystems) utilizing the primer pairs shown in Table 3. The genes analyzed encode factors related to paracrine function and adipogenesis. The 2–ΔΔCT method [58–60] was used to quantify gene expression relative to that of GAPDH expression. Data were presented as fold change relative to the control.
Table 3. qPCR primer sequences for target genes.
| Gene | Forward | Reverse | Accession ID |
| TIMP-1 | CTTCTGCAATTCCGACCTCGT | AAGTATCCGCAGACACTCTCC | NM_001044384 |
| CXCR4 | CTTCATCAGTCTGGACCGCTA | CATCTGCCTCACTGACGTTG | XM_006529113 |
| FGF-1 | TTCACAGCCCTGACCGAGA | TATAAAAGCCCGTCGGTGTC | XM_006525647 |
| FGF-2 | GCGACCCTCACATCAAGCTAC | AAGAAACACTCATCCGTAACACA | XM_903202 |
| FGF-3 | ACCTCCACTGCCGTTATCTCC | GCAAGCTCTACTGCGCCACGAA | NM_008007 |
| FGF-4 | ACGAAGCCAATATGTTAAGTGT | TTATTCAGGGCCACATACCAC | NM_010202 |
| FGF-5 | CAAAGTCAATGGATCCCACGAA | GTCATCTGTGAACTTGGCACT | NM_001277268 |
| FGF-6 | GTGCCCTCTTCGTTGCCAT | GCTTTACCCGTCCGTATTTGCT | NM_010204 |
| FGF-7 | TGACTCCAGAGCAAATGGCTA | TTTGATTGCCACAATTCCAAC | NM_008008 |
| FGF-8 | ACCAACTCTACAGCCGCACCA | ACAATCTCCGTGAAGACGCAGT | NM_001166361 |
| FGF-9 | CTTCCCCAATGGTACTATCCAG | ATTCATCCCGAGGTAGAGTCCA | NM_013518 |
| FGF-10 | TGCGGAGCTACAATCACCT | TGACGGCAACAACTCCGAT | NM_008002 |
| PPARγ2 | TGTCTCATAATGCCATCAGGT | TCTTTCCTGTCAAGATCGC | XM_006505743 |
| C/EBPα | GCCGCGCACCCCGACCTCC | CCCCGCAGCGTGTCCAGTTCG | NM_001287514 |
| ADD1 | AGTACAAAGCCAAGTCCCGTTC | CCCGAATCACCGTCACTAGCAA | NM_001024458 |
| FAD24 | GGGAACTTGAGGAAGAGATCATTG | GGATCTGATAATATGGCAGATGCC | NM_021315 |
| GAPDH | CAAATTCCATGGCACCGTCA | GACTCCACGACGTACTCAGC | NM_001289726 |
Analysis of differential expression and functional enrichment
Genes differentially expressed (DEGs) between hbASCs and haASCs were screened using the limma package [61] in R. Genes with P < 0.05 and |log2 fold change (FC)| > 1 were considered to be DEGs. The subset of DEGs associated with a P (adjusted by the false discovery rate) < 0.01 and |log2 FC|> 2 were selected to perform Gene Ontology (GO) and Kyoto Encyclopedia of Genes and Genomes (KEGG) pathway enrichment analyses using the clusterProfiler package [62] in R, for which P < 0.05 was considered significant.
Gene set enrichment analysis (GSEA) and ClueGO analysis
GSEA was performed using the normalized gene expression profiles to explore biological processes (BP) and Kyoto Encyclopedia of Genes and Genomes (KEGG) pathways related to ASCs. The Java software of GSEA (version 2-2.2.4) was used in the analysis. The c5.bp.v6.2.symbols.gmt and c2.cp.kegg.v6.2.symbols.gmt datasets in the MsigDB V6.2 database [63] were used as reference gene sets, and GSEA was performed with default parameters. In addition, ClueGO [64] in Cytoscape [65] was used to analyze BP enrichment for selected DEGs.
Statistical analysis
Data were reported as mean ± standard deviation (SD). We performed an analysis of variance to determine whether the means of all groups were similar. This approach took into account intra- and inter-group variation. Furthermore, if the analysis of the variance of the three means revealed statistically significant differences, all pairs of means were compared using paired t-tests. Differences between means were regarded as significant if the resulting two-tailed P was < 0.05. All data were analyzed using SPSS for Windows 17.0 (Chicago, IL, USA).
Supplementary Materials
Author Contributions
Guan-Ming Lu, Yong-Xian Rong, Steven Mo, Dong lin Hunag, Fang Xiao Wu and Hong-Mian Li: Conception and design, and Manuscript writing. Zhi-Jie Liang, Steven Mo, Zhi-Zhai Luo and Yan-Fei Ma: Provision of study material or patients, Collection and/or assembly of data. Xin-Heng Liu and Hong-Mian Li: Data analysis and interpretation. Hong-Mian Li and Guan-Ming Lu: Financial and administrative support. All authors: Final approval of manuscript.
Conflicts of Interest
Steven Mo is employed by Nanning Life-Ontology Biotechnology Co., Ltd. (Nanning, China). The other authors declare no conflicts of interest.
Funding
This work was financially supported by the National Nature Science Foundation of China (81760346, 81860341); the Guangxi Natural Science Foundation (2018GXNSFAA281148); the Scientific Research & Technology Development Program of Nanning (20173021-2,20183037-1,20191034), the Yong River Program of innovation and entrepreneurship of Nanning(2018-01-07); Department of Breast and Thyroid Surgery, Affiliated Project of Guangxi natural fund surface (NO:2019JJA140071); Innovation Project of Guangxi Graduate Education (YCBZ2018041), the Nanning Excellent Young Scientist Program (RC20180201), and Self-financing research Project of Guangxi Health and Family Planning Commission (Z20180679); The First Batch of High-level Talent Scientific Research Projects of the Affiliated Hospital of Youjiang Medical University for Nationalities in 2019 (Contract No. R20196307). The authors thanks Life-Ontology Biotechnology Co., Ltd (Nanning, China) for its assistance in bioinformatics analysis.
References
- 1. Gentile P, Kothari A, Casella D, Calabrese C. Fat graft enhanced with adipose-derived stem cells in aesthetic breast augmentation: clinical, histological, and instrumental evaluation. Aesthet Surg J. 2019. [Epub ahead of print]. https://doi.org/10.1093/asj/sjz292 [PubMed]
- 2. Gentile P, Casella D, Palma E, Calabrese C. Engineered fat graft enhanced with adipose-derived stromal vascular fraction cells for regenerative medicine: clinical, histological and instrumental evaluation in breast reconstruction. J Clin Med. 2019; 8:504. https://doi.org/10.3390/jcm8040504 [PubMed]
- 3. Philips BJ, Marra KG, Rubin JP. Adipose stem cell-based soft tissue regeneration. Expert Opin Biol Ther. 2012; 12:155–63. https://doi.org/10.1517/14712598.2012.644533 [PubMed]
- 4. Garcia-Olmo D, Herreros D, Pascual I, Pascual JA, Del-Valle E, Zorrilla J, De-La-Quintana P, Garcia-Arranz M, Pascual M. Expanded adipose-derived stem cells for the treatment of complex perianal fistula: a phase II clinical trial. Dis Colon Rectum. 2009; 52:79–86. https://doi.org/10.1007/DCR.0b013e3181973487 [PubMed]
- 5. De Decker M, De Schrijver L, Thiessen F, Tondu T, Van Goethem M, Tjalma WA. Breast cancer and fat grafting: efficacy, safety and complications-a systematic review. Eur J Obstet Gynecol Reprod Biol. 2016; 207:100–08. https://doi.org/10.1016/j.ejogrb.2016.10.032 [PubMed]
- 6. Al Sufyani MA, Al Hargan AH, Al Shammari NA, Al Sufyani MA. Autologous fat transfer for breast augmentation: a review. Dermatol Surg. 2016; 42:1235–42. https://doi.org/10.1097/DSS.0000000000000791 [PubMed]
- 7. Largo RD, Tchang LA, Mele V, Scherberich A, Harder Y, Wettstein R, Schaefer DJ. Efficacy, safety and complications of autologous fat grafting to healthy breast tissue: a systematic review. J Plast Reconstr Aesthet Surg. 2014; 67:437–48. https://doi.org/10.1016/j.bjps.2013.11.011 [PubMed]
- 8. Claro F
Jr , Figueiredo JC, Zampar AG, Pinto-Neto AM. Applicability and safety of autologous fat for reconstruction of the breast. Br J Surg. 2012; 99:768–80. https://doi.org/10.1002/bjs.8722 [PubMed] - 9. Oberringer M, Bubel M, Jennewein M, Guthörl S, Morsch T, Bachmann S, Metzger W, Pohlemann T. The role of adipose-derived stem cells in a self-organizing 3D model with regard to human soft tissue healing. Mol Cell Biochem. 2018; 445:195–210. https://doi.org/10.1007/s11010-017-3265-9 [PubMed]
- 10. Douglass E, Greif S, Frishman WH. Epicardial fat: pathophysiology and clinical significance. Cardiol Rev. 2017; 25:230–35. https://doi.org/10.1097/CRD.0000000000000153 [PubMed]
- 11. Castro-Govea Y, De La Garza-Pineda O, Lara-Arias J, Chacón-Martínez H, Mecott-Rivera G, Salazar-Lozano A, Valdes-Flores E. Cell-assisted lipotransfer for the treatment of parry-romberg syndrome. Arch Plast Surg. 2012; 39:659–62. https://doi.org/10.5999/aps.2012.39.6.659 [PubMed]
- 12. Colwell AS, Borud LJ. Fat grafting to the breast revisited: safety and efficacy. Plast Reconstr Surg. 2008; 121:701–02. [PubMed]
- 13. Bateman ME, Strong AL, Hunter RS, Bratton MR, Komati R, Sridhar J, Riley KE, Wang G, Hayes DJ, Boue SM, Burow ME, Bunnell BA. Osteoinductive effects of glyceollins on adult mesenchymal stromal/stem cells from adipose tissue and bone marrow. Phytomedicine. 2017; 27:39–51. https://doi.org/10.1016/j.phymed.2017.02.003 [PubMed]
- 14. De Ugarte DA, Morizono K, Elbarbary A, Alfonso Z, Zuk PA, Zhu M, Dragoo JL, Ashjian P, Thomas B, Benhaim P, Chen I, Fraser J, Hedrick MH. Comparison of multi-lineage cells from human adipose tissue and bone marrow. Cells Tissues Organs. 2003; 174:101–09. https://doi.org/10.1159/000071150 [PubMed]
- 15. Wagner W, Wein F, Seckinger A, Frankhauser M, Wirkner U, Krause U, Blake J, Schwager C, Eckstein V, Ansorge W, Ho AD. Comparative characteristics of mesenchymal stem cells from human bone marrow, adipose tissue, and umbilical cord blood. Exp Hematol. 2005; 33:1402–16. https://doi.org/10.1016/j.exphem.2005.07.003 [PubMed]
- 16. Si Z, Wang X, Sun C, Kang Y, Xu J, Wang X, Hui Y. Adipose-derived stem cells: sources, potency, and implications for regenerative therapies. Biomed Pharmacother. 2019; 114:108765. https://doi.org/10.1016/j.biopha.2019.108765 [PubMed]
- 17. Marei HE, El-Gamal A, Althani A, Afifi N, Abd-Elmaksoud A, Farag A, Cenciarelli C, Thomas C, Anwarul H. Cholinergic and dopaminergic neuronal differentiation of human adipose tissue derived mesenchymal stem cells. J Cell Physiol. 2018; 233:936–45. https://doi.org/10.1002/jcp.25937 [PubMed]
- 18. Galbraith T, Clafshenkel WP, Kawecki F, Blanckaert C, Labbé B, Fortin M, Auger FA, Fradette J. A cell-based self-assembly approach for the production of human osseous tissues from adipose-derived stromal/stem cells. Adv Healthc Mater. 2017; 6:10.1002/adhm.201600889. https://doi.org/10.1002/adhm.201600889 [PubMed]
- 19. Kesireddy V. Evaluation of adipose-derived stem cells for tissue-engineered muscle repair construct-mediated repair of a murine model of volumetric muscle loss injury. Int J Nanomedicine. 2016; 11:1461–73. https://doi.org/10.2147/IJN.S101955 [PubMed]
- 20. Madonna R, Petrov L, Teberino MA, Manzoli L, Karam JP, Renna FV, Ferdinandy P, Montero-Menei CN, Ylä-Herttuala S, De Caterina R. Transplantation of adipose tissue mesenchymal cells conjugated with VEGF-releasing microcarriers promotes repair in murine myocardial infarction. Cardiovasc Res. 2015; 108:39–49. https://doi.org/10.1093/cvr/cvv197 [PubMed]
- 21. González-Cruz RD, Fonseca VC, Darling EM. Cellular mechanical properties reflect the differentiation potential of adipose-derived mesenchymal stem cells. Proc Natl Acad Sci USA. 2012; 109:E1523–29. https://doi.org/10.1073/pnas.1120349109 [PubMed]
- 22. Salgado AJ, Reis RL, Sousa NJ, Gimble JM. Adipose tissue derived stem cells secretome: soluble factors and their roles in regenerative medicine. Curr Stem Cell Res Ther. 2010; 5:103–10. https://doi.org/10.2174/157488810791268564 [PubMed]
- 23. Fraser J, Wulur I, Alfonso Z, Zhu M, Wheeler E. Differences in stem and progenitor cell yield in different subcutaneous adipose tissue depots. Cytotherapy. 2007; 9:459–67. https://doi.org/10.1080/14653240701358460 [PubMed]
- 24. Zuk PA, Zhu M, Mizuno H, Huang J, Futrell JW, Katz AJ, Benhaim P, Lorenz HP, Hedrick MH. Multilineage cells from human adipose tissue: implications for cell-based therapies. Tissue Eng. 2001; 7:211–28. https://doi.org/10.1089/107632701300062859 [PubMed]
- 25. Broughton KM, Sussman MA. Empowering adult stem cells for myocardial regeneration V2.0: success in small steps. Circ Res. 2016; 118:867–80. https://doi.org/10.1161/CIRCRESAHA.115.305227 [PubMed]
- 26. Shiraishi K, Kamei N, Takeuchi S, Yanada S, Mera H, Wakitani S, Adachi N, Ochi M. Quality evaluation of human bone marrow mesenchymal stem cells for cartilage repair. Stem Cells Int. 2017; 2017:8740294. https://doi.org/10.1155/2017/8740294 [PubMed]
- 27. Cao N, Liao T, Liu J, Fan Z, Zeng Q, Zhou J, Pei H, Xi J, He L, Chen L, Nan X, Jia Y, Yue W, Pei X. Clinical-grade human umbilical cord-derived mesenchymal stem cells reverse cognitive aging via improving synaptic plasticity and endogenous neurogenesis. Cell Death Dis. 2017; 8:e2996. https://doi.org/10.1038/cddis.2017.316 [PubMed]
- 28. Maruyama T, Jeong J, Sheu TJ, Hsu W. Stem cells of the suture mesenchyme in craniofacial bone development, repair and regeneration. Nat Commun. 2016; 7:10526. https://doi.org/10.1038/ncomms10526 [PubMed]
- 29. Corradetti B, Ferrari M. Nanotechnology for mesenchymal stem cell therapies. J Control Release. 2016; 240:242–50. https://doi.org/10.1016/j.jconrel.2015.12.042 [PubMed]
- 30. Choi JR, Yong KW, Wan Safwani WK. Effect of hypoxia on human adipose-derived mesenchymal stem cells and its potential clinical applications. Cell Mol Life Sci. 2017; 74:2587–600. https://doi.org/10.1007/s00018-017-2484-2 [PubMed]
- 31. Heo JS, Choi Y, Kim HS, Kim HO. Comparison of molecular profiles of human mesenchymal stem cells derived from bone marrow, umbilical cord blood, placenta and adipose tissue. Int J Mol Med. 2016; 37:115–25. https://doi.org/10.3892/ijmm.2015.2413 [PubMed]
- 32. Rebelatto CK, Aguiar AM, Moretão MP, Senegaglia AC, Hansen P, Barchiki F, Oliveira J, Martins J, Kuligovski C, Mansur F, Christofis A, Amaral VF, Brofman PS, et al. Dissimilar differentiation of mesenchymal stem cells from bone marrow, umbilical cord blood, and adipose tissue. Exp Biol Med (Maywood). 2008; 233:901–13. https://doi.org/10.3181/0712-RM-356 [PubMed]
- 33. Fehrer C, Lepperdinger G. Mesenchymal stem cell aging. Exp Gerontol. 2005; 40:926–30. https://doi.org/10.1016/j.exger.2005.07.006 [PubMed]
- 34. Fraser JK, Wulur I, Alfonso Z, Hedrick MH. Fat tissue: an underappreciated source of stem cells for biotechnology. Trends Biotechnol. 2006; 24:150–54. https://doi.org/10.1016/j.tibtech.2006.01.010 [PubMed]
- 35. Santos J, Milthorpe BK, Herbert BR, Padula MP. Proteomic analysis of human adipose derived stem cells during small molecule chemical stimulated pre-neuronal differentiation. Int J Stem Cells. 2017; 10:193–217. https://doi.org/10.15283/ijsc17036 [PubMed]
- 36. Park IS, Chung PS, Ahn JC. Adipose-derived stem cell spheroid treated with low-level light irradiation accelerates spontaneous angiogenesis in mouse model of hindlimb ischemia. Cytotherapy. 2017; 19:1070–78. https://doi.org/10.1016/j.jcyt.2017.06.005 [PubMed]
- 37. Toyserkani NM, Jørgensen MG, Tabatabaeifar S, Jensen CH, Sheikh SP, Sørensen JA. Concise review: a safety assessment of adipose-derived cell therapy in clinical trials: a systematic review of reported adverse events. Stem Cells Transl Med. 2017; 6:1786–94. https://doi.org/10.1002/sctm.17-0031 [PubMed]
- 38. Hsu MN, Liao HT, Li KC, Chen HH, Yen TC, Makarevich P, Parfyonova Y, Hu YC. Adipose-derived stem cell sheets functionalized by hybrid baculovirus for prolonged GDNF expression and improved nerve regeneration. Biomaterials. 2017; 140:189–200. https://doi.org/10.1016/j.biomaterials.2017.05.004 [PubMed]
- 39. Hight-Warburton W, Parsons M. Regulation of cell migration by α4 and α9 integrins. Biochem J. 2019; 476:705–18. https://doi.org/10.1042/BCJ20180415 [PubMed]
- 40. Chen JD, Xu FF, Zhu H, Li XM, Tang B, Liu YL, Zhang Y. [ICAM-1 regulates differentiation of MSC to adipocytes via activating MAPK pathway]. Zhongguo Shi Yan Xue Ye Xue Za Zhi. 2014; 22:160–65. https://doi.org/10.7534/j.issn.1009-2137.2014.01.031 [PubMed]
- 41. Abdal Dayem A, Lee S, Choi HY, Cho SG. The impact of adhesion molecules on the in vitro culture and differentiation of stem cells. Biotechnol J. 2018; 13:10.1002/biot.201700575. https://doi.org/10.1002/biot.201700575 [PubMed]
- 42. Hanson SE, Kim J, Hematti P. Comparative analysis of adipose-derived mesenchymal stem cells isolated from abdominal and breast tissue. Aesthet Surg J. 2013; 33:888–98. https://doi.org/10.1177/1090820X13496115 [PubMed]
- 43. Dolivo D, Hernandez S, Dominko T. Cellular lifespan and senescence: a complex balance between multiple cellular pathways. Bioessays. 2016 (Suppl 1); 38:S33–44. https://doi.org/10.1002/bies.201670906 [PubMed]
- 44. Eiselleova L, Matulka K, Kriz V, Kunova M, Schmidtova Z, Neradil J, Tichy B, Dvorakova D, Pospisilova S, Hampl A, Dvorak P. A complex role for FGF-2 in self-renewal, survival, and adhesion of human embryonic stem cells. Stem Cells. 2009; 27:1847–57. https://doi.org/10.1002/stem.128 [PubMed]
- 45. Bailly K, Soulet F, Leroy D, Amalric F, Bouche G. Uncoupling of cell proliferation and differentiation activities of basic fibroblast growth factor. FASEB J. 2000; 14:333–44. [PubMed]
- 46. Wu R, Ruan J, Sun Y, Liu M, Sha Z, Fan C, Wu Q. Long non-coding RNA HIF1A-AS2 facilitates adipose-derived stem cells (ASCs) osteogenic differentiation through miR-665/IL6 axis via PI3K/Akt signaling pathway. Stem Cell Res Ther. 2018; 9:348. https://doi.org/10.1186/s13287-018-1082-z [PubMed]
- 47. Lin S, Zhang Q, Shao X, Zhang T, Xue C, Shi S, Zhao D, Lin Y. IGF-1 promotes angiogenesis in endothelial cells/adipose-derived stem cells co-culture system with activation of PI3K/Akt signal pathway. Cell Prolif. 2017; 50:e12390. https://doi.org/10.1111/cpr.12390 [PubMed]
- 48. Gonzalez-Herrera IG, Prado-Lourenco L, Teshima-Kondo S, Kondo K, Cabon F, Arnal JF, Bayard F, Prats AC. IRES-dependent regulation of FGF-2 mRNA translation in pathophysiological conditions in the mouse. Biochem Soc Trans. 2006; 34:17–21. https://doi.org/10.1042/BST20060017 [PubMed]
- 49. Lin Y, Liu T, Cui T, Wang Z, Zhang Y, Tan P, Huang Y, Yu J, Wang D. RNAInter in 2020: RNA interactome repository with increased coverage and annotation. Nucleic Acids Res. 2020; 48:D189–97. https://doi.org/10.1093/nar/gkz804 [PubMed]
- 50. Van Etten J, Schagat TL, Hrit J, Weidmann CA, Brumbaugh J, Coon JJ, Goldstrohm AC. Human pumilio proteins recruit multiple deadenylases to efficiently repress messenger RNAs. J Biol Chem. 2012; 287:36370–83. https://doi.org/10.1074/jbc.M112.373522 [PubMed]
- 51. Schulz S, Köhler K, Schagdarsurengin U, Greiser P, Birkenmeier G, Müller-Werdan U, Werdan K, Gläser C. The human FGF2 level is influenced by genetic predisposition. Int J Cardiol. 2005; 101:265–71. https://doi.org/10.1016/j.ijcard.2004.03.049 [PubMed]
- 52. Xu FT, Liang ZJ, Li HM, Peng QL, Huang MH, Li de Q, Liang YD, Chi GY, Li de H, Yu BC, Huang JR. Ginsenoside Rg1 and platelet-rich fibrin enhance human breast adipose-derived stem cell function for soft tissue regeneration. Oncotarget. 2016; 7:35390–403. https://doi.org/10.18632/oncotarget.9360 [PubMed]
- 53. Xu FT, Li HM, Yin QS, Liang ZJ, Huang MH, Chi GY, Huang L, Liu DL, Nan H. Effect of activated autologous platelet-rich plasma on proliferation and osteogenic differentiation of human adipose-derived stem cells in vitro. Am J Transl Res. 2015; 7:257–70. [PubMed]
- 54. Katz AJ, Tholpady A, Tholpady SS, Shang H, Ogle RC. Cell surface and transcriptional characterization of human adipose-derived adherent stromal (hADAS) cells. Stem Cells. 2005; 23:412–23. https://doi.org/10.1634/stemcells.2004-0021 [PubMed]
- 55. Tabatabaei Qomi R, Sheykhhasan M. Adipose-derived stromal cell in regenerative medicine: a review. World J Stem Cells. 2017; 9:107–17. https://doi.org/10.4252/wjsc.v9.i8.107 [PubMed]
- 56. Dubey NK, Mishra VK, Dubey R, Deng YH, Tsai FC, Deng WP. Revisiting the advances in isolation, characterization and secretome of adipose-derived stromal/stem cells. Int J Mol Sci. 2018; 19:2200. https://doi.org/10.3390/ijms19082200 [PubMed]
- 57. Jo H, Koh G. Faster single-end alignment generation utilizing multi-thread for BWA. Biomed Mater Eng. 2015 (Suppl 1); 26:S1791–96. https://doi.org/10.3233/BME-151480 [PubMed]
- 58. Luo M, Liang C. LncRNA LINC00483 promotes gastric cancer development through regulating MAPK1 expression by sponging miR-490-3p. Biol Res. 2020; 53:14. https://doi.org/10.1186/s40659-020-00283-6 [PubMed]
- 59. Huang D, Bian B, Zhang M, Wang C, Li C, Liao W. The role and proteomic analysis of ethylene in hydrogen gas-induced adventitious rooting development in cucumber (Cucumis sativus L.) explants. PeerJ. 2020; 8:e8896. https://doi.org/10.7717/peerj.8896 [PubMed]
- 60. Song Y, Jin D, Ou N, Luo Z, Chen G, Chen J, Yang Y, Liu X. Gene expression profiles identified novel urine biomarkers for diagnosis and prognosis of high-grade bladder urothelial carcinoma. Front Oncol. 2020; 10:394. https://doi.org/10.3389/fonc.2020.00394 [PubMed]
- 61. Ritchie ME, Phipson B, Wu D, Hu Y, Law CW, Shi W, Smyth GK. Limma powers differential expression analyses for RNA-sequencing and microarray studies. Nucleic Acids Res. 2015; 43:e47. https://doi.org/10.1093/nar/gkv007 [PubMed]
- 62. Yu G, Wang LG, Han Y, He QY. clusterProfiler: an R package for comparing biological themes among gene clusters. OMICS. 2012; 16:284–87. https://doi.org/10.1089/omi.2011.0118 [PubMed]
- 63. Liberzon A, Birger C, Thorvaldsdóttir H, Ghandi M, Mesirov JP, Tamayo P. The molecular signatures database (MSigDB) hallmark gene set collection. Cell Syst. 2015; 1:417–25. https://doi.org/10.1016/j.cels.2015.12.004 [PubMed]
- 64. Bindea G, Mlecnik B, Hackl H, Charoentong P, Tosolini M, Kirilovsky A, Fridman WH, Pagès F, Trajanoski Z, Galon J. ClueGO: a cytoscape plug-in to decipher functionally grouped gene ontology and pathway annotation networks. Bioinformatics. 2009; 25:1091–93. https://doi.org/10.1093/bioinformatics/btp101 [PubMed]
- 65. Shannon P, Markiel A, Ozier O, Baliga NS, Wang JT, Ramage D, Amin N, Schwikowski B, Ideker T. Cytoscape: a software environment for integrated models of biomolecular interaction networks. Genome Res. 2003; 13:2498–504. https://doi.org/10.1101/gr.1239303 [PubMed]