


Introduction
Non-small cell lung cancer (NSCLC) is an extremely common and complicated malignant tumor worldwide [1]. Although NSCLC therapy has made significant progress recently, the 5-year overall survival (OS) rates remain low, at only approximately 25% [2–4]. Recently, immunotherapy was developed as a promising treatment for many cancers, including NSCLC. Studies found that tumor-infiltrating lymphocytes (TILs), such as CD8+ T cells and CD3+ T cells, up-regulated the expression of the markers of immunomodulator, which may affect the efficacy of immunotherapy and associate with a poor prognosis in NSCLC [5, 6]. DNA methylation plays a critical role in cell lineage specification [7, 8], and studies have indicated that DNA methylation can accurately estimate the distribution of cell subtypes in the blood [9, 10]. Therefore, DNA methylation may identify a specific molecular marker for the typing of immune cell subtypes, but it has rarely been explored in evaluating TILs in tumor tissue. In 2017, Jeschke, et al. first identified a methylation of TIL (MeTIL) signature by utilizing genome-wide DNA methylation profiling and then transformed the individual methylation values of the MeTIL markers into a score (MeTIL score) for the evaluation of TIL distributions to predict prognosis for breast cancer patients [11, 12]. Therefore, it is significant and imperative to uncover whether individual genes and their methylation statuses relate to TILs in tissue and prognosis in NSCLC.
Tsukushi (TSKU) is a protein-encoding gene that is a new member of the small leucine-rich repeat proteoglycan (SLRP) family. Previous studies have found that Tsku is involved in multiple cell signaling pathways, including the BMP, FGF, TGF-β, and Wnt pathways [13–15], and serves as a principal coordinator by interacting with signaling molecules in different animal tissues [16]. However, there have been few reports on exploring the functional significance of TSKU in human cancers. In March of 2019, the study published by Yamada, et al. first reported that TSKU overexpression enhanced cell proliferation activity and inhibited the epithelial-mesenchymal transition (EMT) in lung cancer cell lines [17]. Despite the possible functional potential of TSKU in cancer, little is known about whether TSKU is associated with clinical prognosis and tumor-infiltrating immune cells (TIICs) in human cancer. Previous studies have reported that TSKU serves as a modulator involved in the wound healing process via inhibition of TGF-β secretion from macrophages [18, 19]. Moreover, TGF-β is recognized as a pleiotropic cytokine with immunoregulatory properties that activate the differentiation and proliferation of immune cells, including T regulatory cells (Tregs) and T helper 17 (Th17) cells [20, 21]. Given the role of TSKU in regulating the expression of cytokines involved in immunoregulation in the wound healing process, we hypothesized that TSKU may be involved in the tumor immune response and have effects on prognosis in NSCLC.
Therefore, in this study, we analyzed the association between TSKU expression and the prognosis of NSCLC patients. We also evaluated the correlation of TSKU expression with TIIC levels in diverse tumor types. We further explored the relationship between TSKU methylation and the proportion of TIICs in lung cancer.
Results
The expression levels of TSKU in different cancers
Based on the analysis of the Oncomine database, TSKU expression was higher in lung, bladder, brain and CNS, and other cancers than in normal tissues (Figure 1A). Lower expression of TSKU in tumors than in normal tissues was observed in breast, kidney, and liver cancers and sarcoma. The detailed results of TSKU expression in multiple cancer types are summarized in Supplementary Table 1.
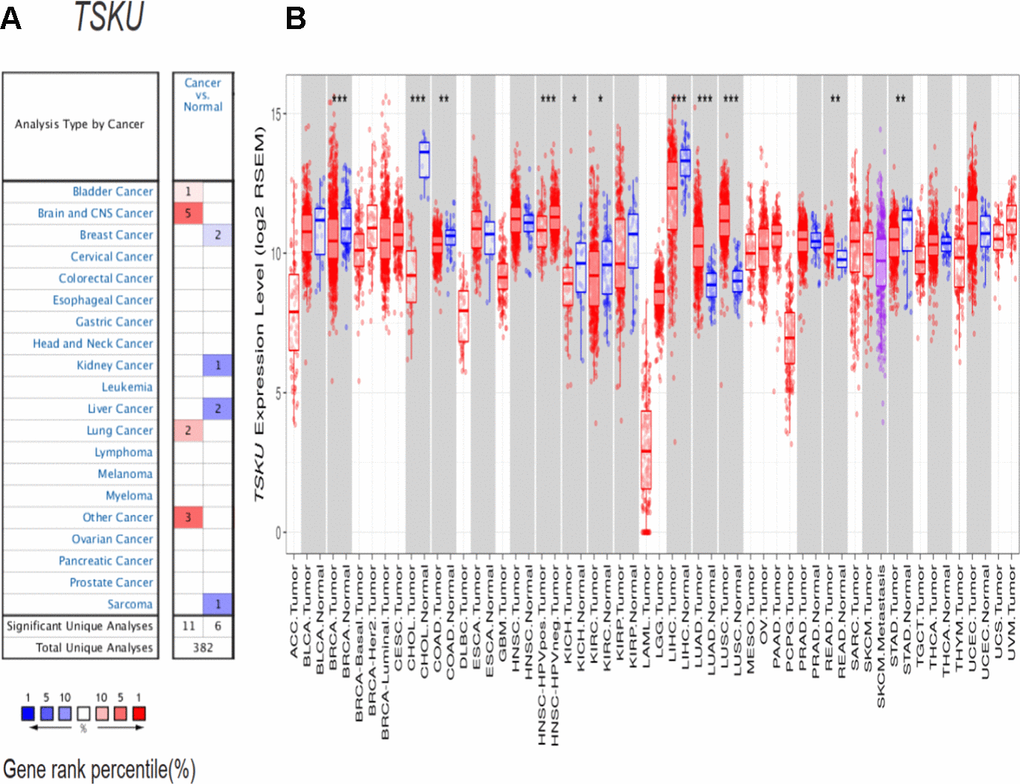
Figure 1. TSKU expression levels in different cancer types. (A) Elevated or decreased TSKU expression in data sets of different cancers compared with normal tissues in the Oncomine database. (B) TSKU mRNA levels in multiple tumor types from the TCGA database were analyzed by TIMER. (*P < 0.05, **P <0.01, ***P < 0.001).
To further validate the differential TSKU expression between different tumor and normal tissues, we analyzed TCGA (The Cancer Genome Atlas) data via the TIMER (Tumor Immune Estimation Resource) database. The expression of TSKU was significantly higher in LUAD (lung adenocarcinoma), LUSC (lung squamous cell carcinoma), and READ (rectum adenocarcinoma) datasets than in normal tissues (Figure 1B), while the expression of TSKU was lower in cancer than in normal tissues in BRCA (breast invasive carcinoma), CHOL (cholangiocarcinoma), COAD (colon adenocarcinoma), KICH (kidney chromophobe), KIRC (kidney renal clear cell carcinoma), LIHC (liver hepatocellular carcinoma), and STAD (stomach adenocarcinoma) datasets. These two databases showed consistent results in the differential TSKU expression between tumor and normal tissues in the lung cancer (LUAD and LUSC), BRCA, KICH, KIRC, and LIHC datasets.
Associations between TSKU expression and prognosis in different cancers
We evaluated the impact of TSKU expression on the prognosis of various cancers using PrognoScan (Supplementary Table 2). TSKU expression has been significantly associated with the prognosis in some kinds of cancers, including lung, head and neck, breast, and soft tissue cancers (Figure 2A–2F). The cohort (GSE31210, N=204) of lung cancer patients in PrognoScan demonstrated Kaplan-Meier survival curves that showed patients in the high TSKU expression have poorer survival than those in low TSKU expression in overall survival (P =1.90E-05) and relapse-free survival (P =6.60E-05). High TSKU expression was strongly associated with poor overall survival of patients with lung cancer by multivariate Cox regression analysis, with HROS of 4.700 (95 % CI 2.360–9.360, P =1.10E-05) and HRRFS of 3.400 (95 % CI 2.030–5.810, P =4.00E-06), respectively. In addition, the cohort (jacob-00182-HLM, N=79) of lung cancer patients with the high TSKU expression also showed poorer OS than those with low TSKU expression (P=0.029). Since the sample size is small for each cancer in PrognoScan, we merged GSE datasets in different survival statuses for every cancer type to perform a meta-analysis. The results of 14 types of meta-analysis included datasets in OS for 7 types of cancer, DFS (disease-free survival) for 2 types of cancer, DSS (disease specific survival) for 2 types of cancer, RFS (relapse-free survival) for 2 types of cancer, and DMFS (distant metastasis free survival) for 1 type of cancer. Among the 14 types of combination meta-analysis, we found that high TSKU expression was significantly associated with poorer OS in lung cancer and poorer DFS in colorectal cancer. (Lung cancer, N=1303, HR=1.260, 95% CI, 1.110-1.420; Colorectal cancer, N=413, HR=1.810, 95% CI, 1.000-3.290) (Supplementary Figure 1).
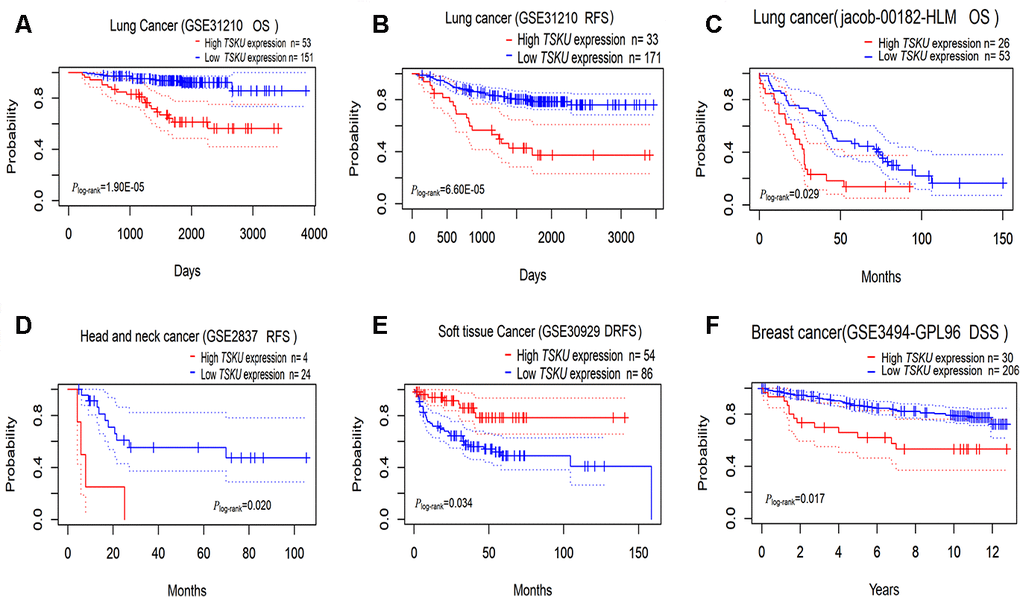
Figure 2. Kaplan-Meier survival curves comparing high and low TSKU expression levels in different tumors via PrognoScan. (A, B) Survival curves of OS and RFS in the lung cancer cohort (GSE31210, N =204); (C) Survival curves of OS in the lung cancer cohort (jacob-00182-HLM, N = 79); (D) Survival curves of RFS in the head and neck cancer cohort (GSE2837, N = 28); (E) Survival curves of DRFS in the soft tissue cancer cohort (GSE30929, N = 140); (F) Survival curves of DSS in the breast cancer cohort (GSE3494-GPL96, N = 236) OS, overall survival; DSS, disease Specific Survival; RFS, relapse-free survival; DRFS, distant recurrence-free survival.
By further validating the association between TSKU expression and prognosis as determined by OS and DFS in 33 types of cancers from TCGA data via GEPIA (Gene Expression Profiling Interactive Analysis) (Supplementary Figure 2), we found that patients in the high TSKU expression showed poorer survival than those in the low TSKU expression in LUAD (P=0.004), ACC (adrenocortical carcinoma), KIRC, MESO (mesothelioma), PAAD (pancreatic adenocarcinoma), and THCA (thyroid carcinoma). However, patients in the low TSKU expression demonstrated poorer survival than those in the high TSKU expression in DLBC (lymphoid neoplasm diffuse large B-cell lymphoma), PRAD (prostate adenocarcinoma), and UVM (uveal melanoma). These two databases revealed that TSKU expression has an impact on the prognosis of some cancers, including lung cancer (LUAD).
The correlation of TSKU expression with immune infiltration level in NSCLC
We further analyzed the correlation of TSKU expression with the immune infiltration levels of different cells in NSCLC, including LUAD and LUSC, and found that the expression level of TSKU significantly correlated with the levels of infiltrating B cells (cor=-0.232, P=2.58e-07), CD4+ T cells (cor =-0.166, P=2.39e-04), dendritic cells (cor =-0.105, P=2.08e-02), and CD8+ T cells (cor =-0.095, P=3.69e-02) in LUAD (Figure 3A). Meanwhile, the TSKU expression level also correlated with the levels of infiltrating B cells (cor =-0.184, P=5.52e-05), CD4+ T cells (cor =-0.205, P=6.35e-06), neutrophil (cor =-0.151, P=9.30e-04), DCs (dendritic cells) (cor =-0.143, P=1.74e-03), and CD8+ T cells (cor =-0.158, P=5.34e-04) in LUSC (Figure 3B).
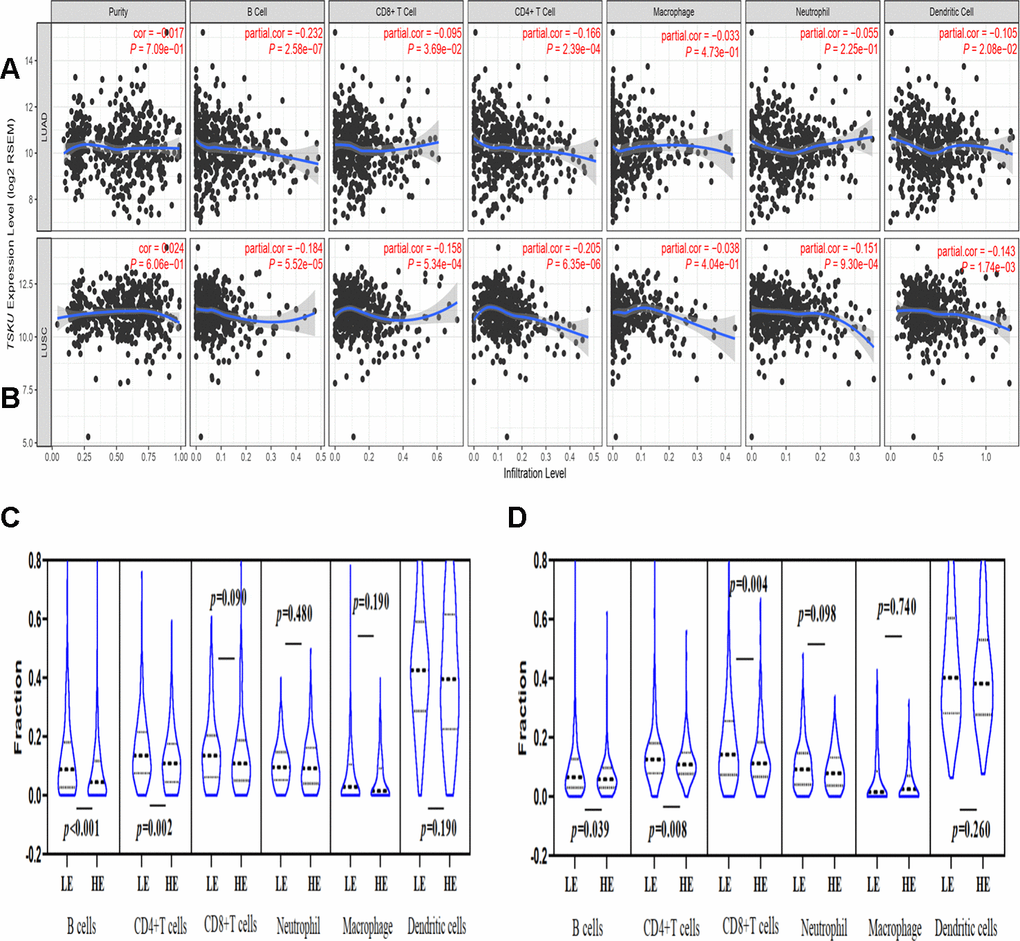
Figure 3. Correlations of TSKU expression with immune infiltration levels in LUAD and LUSC using TIMER database. (A) The correlations of TSKU expression with infiltrating levels of B cells, CD8+ T cells, CD4+ T cells, and dendritic cells in LUAD (N = 515). (B) The correlations of TSKU expression with infiltrating levels of B cells, CD8+ T cells, CD4+ T cells, neutrophils, and dendritic cells in LUSC (N = 501). (C) Comparing the proportions of different TIICs between groups with high TSKU expression levels (N = 238) and low TSKU expression levels (N = 238) in LUAD samples. (D) Comparing the proportions of different TIICs between groups with high TSKU expression levels (N = 241) and low TSKU expression levels (N = 241) in LUSC samples (LE, low expression; HE, high expression).
Moreover, we analyzed the proportion of different TIICs between groups with higher and lower TSKU expression levels in NSCLC using the TIMER database. The samples with high TSKU expression had a lower infiltration level of B cells and CD4+ T cells than the samples with low TSKU expression in LUAD and LUSC (Figure 3C, 3D).
Correlation between TSKU expression and gene markers of TIICs in lung cancer
Interestingly, while analyzing the relationships between TSKU expression and the marker genes of different immune cells, including CD8+ T cells, T cells (general), B cells, monocytes, TAMs, M1 and M2 macrophages, neutrophils, NK (natural killer) cells, DCs, exhausted T cells, and different subtypes of CD4+ T cells (T helper 1 (Th1) cells, T helper 2 (Th2) cells, follicular helper T (Tfh) cells, Th17 cells, and Tregs) in LUAD and LUSC (Table 1), we found that most of the gene markers of B cells and DCs significantly correlated with TSKU expression levels, especially CD19, CD20, CD21, and CD40L for B cells and HLA-DPB1, HLA-DQB1, HLA-DRA, and HLA-DPA1 for DCs (Figure 4A–4D).
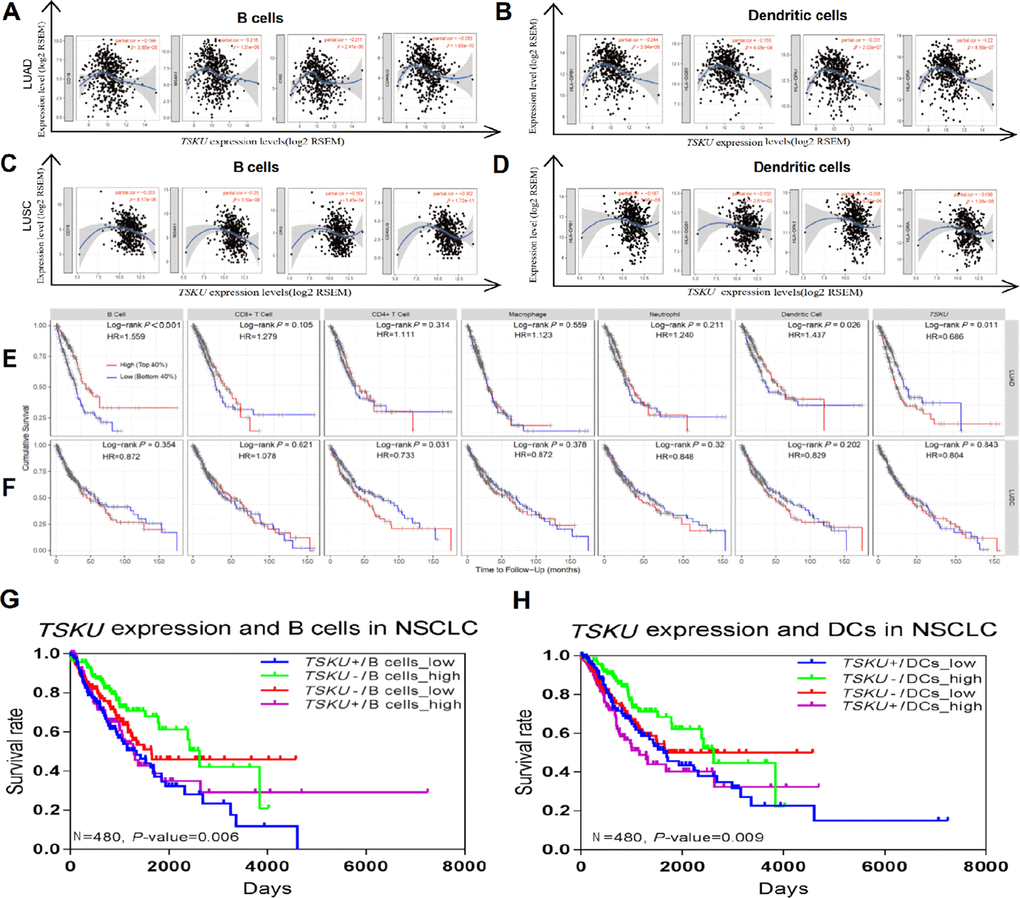
Figure 4. Correlations between TSKU expression and infiltrating B cell and DC levels in LUAD and LUSC. Gene markers include CD19, CD20, CD21, and CD40L for B cells; HLA-DPB1, HLA-DQB1, and HLA-DRA for dendritic cells. (A, B) Scatterplots of correlations between TSKU expression and gene markers of B cells (A) and DCs (B) in LUAD (N = 515). (C, D) Scatterplots of correlations between TSKU expression and gene markers of B cells (C) and DCs (D) in LUSC (N = 501). (E) Patients with low infiltrating levels of B cell and dendritic cell showed a poor survival in LUAD (B cell, N =496) (dendritic cell, N =501). (F) Patients with high infiltrating levels of CD4+ T cell showed a poor survival in LUSC (CD4+ T cell, N =492). (G) The survival of patients with high or low TSKU expression and high or low infiltrating B cell levels in NSCLC (N=480). (H) The survival of patients with high or low TSKU expression and high or low infiltrating DC levels in NSCLC (N=480). (The marked blue means high TSKU expression and low B cells (or DCs) infiltration (N=120); marked green means low TSKU expression and high B cells (or DCs) infiltration (N=120); marked red means low TSKU expression and low B cells (or DCs) infiltration (N=120); marked purple means high TSKU expression and high B cells (or DCs) infiltration (N=120)).
Table 1. Correlations between TSKU expression and markers of TIICs in the TIMER database.
| Immune cells | Gene markers | LUAD | LUSC | ||||||||||||||||||||||||||||||||||||||||||||||||||||||||||||||||||||||||||||||||||||||||||||||||
| None | Purity | None | Purity | ||||||||||||||||||||||||||||||||||||||||||||||||||||||||||||||||||||||||||||||||||||||||||||||||
| Cor | P | Cor | P | Cor | P | Cor | P | ||||||||||||||||||||||||||||||||||||||||||||||||||||||||||||||||||||||||||||||||||||||||||||
| CD8+ T cell | CD8A | -0.034 | 0.440 | -0.057 | 0.210 | -0.230 | *** | -0.230 | *** | ||||||||||||||||||||||||||||||||||||||||||||||||||||||||||||||||||||||||||||||||||||||||||
| CD8B | -0.035 | 0.430 | -0.050 | 0.270 | -0.288 | *** | -0.283 | *** | |||||||||||||||||||||||||||||||||||||||||||||||||||||||||||||||||||||||||||||||||||||||||||
| T cell | CD3D | -0.081 | 0.068 | -0.107 | * | -0.241 | *** | -0.250 | *** | ||||||||||||||||||||||||||||||||||||||||||||||||||||||||||||||||||||||||||||||||||||||||||
| (general) | CD3E | -0.111 | * | -0.148 | ** | -0.220 | *** | -0.234 | *** | ||||||||||||||||||||||||||||||||||||||||||||||||||||||||||||||||||||||||||||||||||||||||||
| CD2 | -0.116 | * | -0.145 | * | -0.232 | *** | -0.240 | *** | |||||||||||||||||||||||||||||||||||||||||||||||||||||||||||||||||||||||||||||||||||||||||||
| B cell | CD19 | -0.138 | ** | -0.184 | *** | -0.182 | *** | -0.203 | *** | ||||||||||||||||||||||||||||||||||||||||||||||||||||||||||||||||||||||||||||||||||||||||||
| CD20 (MS4A1) | -0.177 | *** | -0.216 | *** | -0.223 | *** | -0.250 | *** | |||||||||||||||||||||||||||||||||||||||||||||||||||||||||||||||||||||||||||||||||||||||||||
| CD21 (CR2) | -0.193 | *** | -0.211 | *** | -0.154 | ** | -0.163 | ** | |||||||||||||||||||||||||||||||||||||||||||||||||||||||||||||||||||||||||||||||||||||||||||
| CD40L (CD40LG) | -0.258 | *** | -0.283 | *** | -0.271 | *** | -0.302 | *** | |||||||||||||||||||||||||||||||||||||||||||||||||||||||||||||||||||||||||||||||||||||||||||
| Monocyte | CD86 | -0.081 | 0.066 | -0.094 | * | -0.171 | ** | -0.167 | ** | ||||||||||||||||||||||||||||||||||||||||||||||||||||||||||||||||||||||||||||||||||||||||||
| CD115 (CSF1R) | -0.084 | 0.058 | -0.084 | 0.064 | -0.079 | 0.078 | -0.060 | 0.190 | |||||||||||||||||||||||||||||||||||||||||||||||||||||||||||||||||||||||||||||||||||||||||||
| TAM | CCL2 | -0.064 | 0.130 | -0.064 | 0.160 | -0.151 | ** | -0.138 | * | ||||||||||||||||||||||||||||||||||||||||||||||||||||||||||||||||||||||||||||||||||||||||||
| CD68 | 0.060 | 0.170 | 0.064 | 0.150 | 0.052 | 0.240 | 0.079 | 0.083 | |||||||||||||||||||||||||||||||||||||||||||||||||||||||||||||||||||||||||||||||||||||||||||
| IL10 | -0.058 | 0.190 | -0.060 | 0.180 | -0.132 | * | -0.120 | * | |||||||||||||||||||||||||||||||||||||||||||||||||||||||||||||||||||||||||||||||||||||||||||
| M1 | INOS (NOS2) | 0.034 | 0.440 | 0.014 | 0.750 | -0.180 | *** | -0.190 | *** | ||||||||||||||||||||||||||||||||||||||||||||||||||||||||||||||||||||||||||||||||||||||||||
| Macrophage | IRF5 | 0.032 | 0.470 | 0.039 | 0.390 | 0.116 | * | 0.139 | * | ||||||||||||||||||||||||||||||||||||||||||||||||||||||||||||||||||||||||||||||||||||||||||
| COX2 (PTGS2) | -0.091 | * | -0.103 | * | -0.121 | * | -0.123 | * | |||||||||||||||||||||||||||||||||||||||||||||||||||||||||||||||||||||||||||||||||||||||||||
| M2 | CD163 | -0.029 | 0.510 | -0.034 | 0.450 | -0.088 | 0.050 | -0.075 | 0.100 | ||||||||||||||||||||||||||||||||||||||||||||||||||||||||||||||||||||||||||||||||||||||||||
| Macrophage | VSIG4 | -0.060 | 0.170 | -0.061 | 0.180 | -0.074 | 0.098 | -0.056 | 0.220 | ||||||||||||||||||||||||||||||||||||||||||||||||||||||||||||||||||||||||||||||||||||||||||
| MS4A4A | -0.097 | * | -0.103 | * | -0.105 | * | -0.089 | 0.050 | |||||||||||||||||||||||||||||||||||||||||||||||||||||||||||||||||||||||||||||||||||||||||||
| Neutrophils | CD66b (CEACAM8) | -0.263 | *** | -0.253 | *** | -0.076 | 0.090 | -0.072 | 0.120 | ||||||||||||||||||||||||||||||||||||||||||||||||||||||||||||||||||||||||||||||||||||||||||
| CD11b (ITGAM) | -0.128 | * | -0.125 | * | -0.152 | ** | -0.152 | ** | |||||||||||||||||||||||||||||||||||||||||||||||||||||||||||||||||||||||||||||||||||||||||||
| CCR7 | -0.173 | *** | -0.204 | *** | -0.255 | *** | -0.274 | *** | |||||||||||||||||||||||||||||||||||||||||||||||||||||||||||||||||||||||||||||||||||||||||||
| Natural | KIR2DL1 | 0.013 | 0.780 | 0.007 | 0.870 | -0.074 | 0.090 | -0.072 | 0.120 | ||||||||||||||||||||||||||||||||||||||||||||||||||||||||||||||||||||||||||||||||||||||||||
| killer | KIR2DL3 | 0.067 | 0.130 | 0.059 | 0.190 | -0.104 | * | -0.100 | * | ||||||||||||||||||||||||||||||||||||||||||||||||||||||||||||||||||||||||||||||||||||||||||
| KIR2DL4 | 0.132 | * | 0.114 | * | 0.036 | 0.430 | 0.053 | 0.250 | |||||||||||||||||||||||||||||||||||||||||||||||||||||||||||||||||||||||||||||||||||||||||||
| KIR3DL1 | 0.009 | 0.850 | 0.007 | 0.870 | -0.096 | * | -0.081 | 0.078 | |||||||||||||||||||||||||||||||||||||||||||||||||||||||||||||||||||||||||||||||||||||||||||
| Dendritic | HLA-DPB1 | -0.223 | *** | -0.244 | *** | -0.179 | *** | -0.187 | *** | ||||||||||||||||||||||||||||||||||||||||||||||||||||||||||||||||||||||||||||||||||||||||||
| cell | HLA-DQB1 | -0.146 | ** | -0.159 | ** | -0.108 | * | -0.102 | * | ||||||||||||||||||||||||||||||||||||||||||||||||||||||||||||||||||||||||||||||||||||||||||
| HLA-DRA | -0.203 | *** | -0.220 | *** | -0.197 | *** | -0.198 | *** | |||||||||||||||||||||||||||||||||||||||||||||||||||||||||||||||||||||||||||||||||||||||||||
| HLA-DPA1 | -0.218 | *** | -0.231 | *** | -0.199 | *** | -0.205 | *** | |||||||||||||||||||||||||||||||||||||||||||||||||||||||||||||||||||||||||||||||||||||||||||
| BDCA-1 (CD1C) | -0.311 | *** | -0.305 | *** | -0.065 | 0.150 | -0.052 | 0.260 | |||||||||||||||||||||||||||||||||||||||||||||||||||||||||||||||||||||||||||||||||||||||||||
| BDCA-4 (NRP1) | -0.178 | *** | -0.175 | *** | 0.077 | 0.084 | 0.107 | * | |||||||||||||||||||||||||||||||||||||||||||||||||||||||||||||||||||||||||||||||||||||||||||
| Th1 | T-bet (TBX21) | -0.042 | 0.340 | -0.062 | 0.170 | -0.235 | *** | -0.245 | *** | ||||||||||||||||||||||||||||||||||||||||||||||||||||||||||||||||||||||||||||||||||||||||||
| STAT4 | -0.113 | * | -0.129 | * | -0.209 | *** | -0.219 | *** | |||||||||||||||||||||||||||||||||||||||||||||||||||||||||||||||||||||||||||||||||||||||||||
| STAT1 | 0.131 | * | 0.128 | * | -0.063 | 0.160 | -0.057 | 0.210 | |||||||||||||||||||||||||||||||||||||||||||||||||||||||||||||||||||||||||||||||||||||||||||
| IFN-γ (IFNG) | 0.084 | 0.056 | 0.076 | 0.090 | -0.166 | ** | -0.159 | ** | |||||||||||||||||||||||||||||||||||||||||||||||||||||||||||||||||||||||||||||||||||||||||||
| TNF-α (TNF) | -0.103 | * | -0.101 | * | -0.159 | ** | -0.159 | ** | |||||||||||||||||||||||||||||||||||||||||||||||||||||||||||||||||||||||||||||||||||||||||||
| Th2 | GATA3 | 0.035 | 0.430 | 0.047 | 0.300 | -0.143 | * | -0.150 | ** | ||||||||||||||||||||||||||||||||||||||||||||||||||||||||||||||||||||||||||||||||||||||||||
| STAT6 | -0.122 | * | -0.124 | * | -0.084 | 0.062 | -0.095 | * | |||||||||||||||||||||||||||||||||||||||||||||||||||||||||||||||||||||||||||||||||||||||||||
| STAT5A | -0.093 | * | -0.097 | * | -0.185 | *** | -0.186 | *** | |||||||||||||||||||||||||||||||||||||||||||||||||||||||||||||||||||||||||||||||||||||||||||
| IL13 | -0.088 | * | -0.087 | 0.054 | -0.159 | ** | -0.150 | ** | |||||||||||||||||||||||||||||||||||||||||||||||||||||||||||||||||||||||||||||||||||||||||||
| Tfh | BCL6 | -0.176 | *** | -0.171 | ** | 0.106 | * | 0.099 | * | ||||||||||||||||||||||||||||||||||||||||||||||||||||||||||||||||||||||||||||||||||||||||||
| IL21 | -0.033 | 0.450 | -0.040 | 0.370 | -0.148 | ** | -0.134 | * | |||||||||||||||||||||||||||||||||||||||||||||||||||||||||||||||||||||||||||||||||||||||||||
| Th17 | STAT3 | -0.075 | 0.095 | -0.075 | 0.098 | 0.007 | 0.880 | 0.007 | 0.880 | ||||||||||||||||||||||||||||||||||||||||||||||||||||||||||||||||||||||||||||||||||||||||||
| IL17A | -0.036 | 0.420 | -0.054 | 0.230 | -0.115 | * | -0.115 | * | |||||||||||||||||||||||||||||||||||||||||||||||||||||||||||||||||||||||||||||||||||||||||||
| Treg | FOXP3 | -0.024 | 0.590 | -0.043 | 0.360 | -0.178 | *** | -0.181 | *** | ||||||||||||||||||||||||||||||||||||||||||||||||||||||||||||||||||||||||||||||||||||||||||
| CCR8 | -0.116 | * | -0.130 | * | -0.177 | *** | -0.170 | ** | |||||||||||||||||||||||||||||||||||||||||||||||||||||||||||||||||||||||||||||||||||||||||||
| STAT5B | -0.186 | *** | -0.188 | *** | -0.043 | 0.330 | -0.030 | 0.510 | |||||||||||||||||||||||||||||||||||||||||||||||||||||||||||||||||||||||||||||||||||||||||||
| TGFβ (TGFB1) | -0.177 | *** | -0.186 | *** | 0.154 | ** | 0.162 | ** | |||||||||||||||||||||||||||||||||||||||||||||||||||||||||||||||||||||||||||||||||||||||||||
| T cell | PD-1 (PDCD1) | 0.035 | 0.420 | 0.021 | 0.640 | -0.206 | *** | -0.212 | *** | ||||||||||||||||||||||||||||||||||||||||||||||||||||||||||||||||||||||||||||||||||||||||||
| exhaustion | CTLA4 | -0.097 | * | -0.122 | * | -0.211 | *** | -0.219 | *** | ||||||||||||||||||||||||||||||||||||||||||||||||||||||||||||||||||||||||||||||||||||||||||
| LAG3 | 0.083 | 0.059 | 0.074 | 0.100 | -0.175 | *** | -0.172 | ** | |||||||||||||||||||||||||||||||||||||||||||||||||||||||||||||||||||||||||||||||||||||||||||
| TIM-3 (HAVCR2) | -0.035 | 0.430 | -0.040 | 0.370 | -0.125 | * | -0.110 | * | |||||||||||||||||||||||||||||||||||||||||||||||||||||||||||||||||||||||||||||||||||||||||||
| GZMB | 0.141 | * | 0.132 | * | -0.180 | *** | -0.182 | *** | |||||||||||||||||||||||||||||||||||||||||||||||||||||||||||||||||||||||||||||||||||||||||||
| LUAD, lung adenocarcinoma; LUSC, lung squamous cell carcinoma; TAM, tumor-associated macrophage; Th, T helper cell; Tfh, Follicular helper T cell; Treg, regulatory T cell; Cor(r), value of Spearman’s correlation; None, correlation without adjustment. Purity, correlation adjusted by tumor purity. *P < 0.05; **P < 0.001; ***P < 0.0001. | |||||||||||||||||||||||||||||||||||||||||||||||||||||||||||||||||||||||||||||||||||||||||||||||||||
Prognostication of different NSCLC subtypes defined by the combination of TSKU expression and infiltrating B cell (or DC) levels
Tumor-infiltrating lymphocytes, which are identified as an independent predictor of survival, have the potential to affect cancer prognosis [22, 23]. Therefore, we analyzed the impact of TIICs on the prognosis of NSCLC patients and found that patients with low levels of infiltrating B cell (HR=1.559; 95% CI, 1.179-2.062, Cox P<0.001) and DC (HR=1.437; 95% CI, 1.041-1.984, Cox P=0.026) presented a poorer prognosis in LUAD than patients with high levels of infiltrating B cell and DC (Figure 4E). However, the infiltration level of B cells (HR=0.872; 95% CI, 0.645-1.180, Cox P=0.354) and DCs (HR=0.829; 95% CI, 0.618-1.113, Cox P=0.202) have no associated significantly with the prognosis in LUSC (Figure 4F). Based on the association of infiltrating B cell and DC levels with prognosis in LUAD, we further explored whether the combined analysis of TSKU expression and infiltrating B cell (or DC) levels yielded different prognoses in NSCLC patients. Patients with high TSKU expression and low infiltrating B cell levels had poorer survival than those with low TSKU expression and high infiltrating B cell levels (HR=2.016; 95% CI, 1.330-3.057, Cox P=0.001) (Figure 4G). A similar result was observed with infiltrating DC levels (HR=1.678; 95% CI, 1.080-2.607, Cox P=0.021) (Figure 4H). Regardless of the disease subtype (LUAD or LUSC), patients with high TSKU expression and low infiltrating B cell levels presented a poorer survival than those with low TSKU expression and high infiltrating B cell levels. However, high or low TSKU expression and infiltrating DC levels did not affect the prognosis of patients in either LUAD or LUSC datasets (Supplementary Figure 3). These data suggest that the combination of high TSKU expression and low infiltrating B cell levels may be associated with a poor prognosis in NSCLC patients.
Correlation between TSKU promoter hypomethylation and elevated TSKU expression in NSCLC
To clarify whether the aberrant methylation of the promoter affects gene expression, we evaluated the correlation between the TSKU methylation level in the promoter region and its expression. There were quite a few probes in the promoter regions with a negative correlation between methylation and expression for TSKU in LUAD and LUSC, as analyzed by MEXPRESS (Supplementary Figure 4). We further analyzed the correlation of TSKU methylation with the expression level in LUAD and LUSC datasets from TCGA data using the MethHC database. There were significant negative correlations between differential TSKU methylation and expression level of all CpG sites (probes) in the promoter in LUAD (cor =-0.598, P <0.001) and LUSC (cor =-0.351, P <0.001) datasets (Figure 5A, 5D). There were significant negative correlations between differential methylation and expression for some probes in the promoter region in LUAD, including cg20708135 (cor =-0.598, P <0.001) and cg20886049 (cor =-0.558, P <0.001) (Figure 5B, 5C). In addition, a similar trend was observed in LUSC including the cg20708135 (cor =-0.329, P <0.05) and cg20886049 (cor =-0.374 P =0.004) probes (Figure 5E, 5F).
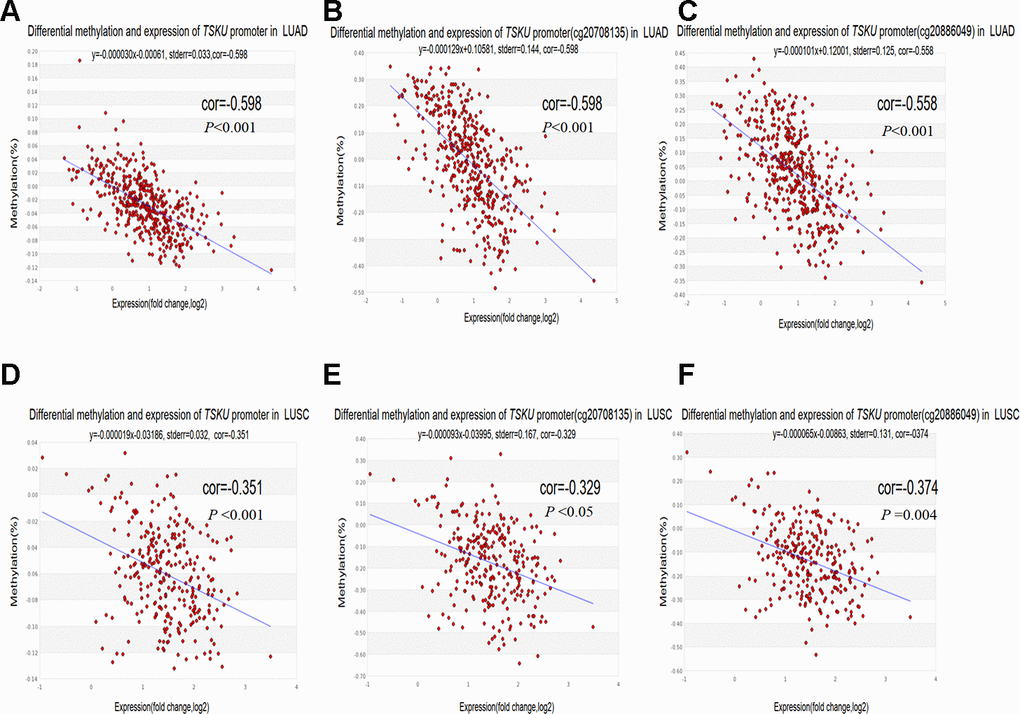
Figure 5. Correlations between differential TSKU methylation and expression in LUAD and LUSC. TCGA Infinium 450K methylation probes in the promoter region, including the cg20708175 and cg20886049 probes; (A–C) Scatterplots of correlations between differential TSKU methylation and expression level of all CpG sites (probes) in the promoter (A), cg20708175 (B), and cg20886049 (C) in LUAD (N = 471). (D–F) Scatterplots of correlations between differential TSKU methylation and expression level of all CpG sites (probes) in the promoter (D), cg20708175 (E), and cg20886049 (F) in LUSC (N = 406). Cor(r): the value determined by calculating the Pearson correlation coefficient.
Correlation between TSKU methylation and the proportion of infiltrating immune cells in LUAD and LUSC
We calculated the proportion of infiltrating immune cells in every sample using the EpiDISH (Epigenetic Dissection of Intra Sample Heterogeneity) algorithm and TCGA Infinium 450K methylation data in LUAD and LUSC (Figure 6A, 6B) datasets and found that cancer tissues contained a higher proportion of infiltrating B cells, NKs, CD4+ T cells, and granulocytes than of CD8+ T cells and monocytes in both LUAD and LUSC datasets. Furthermore, the abundance of B cells and CD8+ T cells in cancer tissues were significantly higher than those in normal tissues. Nevertheless, the level of granulocytes in cancer tissues was lower than that in normal tissues (Figure 6C, 6D).
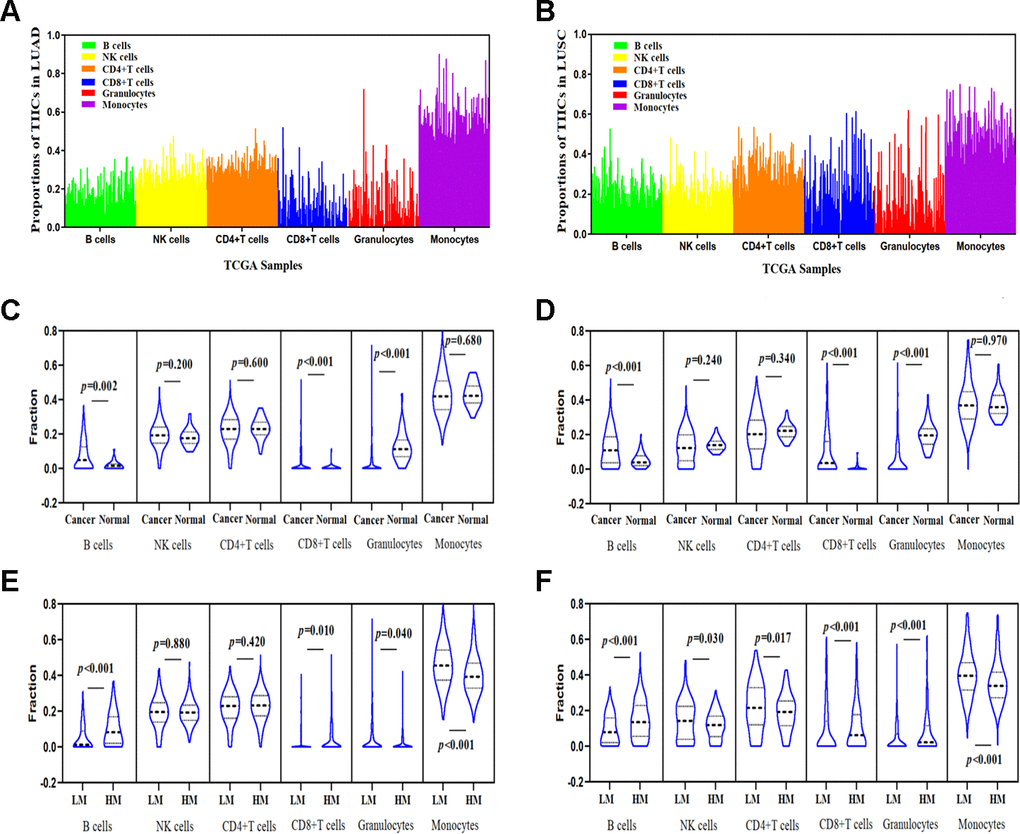
Figure 6. Correlations between TSKU methylation and the proportions of infiltrating immune cells in LUAD and LUSC. (A) The proportions of tumor-infiltrating immune cells (TIICs) in every sample using the TCGA Infinium 450K methylation data in LUAD (N = 460). (B) The proportions of TIICs in every sample using the TCGA Infinium 450K methylation data in LUSC (N = 372). (C) Comparing the proportions of TIICs in tumor tissues (N = 460) and normal tissues (N = 32) in LUAD datasets. (D) Comparing the proportions of TIICs in tumor tissues (N = 372) and normal tissue (N = 43) in LUSC datasets. (E) Comparing the proportions of different TIICs between groups with high TSKU methylation levels (N = 230) and low TSKU methylation levels (N = 230) in LUAD samples. (F) Comparing the proportions of different TIICs between groups with high TSKU methylation levels (N = 185) and low TSKU methylation levels (N = 185) in LUSC samples (LM, low methylation; HM, high methylation).
We further evaluated the proportion of different TIICs between groups with higher and lower TSKU methylation levels in LUAD and LUSC samples from TCGA datasets (Figure 6E, 6F) and found that the proportion of B cells in cancer tissues with TSKU hypermethylation was higher than that in cancer tissues with TSKU hypomethylation. However, the level of monocytes was higher in hypomethylated samples than that in hypermethylated samples.
TSKU methylation status and prognosis in different cancers
In light of the significant negative correlation between differential methylation and expression, we further analyzed the association between methylation level of TSKU and overall survival in 24 types of cancer from TCGA data via the MethSurv database (Supplementary Table 3). We found that low TSKU methylation was associated with poor prognosis in ACC, BRCA, KICH, LGG (brain lower grade glioma), and PAAD, while high TSKU methylation was associated with good prognosis in KIRC and UCEC (uterine corpus endometrial carcinoma). However, there was no significant association between TSKU methylation and prognosis in LUAD (HR=0.824, Cox P=0.240; HR=0.866, Cox P=0.420) and LUSC (HR=1.198, Cox P=0.360; HR=1.338, Cox P=0.150).
Discussion
In this study, we found for the first time that the levels of TSKU methylation and expression significantly correlated with tumor-infiltrating B cell levels in NSCLC. In addition, high TSKU expression combined with low tumor-infiltrating B cell levels may influence the prognosis of patients with NSCLC.
According to the Oncomine and TIMER databases, we found consistent results on the differential TSKU expression between tumor and normal tissues for the lung, breast, kidney, and liver cancer (Figures 1A, 1B). We further analyzed the association between TSKU expression and the prognosis of these cancers and found that, only in lung cancer, the high expression of TSKU was associated with a poor OS based on the above results of TSKU expression differential analysis (Figure 2A, 2B; Supplementary Figure 2A–2G). In addition, we found only research on the functional mechanism of TSKU expression in lung cancer [17]. This study will support us to explore the association between TSKU expression and the prognosis of lung cancer patients based on public databases. These results suggest that TSKU may be a potential independent prognostic biomarker in lung cancer.
In previous studies, TSKU serves as a modulator involved in the wound healing process via inhibition of TGF-β secretion from macrophages (18). Since TGF-β is a pleiotropic cytokine with immunoregulatory properties that activates the differentiation and proliferation of immune cells, TSKU may involve in the immunoregulation and relate to the immune infiltrating cells. Therefore, we analyzed the relationship between TSKU and the level of tumor immune infiltrating cells to explore whether it is associated with the prognosis of lung cancer. And found that high TSKU expression correlated with low B cell and CD4+ T cell infiltration levels in both LUAD and LUSC (Figure 3A–3D). Moreover, we also observed correlations between TSKU expression and gene markers of B cells and DCs, which demonstrated that TSKU expression might play a role in regulating tumor immunity in both LUAD and LUSC (Table 1). Although these correlations between TSKU expression and gene markers were not very strong, the low levels of B cell and DC infiltration, and mainly of B cell infiltration, were associated with poor prognosis in LUAD (Figure 4E). We further found that the combination of high TSKU expression and low B cell infiltration identified a group of patients with poor survival in NSCLC (Figure 4G). These results suggest that the co-assessment of TSKU expression and B cell infiltration levels may provide a useful assessment of the immunologic state in NSCLC and, in turn, the patient survival.
Recent studies have focused on the possible mechanisms that may explain why elevated TSKU expression and a low level of infiltrating B cells are associated with poor survival in NSCLC. TSKU, a 37 kDa core protein, is a prototype class IV SLRP that is considered a structural element of the extracellular matrix (ECM) [24]. Similar to TSKU, decorin (DCN) and biglycan (BGN) are two key SLRPs that have altered expression in various cancers with diverse clinical outcomes, and BGN serves as a potential marker of cancer proliferation associated with poor clinical outcome [25–27]. Moreover, the expression of CD40, serving as a marker of DLBC, is co-expressed with BGN and associated with a superior prognosis [28]. The previous study also confirmed that TSKU is more highly expressed in their lung cancer tissue (N=62) and cells and activates proliferation in cancer cells [17]. Therefore, TSKU expression may be related to clinical outcome development and may be indicative of a potential mechanism in which TSKU regulates B cell functions in NSCLC. Nevertheless, the mechanisms behind high TSKU expression leading to poorer survival in NSCLC patients with low levels of infiltrating B cell need to be studied further.
Another important aspect of this study was the significant negative correlation between differential methylation and expression in the promoter region (probes cg20708135 and cg20886049) of TSKU (Figures 5A–5F). However, we did not observe a significant association between TSKU methylation and prognosis in NSCLC (Supplementary Table 3). A possible reason is that methylation does not serve as an independent factor regulating gene expression. Other factors, including copy number alterations, transcription factor production and recruitment, histone modifications, and microRNA expression, may also play a role in regulating TSKU expression [29]. In addition, the TSKU methylation probes from the TCGA Illumina Infinium HumanMethylation450 BeadChip are limited and do not include all probes to analyze the effects on prognosis. Therefore, it is necessary to explore further other factors affecting TSKU expression in addition to methylation. Currently, our results preliminarily demonstrate that TSKU hypomethylation in the promoter region increases the expression levels of TSKU and worsens the clinical outcome of patients. More importantly, we first utilized methylation levels in patients with NSCLC to evaluate the abundance of six types of TIICs (Figure 6A, 6B). The proportion of B cells and CD8+ T cells were higher in tumors than in normal tissue (Figure 6C, 6D). According to TSKU methylation levels, we further analyzed TSKU hypomethylation levels in cancer tissue and found a low proportion of B cells in lung cancer patients (Figure 6E, 6F). These results are consistent with those found during the evaluation of infiltrating B cell levels in samples with high TSKU expression.
TILs were identified as a favorable prognostic marker that plays a critical role in shaping tumor development and determining treatment responses in the tumor microenvironment [30]. The reasons for selecting DNA methylation to estimate the composition and purity of TIICs were based on the following studies. First, a previous study demonstrated that DNA methylation might represent a specific biomarker for distinguishing immune cell subtypes [11]. Additionally, in 2019, Loo Yau, H et al. found that the aberrant epigenomes, including methylation alterations, observed in cancer cells and infiltrating immune cells that play a critical role in driving or mediating tumor progression and provide a vulnerability that may be utilized in epigenetic therapy [31]. Recent studies have often utilized DNA methylation data profiled by TCGA to accurately estimate tumor purity and cellular composition, such as MethylCIBERTSORT, EpiDISH, and CP (constrained projection) algorithms. In addition, EpiDISH has robust correlations, and it outperformed both CP and MethylCIBERSORT in terms of estimating mixed cell proportion [32–34]. Therefore, we selected the deconvolution method of EpiDISH to evaluate the intrasample heterogeneity for six types of TIICs. Advances in the deconvolution method to estimate both tumor purity and composition from DNA methylation data might provide some insights that reveal potential biomarkers for immunotherapy response and increase our understanding of the contribution of the tumor microenvironment in lung cancer.
In this study, we first evaluated the abundance of six TIICs in LUAD and LUSC methylation data using the EpiDISH algorithm. More extensive studies to determine the generality and feasibility of the EpiDISH method in other tumor tissues are needed. Additionally, we should further validate whether TSKU methylation in the promoter affects the expression of TSKU and clinical outcome using large NSCLC patient sample sets.
In summary, TSKU overexpression that combines with low infiltrating B cell levels to influence the prognosis of NSCLC patients. Our study provides insights into the potential role of TSKU in tumor immunology and its identification as a prognostic biomarker.
Materials and Methods
Oncomine database analysis
We compared the TSKU mRNA levels of multiple cancers with the levels of corresponding normal tissues using the Oncomine database (http://www.oncomine.org). The threshold was selected as a P value=1E-5, with a 1.5-fold change.
Prognoscan database analysis
The associations between the expression of TSKU and survival in various types of cancer were analyzed using the PrognoScan database (http://www.abren.net/PrognoScan/) [35]. The significance threshold was a Cox P-value< 0.05.
TIMER database analysis
TIMER is an integrative database that analyzes immune infiltrates in different cancer types (https://cistrome.shinyapps.io/timer), including information on TIICs in over 10,000 tumor samples across 32 cancer types from TCGA data, by applying a statistical deconvolution method to estimate the abundance of TIICs from gene expression profiles [36, 37]. We first validated the differential TSKU expression between tumor and normal tissues using the Oncomine database analysis. Then, we further analyzed the correlations between expression of TSKU and the abundance of infiltrating immune cells, including B cells, CD4+ T cells, CD8+ T cells, neutrophils, macrophages, and dendritic cells, in different cancer tissues and analyzed the association of TIICs with the prognosis of lung cancer patients. The correlation between TSKU expression and gene markers of TIICs (CD8+ T cells, T cells (general), B cells, monocytes, TAMs, M1 macrophages, M2 macrophages, neutrophils, NK cells, DCs, Th1 cells, Th2 cells, Tfh cells, Th17 cells, Tregs, and exhausted T cells) were estimated by Spearman's correlation [38, 39].
GEPIA database analysis
We validated the associations between TSKU expression levels and prognosis in multiple cancers using the GEPIA database (http://gepia.cancer-pku.cn/index.html) [40].
MethHC database analysis
The MethHC database (http://awi.cuhk.edu.cn/~MethHC/methhc_2020/php/index.php) integrates data regarding DNA methylation, gene expression, and the correlations between methylation and gene expression for different cancers of TCGA [41]. We analyzed the correlation between differential methylation and expression of TSKU in both LUAD and LUSC datasets using the MethHC database.
MEXPRESS database analysis
MEXPRESS is a data visualization tool designed for the easy visualization of TCGA expression, DNA methylation, and clinical data (http://mexpress.be/) [42]. We analyzed the methylation of TSKU with probes distributed in different regions and visualized the correlation between TSKU methylation and expression via the localization of each probe.
MethSurv database analysis
The MethSurv database (https://biit.cs.ut.ee/methsurv/) performs univariable and multivariable survival analysis based on DNA methylation data from TCGA [43]. We evaluated the associations between methylation levels of TSKU and prognosis in multiple tumor types.
EpiDISH package analysis
EpiDISH is an R package for inferring the proportions of a priori known cell subtypes present in a sample representing a mixture of such cell types. This package identifies differentially methylated cell types and the direction of their methylation change, including six cell subtypes (B cells, CD4+ T cells, CD8+ T cells, NK cells, monocytes, and granulocytes; noting that granulocytes consist of neutrophils and eosinophils) [32, 34]. We assessed the proportion of six tumor-infiltrating cells in the tumor and normal tissues of lung cancer patients using the EpiDISH algorithm via the TCGA Infinium Human Methylation 450K arrays. According to the abundance of the six immune cells in every patient, we evaluated the proportions of different TIICs between groups with higher and lower TSKU methylation levels in LUAD and LUSC datasets.
Statistical analysis
The proportion of immune cell tumors estimated by gene expression data was downloaded by the TIMER database and HumanMethylation450 data to quantify immune infiltration analysis were downloaded by the TCGA lung cancer dataset from the NCI GDC data. These results were analyzed using the R statistical package (R version 3.5.2) and GraphPad Prism 8.00 software (La Jolla, CA, USA). All P values were two-sided, and P values <0.05 were considered statistically significant for all statistical analyses.
Author Contributions
Y Zhao designed and supervised the research project and revised the manuscript until submitting it. H Huang and D Zhang performed research, analyzed data, wrote the manuscript. J Fu and L Zhao collected the data, analyzed the data. D Li, H Sun, X Liu, J Xu, and T Tian, performed research, analyzed the data. L Zhang, Y Liu, and Y Zhang performed the figures, edited the data.
Acknowledgments
We are indebted to all public databases for their data assistance during the preparation of this manuscript.
Conflicts of Interest
The authors have no conflicts of interest to declare.
References
- 1. Bray F, Ferlay J, Soerjomataram I, Siegel RL, Torre LA, Jemal A. Global cancer statistics 2018: GLOBOCAN estimates of incidence and mortality worldwide for 36 cancers in 185 countries. CA Cancer J Clin. 2018; 68:394–424. https://doi.org/10.3322/caac.21492 [PubMed]
- 2. Roth JA, Goulart BH, Ravelo A, Kolkey H, Ramsey SD. Survival gains from first-line systemic therapy in metastatic non-small cell lung cancer in the U.S., 1990-2015: progress and opportunities. Oncologist. 2017; 22:304–10. https://doi.org/10.1634/theoncologist.2016-0253 [PubMed]
- 3. Garon EB, Hellmann MD, Rizvi NA, Carcereny E, Leighl NB, Ahn MJ, Eder JP, Balmanoukian AS, Aggarwal C, Horn L, Patnaik A, Gubens M, Ramalingam SS, et al. Five-year overall survival for patients with advanced Non‒Small-cell lung cancer treated with pembrolizumab: results from the phase I KEYNOTE-001 study. J Clin Oncol. 2019; 37:2518–27. https://doi.org/10.1200/JCO.19.00934 [PubMed]
- 4. Shahid M, Choi TG, Nguyen MN, Matondo A, Jo YH, Yoo JY, Nguyen NN, Yun HR, Kim J, Akter S, Kang I, Ha J, Maeng CH, et al. An 8-gene signature for prediction of prognosis and chemoresponse in non-small cell lung cancer. Oncotarget. 2016; 7:86561–72. https://doi.org/10.18632/oncotarget.13357 [PubMed]
- 5. El-Guindy DM, Helal DS, Sabry NM, Abo El-Nasr M. Programmed cell death ligand-1 (PD-L1) expression combined with CD8 tumor infiltrating lymphocytes density in non-small cell lung cancer patients. J Egypt Natl Canc Inst. 2018; 30:125–131. https://doi.org/10.1016/j.jnci.2018.08.003 [PubMed]
- 6. Schalper KA, Brown J, Carvajal-Hausdorf D, McLaughlin J, Velcheti V, Syrigos KN, Herbst RS, Rimm DL. Objective measurement and clinical significance of TILs in non-small cell lung cancer. J Natl Cancer Inst. 2015; 107:dju435. https://doi.org/10.1093/jnci/dju435 [PubMed]
- 7. Sørensen AL, Timoskainen S, West FD, Vekterud K, Boquest AC, Ahrlund-Richter L, Stice SL, Collas P. Lineage-specific promoter DNA methylation patterns segregate adult progenitor cell types. Stem Cells Dev. 2010; 19:1257–66. https://doi.org/10.1089/scd.2009.0309 [PubMed]
- 8. Berdasco M, Esteller M. DNA methylation in stem cell renewal and multipotency. Stem Cell Res Ther. 2011; 2:42. https://doi.org/10.1186/scrt83 [PubMed]
- 9. Houseman EA, Accomando WP, Koestler DC, Christensen BC, Marsit CJ, Nelson HH, Wiencke JK, Kelsey KT. DNA methylation arrays as surrogate measures of cell mixture distribution. BMC Bioinformatics. 2012; 13:86. https://doi.org/10.1186/1471-2105-13-86 [PubMed]
- 10. Koestler DC, Christensen B, Karagas MR, Marsit CJ, Langevin SM, Kelsey KT, Wiencke JK, Houseman EA. Blood-based profiles of DNA methylation predict the underlying distribution of cell types: a validation analysis. Epigenetics. 2013; 8:816–26. https://doi.org/10.4161/epi.25430 [PubMed]
- 11. Jeschke J, Bizet M, Desmedt C, Calonne E, Dedeurwaerder S, Garaud S, Koch A, Larsimont D, Salgado R, Van den Eynden G, Willard Gallo K, Bontempi G, Defrance M, et al. DNA methylation-based immune response signature improves patient diagnosis in multiple cancers. J Clin Invest. 2017; 127:3090–102. https://doi.org/10.1172/JCI91095 [PubMed]
- 12. Matondo A, Jo YH, Shahid M, Choi TG, Nguyen MN, Nguyen NN, Akter S, Kang I, Ha J, Maeng CH, Kim SY, Lee JS, Kim J, Kim SS. The prognostic 97 chemoresponse gene signature in ovarian cancer. Sci Rep. 2017; 7:9689. https://doi.org/10.1038/s41598-017-08766-5 [PubMed]
- 13. Morris SA, Almeida AD, Tanaka H, Ohta K, Ohnuma S. Tsukushi modulates Xnr2, FGF and BMP signaling: regulation of xenopus germ layer formation. PLoS One. 2007; 2:e1004. https://doi.org/10.1371/journal.pone.0001004 [PubMed]
- 14. Niimori D, Kawano R, Felemban A, Niimori-Kita K, Tanaka H, Ihn H, Ohta K. Tsukushi controls the hair cycle by regulating TGF-β1 signaling. Dev Biol. 2012; 372:81–87. https://doi.org/10.1016/j.ydbio.2012.08.030 [PubMed]
- 15. Ohta K, Ito A, Kuriyama S, Lupo G, Kosaka M, Ohnuma S, Nakagawa S, Tanaka H. Tsukushi functions as a Wnt signaling inhibitor by competing with Wnt2b for binding to transmembrane protein Frizzled4. Proc Natl Acad Sci USA. 2011; 108:14962–67. https://doi.org/10.1073/pnas.1100513108 [PubMed]
- 16. Ahmad SA, Anam MB, Ito N, Ohta K. Involvement of tsukushi in diverse developmental processes. J Cell Commun Signal. 2018; 12:205–10. https://doi.org/10.1007/s12079-018-0452-8 [PubMed]
- 17. Yamada T, Ohta K, Motooka Y, Fujino K, Kudoh S, Tenjin Y, Sato Y, Matsuo A, Ikeda K, Suzuki M, Ito T. Significance of tsukushi in lung cancer. Lung Cancer. 2019; 131:104–11. https://doi.org/10.1016/j.lungcan.2019.03.024 [PubMed]
- 18. Niimori D, Kawano R, Niimori-Kita K, Ihn H, Ohta K. Tsukushi is involved in the wound healing by regulating the expression of cytokines and growth factors. J Cell Commun Signal. 2014; 8:173–77. https://doi.org/10.1007/s12079-014-0241-y [PubMed]
- 19. Markman JL, Shiao SL. Impact of the immune system and immunotherapy in colorectal cancer. J Gastrointest Oncol. 2015; 6:208–23. https://doi.org/10.3978/j.issn.2078-6891.2014.077 [PubMed]
- 20. Wang R, Zhu J, Dong X, Shi M, Lu C, Springer TA. GARP regulates the bioavailability and activation of TGFβ. Mol Biol Cell. 2012; 23:1129–39. https://doi.org/10.1091/mbc.E11-12-1018 [PubMed]
- 21. Yoshimura A, Wakabayashi Y, Mori T. Cellular and molecular basis for the regulation of inflammation by TGF-beta. J Biochem. 2010; 147:781–92. https://doi.org/10.1093/jb/mvq043 [PubMed]
- 22. Hennequin A, Derangère V, Boidot R, Apetoh L, Vincent J, Orry D, Fraisse J, Causeret S, Martin F, Arnould L, Beltjens F, Ghiringhelli F, Ladoire S. Tumor infiltration by Tbet+ effector T cells and CD20+ B cells is associated with survival in gastric cancer patients. Oncoimmunology. 2015; 5:e1054598. https://doi.org/10.1080/2162402X.2015.1054598 [PubMed]
- 23. Dunn GP, Dunn IF, Curry WT. Focus on TILs: prognostic significance of tumor infiltrating lymphocytes in human glioma. Cancer Immun. 2007; 7:12. [PubMed]
- 24. Appunni S, Anand V, Khandelwal M, Gupta N, Rubens M, Sharma A. Small leucine rich proteoglycans (decorin, biglycan and lumican) in cancer. Clin Chim Acta. 2019; 491:1–7. https://doi.org/10.1016/j.cca.2019.01.003 [PubMed]
- 25. Gu X, Ma Y, Xiao J, Zheng H, Song C, Gong Y, Xing X. Up-regulated biglycan expression correlates with the Malignancy in human colorectal cancers. Clin Exp Med. 2012; 12:195–99. https://doi.org/10.1007/s10238-011-0155-4 [PubMed]
- 26. Wang B, Li GX, Zhang SG, Wang Q, Wen YG, Tang HM, Zhou CZ, Xing AY, Fan JW, Yan DW, Qiu GQ, Yu ZH, Peng ZH. Biglycan expression correlates with aggressiveness and poor prognosis of gastric cancer. Exp Biol Med (Maywood). 2011; 236:1247–53. https://doi.org/10.1258/ebm.2011.011124 [PubMed]
- 27. Neill T, Schaefer L, Iozzo RV. Decorin: a guardian from the matrix. Am J Pathol. 2012; 181:380–87. https://doi.org/10.1016/j.ajpath.2012.04.029 [PubMed]
- 28. Rydström K, Joost P, Ehinger M, Edén P, Jerkeman M, Cavallin-Ståhl E, Linderoth J. Gene expression profiling indicates that immunohistochemical expression of CD40 is a marker of an inflammatory reaction in the tumor stroma of diffuse large B-cell lymphoma. Leuk Lymphoma. 2012; 53:1764–68. https://doi.org/10.3109/10428194.2012.666541 [PubMed]
- 29. Nagarajan RP, Costello JF. Epigenetic mechanisms in glioblastoma multiforme. Semin Cancer Biol. 2009; 19:188–97. https://doi.org/10.1016/j.semcancer.2009.02.005 [PubMed]
- 30. Sasidharan Nair V, Toor SM, Taha RZ, Shaath H, Elkord E. DNA methylation and repressive histones in the promoters of PD-1, CTLA-4, TIM-3, LAG-3, TIGIT, PD-L1, and galectin-9 genes in human colorectal cancer. Clin Epigenetics. 2018; 10:104. https://doi.org/10.1186/s13148-018-0539-3 [PubMed]
- 31. Loo Yau H, Ettayebi I, De Carvalho DD. The cancer epigenome: exploiting its vulnerabilities for immunotherapy. Trends Cell Biol. 2019; 29:31–43. https://doi.org/10.1016/j.tcb.2018.07.006 [PubMed]
- 32. Teschendorff AE, Breeze CE, Zheng SC, Beck S. A comparison of reference-based algorithms for correcting cell-type heterogeneity in epigenome-wide association studies. BMC Bioinformatics. 2017; 18:105. https://doi.org/10.1186/s12859-017-1511-5 [PubMed]
- 33. Chakravarthy A, Furness A, Joshi K, Ghorani E, Ford K, Ward MJ, King EV, Lechner M, Marafioti T, Quezada SA, Thomas GJ, Feber A, Fenton TR. Pan-cancer deconvolution of tumour composition using DNA methylation. Nat Commun. 2018; 9:3220. https://doi.org/10.1038/s41467-018-05570-1 [PubMed]
- 34. Zheng SC, Breeze CE, Beck S, Teschendorff AE. Identification of differentially methylated cell types in epigenome-wide association studies. Nat Methods. 2018; 15:1059–66. https://doi.org/10.1038/s41592-018-0213-x [PubMed]
- 35. Mizuno H, Kitada K, Nakai K, Sarai A. PrognoScan: a new database for meta-analysis of the prognostic value of genes. BMC Med Genomics. 2009; 2:18. https://doi.org/10.1186/1755-8794-2-18 [PubMed]
- 36. Li T, Fan J, Wang B, Traugh N, Chen Q, Liu JS, Li B, Liu XS. TIMER: a web server for comprehensive analysis of tumor-infiltrating immune cells. Cancer Res. 2017; 77:e108–10. https://doi.org/10.1158/0008-5472.CAN-17-0307 [PubMed]
- 37. Li B, Severson E, Pignon JC, Zhao H, Li T, Novak J, Jiang P, Shen H, Aster JC, Rodig S, Signoretti S, Liu JS, Liu XS. Comprehensive analyses of tumor immunity: implications for cancer immunotherapy. Genome Biol. 2016; 17:174. https://doi.org/10.1186/s13059-016-1028-7 [PubMed]
- 38. Siemers NO, Holloway JL, Chang H, Chasalow SD, Ross-MacDonald PB, Voliva CF, Szustakowski JD. Genome-wide association analysis identifies genetic correlates of immune infiltrates in solid tumors. PLoS One. 2017; 12:e0179726. https://doi.org/10.1371/journal.pone.0179726 [PubMed]
- 39. Danaher P, Warren S, Dennis L, D’Amico L, White A, Disis ML, Geller MA, Odunsi K, Beechem J, Fling SP. Gene expression markers of tumor infiltrating leukocytes. J Immunother Cancer. 2017; 5:18. https://doi.org/10.1186/s40425-017-0215-8 [PubMed]
- 40. Tang Z, Li C, Kang B, Gao G, Li C, Zhang Z. GEPIA: a web server for cancer and normal gene expression profiling and interactive analyses. Nucleic Acids Res. 2017; 45:W98–102. https://doi.org/10.1093/nar/gkx247 [PubMed]
- 41. Huang WY, Hsu SD, Huang HY, Sun YM, Chou CH, Weng SL, Huang HD. MethHC: a database of DNA methylation and gene expression in human cancer. Nucleic Acids Res. 2015; 43:D856–61. https://doi.org/10.1093/nar/gku1151 [PubMed]
- 42. Koch A, De Meyer T, Jeschke J, Van Criekinge W. MEXPRESS: visualizing expression, DNA methylation and clinical TCGA data. BMC Genomics. 2015; 16:636. https://doi.org/10.1186/s12864-015-1847-z [PubMed]
- 43. Modhukur V, Iljasenko T, Metsalu T, Lokk K, Laisk-Podar T, Vilo J. MethSurv: a web tool to perform multivariable survival analysis using DNA methylation data. Epigenomics. 2018; 10:277–88. https://doi.org/10.2217/epi-2017-0118 [PubMed]